
| Export of goods from Finland and import to Finland | Trade Balance |

| Import 1,000 € | Export 1,000 € | Trade 1,000 € | Trade Balance 1,000 € | |
|---|---|---|---|---|
| 2019 Q1 | 7,436 | 1,971 | 9,407 | -5,464 |
| 2019 Q2 | 8,893 | 3,171 | 12,065 | -5,722 |
| 2019 Q3 | 7,051 | 2,647 | 9,698 | -4,405 |
| 2019 Q4 | 7,956 | 2,370 | 10,326 | -5,586 |
| 2020 Q1 | 4,845 | 4,150 | 8,995 | -695 |
| 2020 Q2 | 8,195 | 2,342 | 10,537 | -5,853 |
| 2020 Q3 | 4,985 | 1,350 | 6,334 | -3,635 |
| 2020 Q4 | 5,417 | 1,214 | 6,631 | -4,203 |
| 2021 Q1 | 5,662 | 1,873 | 7,535 | -3,789 |
| 2021 Q2 | 6,361 | 1,931 | 8,292 | -4,430 |
| 2021 Q3 | 5,405 | 3,240 | 8,645 | -2,166 |
| 2021 Q4 | 6,734 | 3,110 | 9,844 | -3,624 |
| 2022 Q1 | 4,598 | 4,067 | 8,665 | -531 |
| 2022 Q2 | 3,686 | 4,276 | 7,962 | 589 |
| 2022 Q3 | 2,803 | 3,298 | 6,101 | 495 |
| 2022 Q4 | 3,819 | 4,163 | 7,982 | 344 |
| 2023 Q1 | 1,882 | 3,653 | 5,534 | 1,771 |
| 2023 Q2 | 2,959 | 5,844 | 8,803 | 2,885 |
| 2023 Q3 | 1,833 | 3,221 | 5,054 | 1,388 |
| 2023 Q4 | 2,246 | 5,406 | 7,653 | 3,160 |
| 2024 Q1 | 200 | 3,822 | 4,022 | 3,622 |
| 2024 Q2 | 96 | 3,813 | 3,909 | 3,717 |
| 2024 Q3 | 59 | 5,232 | 5,292 | 5,173 |
| 2024 Q4 | 320 | 3,188 | 3,508 | 2,867 |
| 2025 Q1 | 115 | 2,297 | 2,411 | 2,182 |
| 2025 Q2 | 231 | 3,541 | 3,772 | 3,309 |
| 2025 Q3 | 325 | 2,079 | 2,404 | 1,754 |
| 2025 Q4 | 278 | 3,244 | 3,521 | 2,966 |
| 2026 Q1 | 502 | 1,582 | 2,083 | 1,080 |
| 2026 Q2 | 337 | 7,168 | 7,506 | 6,831 |
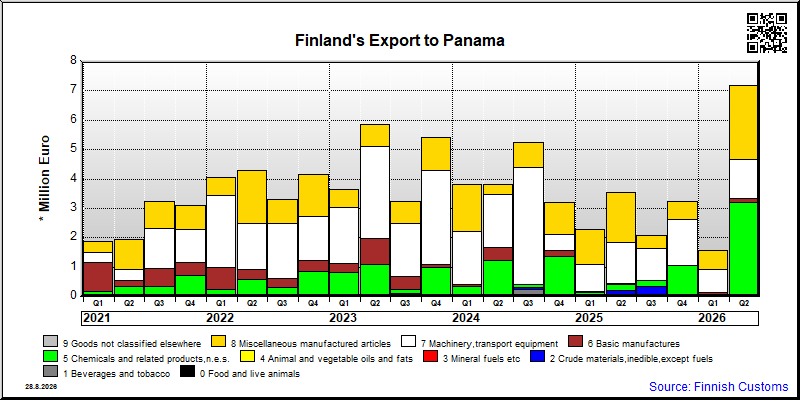
| Q2 / 2026 | Q2 / 2025 | Muutos edellisestä vastaavasta kaudesta % | ||
|---|---|---|---|---|
| 1,000 € | % | 1,000 € | ||
| 0. Food and live animals | 0 | 0 | 0 | .. |
| 1. Beverages and tobacco | 8 | 0.1 | 10 | -16.5 |
| 2. Crude materials,inedible,except fuels | 0 | 0 | 190 | .. |
| 5. Chemicals and related products,n.e.s. | 3,185 | 44.4 | 202 | .. |
| 6. Basic manufactures | 152 | 2.1 | 27 | 468.6 |
| 7. Machinery,transport equipment | 1,306 | 18.2 | 1,412 | -7.5 |
| 8. Miscellaneous manufactured articles | 2,518 | 35.1 | 1,700 | 48.1 |
| All groups combined | 7,168 | 100.0 | 3,541 | 102.5 |
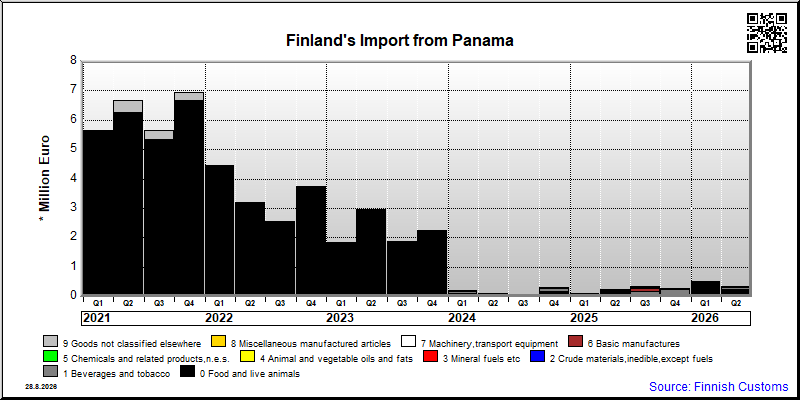
| Q2 / 2026 | Q2 / 2025 | Muutos edellisestä vastaavasta kaudesta % | ||
|---|---|---|---|---|
| 1,000 € | % | 1,000 € | ||
| 0. Food and live animals | 245 | 72.5 | 194 | 26.0 |
| 1. Beverages and tobacco | 75 | 22.2 | 18 | 320.6 |
| 4. Animal and vegetable oils and fats | 0 | 0 | 16 | .. |
| 5. Chemicals and related products,n.e.s. | 6 | 1.8 | 3 | 91.1 |
| 6. Basic manufactures | 0 | 0.1 | 0 | .. |
| 7. Machinery,transport equipment | 2 | 0.6 | 0 | 379.6 |
| 8. Miscellaneous manufactured articles | 9 | 2.6 | 5 | 90.9 |
| 9. Goods not classified elsewhere | 0 | 0.1 | 0 | 163.8 |
| All groups combined | 337 | 100.0 | 235 | 43.7 |
| Classification | Description | Year level | Quarter level | Month level | Year 2026 sofar |
|---|---|---|---|---|---|
| SITC | Standard International Trade Classification (classification system is maintained by the United Nations) | ███ | ███ | ||
| BEC | The standard of statistical classification of BEC (Broad Economic Categories) is upheld by the UN and it is based on SITC-nomenclature. | ███ | ███ | ||
| NACE | National industrial classification based on Statistical Classification of Economic Activities in the European Community Nomenclature générale des Activités économiques dans les Communautés européennes | ███ | ███ | ||
| CPA | CPA = Classification of Products by Activities | ███ | ███ | ||
| CN | The Combined Nomenclature is the common nomenclature of the European Community. | ███ | ███ |