
| Export of goods from Finland and import to Finland | Trade Balance |

| Import 1,000 € | Export 1,000 € | Trade 1,000 € | Trade Balance 1,000 € | |
|---|---|---|---|---|
| 2019 Q1 | 251 | 454 | 705 | 202 |
| 2019 Q2 | 70 | 77 | 147 | 7 |
| 2019 Q3 | 4 | 31 | 35 | 27 |
| 2019 Q4 | 13 | 51 | 64 | 39 |
| 2020 Q1 | 5 | 67 | 71 | 62 |
| 2020 Q2 | 12 | 47 | 59 | 35 |
| 2020 Q3 | 18 | 695 | 713 | 677 |
| 2020 Q4 | 14 | 143 | 158 | 129 |
| 2021 Q1 | 13 | 79 | 92 | 66 |
| 2021 Q2 | 10 | 772 | 782 | 762 |
| 2021 Q3 | 16 | 95 | 111 | 78 |
| 2021 Q4 | 61 | 1,123 | 1,184 | 1,063 |
| 2022 Q1 | 29 | 261 | 290 | 232 |
| 2022 Q2 | 69 | 119 | 187 | 50 |
| 2022 Q3 | 19 | 129 | 148 | 110 |
| 2022 Q4 | 31 | 136 | 167 | 105 |
| 2023 Q1 | 10 | 104 | 114 | 95 |
| 2023 Q2 | 9 | 139 | 148 | 131 |
| 2023 Q3 | 22 | 176 | 198 | 153 |
| 2023 Q4 | 25 | 147 | 172 | 122 |
| 2024 Q1 | 22 | 252 | 275 | 230 |
| 2024 Q2 | 30 | 179 | 209 | 150 |
| 2024 Q3 | 25 | 266 | 290 | 241 |
| 2024 Q4 | 53 | 653 | 706 | 600 |
| 2025 Q1 | 34 | 210 | 244 | 176 |
| 2025 Q2 | 36 | 118 | 154 | 82 |
| 2025 Q3 | 51 | 144 | 195 | 93 |
| 2025 Q4 | 26 | 211 | 237 | 185 |
| 2026 Q1 | 109 | 1,307 | 1,415 | 1,198 |
| 2026 Q2 | 21,492 | 3,356 | 24,847 | -18,136 |
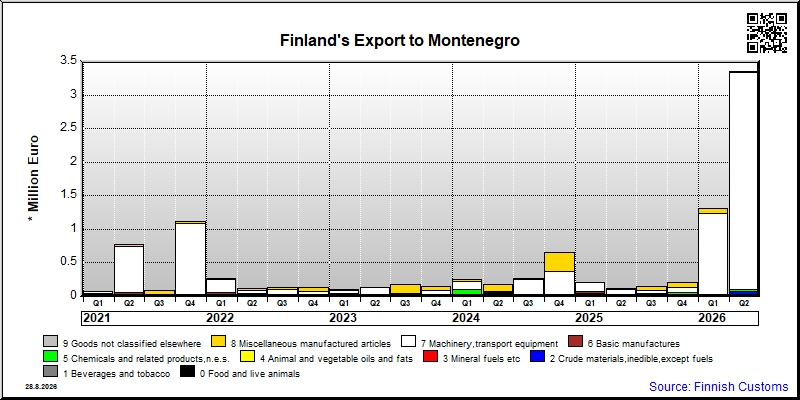
| Q2 / 2026 | Q2 / 2025 | Muutos edellisestä vastaavasta kaudesta % | ||
|---|---|---|---|---|
| 1,000 € | % | 1,000 € | ||
| 0. Food and live animals | 0 | 0 | 0 | .. |
| 2. Crude materials,inedible,except fuels | 77 | 2.3 | 0 | .. |
| 5. Chemicals and related products,n.e.s. | 20 | 0.6 | 28 | -27.2 |
| 6. Basic manufactures | 7 | 0.2 | 4 | 54.1 |
| 7. Machinery,transport equipment | 3,238 | 96.5 | 74 | .. |
| 8. Miscellaneous manufactured articles | 14 | 0.4 | 12 | 15.9 |
| All groups combined | 3,356 | 100.0 | 118 | .. |

| Q2 / 2026 | Q2 / 2025 | Muutos edellisestä vastaavasta kaudesta % | ||
|---|---|---|---|---|
| 1,000 € | % | 1,000 € | ||
| 0. Food and live animals | 245 | 1.1 | 0 | .. |
| 2. Crude materials,inedible,except fuels | 21,204 | 98.7 | 0 | .. |
| 5. Chemicals and related products,n.e.s. | 20 | 0.1 | 25 | -18.2 |
| 6. Basic manufactures | 0 | 0 | 0 | .. |
| 7. Machinery,transport equipment | 2 | 0.0 | 9 | -75.1 |
| 8. Miscellaneous manufactured articles | 20 | 0.1 | 2 | 826.1 |
| 9. Goods not classified elsewhere | 1 | 0.0 | 0 | 339.0 |
| All groups combined | 21,492 | 100.0 | 36 | .. |
| Classification | Description | Year level | Quarter level | Month level | Year 2026 sofar |
|---|---|---|---|---|---|
| SITC | Standard International Trade Classification (classification system is maintained by the United Nations) | ███ | ███ | ███ | |
| BEC | The standard of statistical classification of BEC (Broad Economic Categories) is upheld by the UN and it is based on SITC-nomenclature. | ███ | ███ | ███ | |
| NACE | National industrial classification based on Statistical Classification of Economic Activities in the European Community Nomenclature générale des Activités économiques dans les Communautés européennes | ███ | ███ | ███ | |
| CPA | CPA = Classification of Products by Activities | ███ | ███ | ███ | |
| CN | The Combined Nomenclature is the common nomenclature of the European Community. | ███ | ███ | ███ |