
| Export of goods from Finland and import to Finland | Trade Balance |
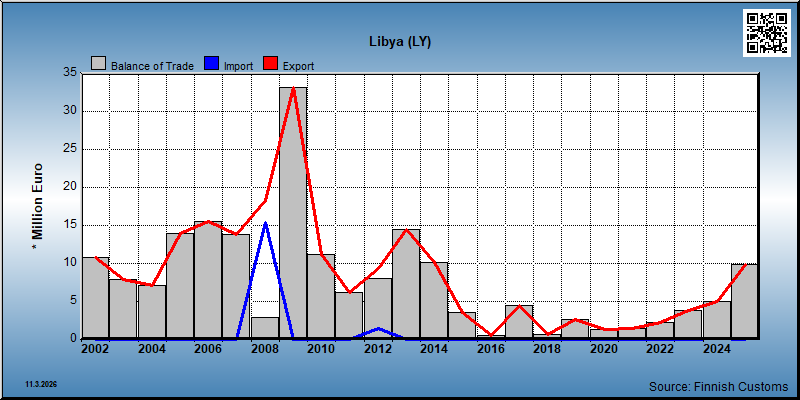
| Year | Import 1,000 € | Export 1,000 € | Trade 1,000 € | Trade balance 1,000 € |
|---|---|---|---|---|
| 2002 | 1 | 10,767 | 10,768 | 10,767 |
| 2003 | 4 | 7,876 | 7,880 | 7,872 |
| 2004 | 1 | 7,121 | 7,122 | 7,120 |
| 2005 | 12 | 13,931 | 13,944 | 13,919 |
| 2006 | 0 | 15,493 | 15,493 | 15,492 |
| 2007 | 1 | 13,808 | 13,808 | 13,807 |
| 2008 | 15,363 | 18,303 | 33,666 | 2,940 |
| 2009 | 2 | 33,097 | 33,099 | 33,095 |
| 2010 | 13 | 11,184 | 11,197 | 11,171 |
| 2011 | 0 | 6,241 | 6,241 | 6,241 |
| 2012 | 1,421 | 9,394 | 10,815 | 7,973 |
| 2013 | 1 | 14,521 | 14,522 | 14,520 |
| 2014 | 2 | 10,148 | 10,150 | 10,147 |
| 2015 | 1 | 3,590 | 3,591 | 3,590 |
| 2016 | 1 | 493 | 494 | 491 |
| 2017 | 1 | 4,457 | 4,458 | 4,456 |
| 2018 | 1 | 692 | 693 | 691 |
| 2019 | 0 | 2,600 | 2,600 | 2,600 |
| 2020 | 0 | 1,303 | 1,303 | 1,303 |
| 2021 | 0 | 1,464 | 1,464 | 1,464 |
| 2022 | 0 | 2,189 | 2,189 | 2,189 |
| 2023 | 2 | 3,782 | 3,784 | 3,780 |
| 2024 | 108 | 5,045 | 5,153 | 4,937 |
| 2025 | 0 | 9,886 | 9,886 | 9,886 |
*) SITC = Standard International Trade Classification (classification system is maintained by the United Nations)
| 2021 | 2022 | 2023 | 2024 | 2025 | ||||||
|---|---|---|---|---|---|---|---|---|---|---|
| 1,000 € | % | 1,000 € | % | 1,000 € | % | 1,000 € | % | 1,000 € | % | |
| 2. Crude materials,inedible,except fuels | 54 | 3.7 | 1,450 | 66.2 | 2,805 | 74.2 | 3,859 | 76.5 | 8,874 | 89.8 |
| 24. Cork and wood | 54 | 3.7 | 1,267 | 57.9 | 2,713 | 71.7 | 3,707 | 73.5 | 8,874 | 89.8 |
| 25. Pulp and waste paper | 183 | 8.3 | 92 | 2.4 | 152 | 3.0 | ||||
| 3. Mineral fuels etc | 5 | 0.3 | ||||||||
| 32. Coal,coke and briquettes | 5 | 0.3 | ||||||||
| 5. Chemicals and related products,n.e.s. | 13 | 0.9 | 140 | 6.4 | 52 | 1.4 | 86 | 1.7 | 35 | 0.4 |
| 55. Perfume,cleaning etc.preparations | 1 | 0.1 | 1 | 0.0 | ||||||
| 56. Fertilizers,manufactured | 10 | 0.7 | ||||||||
| 57. Plastics in primary forms | 137 | 6.3 | 43 | 1.1 | 83 | 1.7 | ||||
| 58. Plastics in non-primary forms | 26 | 0.3 | ||||||||
| 59. Chemical materials and products,n.e.s. | 1 | 0.1 | 2 | 0.1 | 9 | 0.2 | 3 | 0.1 | 9 | 0.1 |
| 6. Basic manufactures | 65 | 4.5 | 79 | 3.6 | 7 | 0.2 | 6 | 0.1 | 49 | 0.5 |
| 62. Rubber manufactures,n.e.s. | 4 | 0.3 | ||||||||
| 63. Wood and cork manufactures | 4 | 0.1 | ||||||||
| 64. Paper,paperboard and articles thereof | 56 | 3.8 | 71 | 3.2 | ||||||
| 66. Non-metallic mineral manufactures,n.e.s. | 1 | 0.1 | 5 | 0.2 | 3 | 0.1 | 49 | 0.5 | ||
| 67. Iron and steel | 1 | 0.0 | ||||||||
| 69. Manufactures of metals,n.e.s. | 4 | 0.3 | 2 | 0.1 | 4 | 0.1 | 1 | 0.0 | ||
| 7. Machinery,transport equipment | 859 | 58.7 | 185 | 8.4 | 520 | 13.8 | 901 | 17.9 | 653 | 6.6 |
| 71. Power generating machinery and equipment | 10 | 0.5 | 7 | 0.2 | 18 | 0.4 | 4 | 0.0 | ||
| 72. Machinery for specialized industries | 44 | 3.0 | 31 | 1.4 | 56 | 1.5 | 34 | 0.7 | 74 | 0.8 |
| 73. Metal working machinery | 3 | 0.1 | ||||||||
| 74. General industrial machinery n.e.s. | 460 | 31.4 | 10 | 0.4 | 23 | 0.6 | 139 | 2.8 | 373 | 3.8 |
| 75. Office machines and adp machines | 3 | 0.2 | 72 | 1.4 | ||||||
| 76. Telecommunications and sound recording equipment | 2 | 0.1 | 11 | 0.1 | ||||||
| 77. Electric machinery,n.e.s.and parts | 318 | 21.7 | 129 | 5.9 | 362 | 9.6 | 112 | 2.2 | 44 | 0.4 |
| 78. Road vehicles | 32 | 2.2 | 4 | 0.2 | 69 | 1.8 | 525 | 10.4 | 164 | 1.7 |
| 8. Miscellaneous manufactured articles | 467 | 31.9 | 335 | 15.3 | 397 | 10.5 | 193 | 3.8 | 275 | 2.8 |
| 81. Prefabr.buildings;sanitary,lighting etc.fixtrs | 34 | 0.7 | 131 | 1.3 | ||||||
| 82. Furniture and parts thereof | 16 | 0.7 | ||||||||
| 83. Travel goods,handbags and sim.containers | 1 | 0.0 | ||||||||
| 84. Articles of apparel and clothing accessories | 1 | 0.0 | 8 | 0.1 | ||||||
| 87. Instruments and apparates n.e.s. | 466 | 31.8 | 319 | 14.6 | 349 | 9.2 | 158 | 3.1 | 136 | 1.4 |
| 89. Miscellaneous manufactured articles,n.e.s. | 1 | 0.1 | 49 | 1.3 | 17 | 0.3 | ||||
| All groups combined | 1,464 | 100.0 | 2,189 | 100.0 | 3,782 | 100.0 | 5,045 | 100.0 | 9,886 | 100.0 |
| 2021 | 2022 | 2023 | 2024 | 2025 | ||||||
|---|---|---|---|---|---|---|---|---|---|---|
| 1,000 € | % | 1,000 € | % | 1,000 € | % | 1,000 € | % | 1,000 € | % | |
| 6. Basic manufactures | 107 | 98.6 | ||||||||
| 67. Iron and steel | 107 | 98.6 | ||||||||
| 8. Miscellaneous manufactured articles | 1 | 68.1 | 1 | 1.1 | ||||||
| 87. Instruments and apparates n.e.s. | 1 | 68.1 | 1 | 1.1 | ||||||
| All groups combined | 2 | 100.0 | 108 | 100.0 | ||||||
| Classification | Description | Year level | Quarter level | Month level | |
|---|---|---|---|---|---|
| SITC | Standard International Trade Classification (classification system is maintained by the United Nations) | ||||
| BEC | The standard of statistical classification of BEC (Broad Economic Categories) is upheld by the UN and it is based on SITC-nomenclature. | ||||
| NACE | National industrial classification based on Statistical Classification of Economic Activities in the European Community Nomenclature générale des Activités économiques dans les Communautés européennes | ||||
| CPA | CPA = Classification of Products by Activities | ||||
| CN | The Combined Nomenclature is the common nomenclature of the European Community. |