
| Export of goods from Finland and import to Finland | Trade Balance |

| Import 1,000 € | Export 1,000 € | Trade 1,000 € | Trade Balance 1,000 € | |
|---|---|---|---|---|
| 2019 Q1 | 6,793 | 475 | 7,268 | -6,319 |
| 2019 Q2 | 7,416 | 965 | 8,381 | -6,451 |
| 2019 Q3 | 4,158 | 176 | 4,334 | -3,983 |
| 2019 Q4 | 2,190 | 475 | 2,665 | -1,715 |
| 2020 Q1 | 5,936 | 528 | 6,465 | -5,408 |
| 2020 Q2 | 9,085 | 305 | 9,390 | -8,780 |
| 2020 Q3 | 5,932 | 1,142 | 7,074 | -4,791 |
| 2020 Q4 | 1,605 | 1,783 | 3,388 | 178 |
| 2021 Q1 | 4,881 | 617 | 5,498 | -4,264 |
| 2021 Q2 | 5,022 | 388 | 5,410 | -4,635 |
| 2021 Q3 | 12,117 | 904 | 13,020 | -11,213 |
| 2021 Q4 | 2,017 | 641 | 2,658 | -1,376 |
| 2022 Q1 | 5,207 | 439 | 5,646 | -4,769 |
| 2022 Q2 | 8,075 | 838 | 8,913 | -7,237 |
| 2022 Q3 | 15,524 | 669 | 16,193 | -14,854 |
| 2022 Q4 | 6,822 | 413 | 7,235 | -6,409 |
| 2023 Q1 | 9,182 | 255 | 9,437 | -8,927 |
| 2023 Q2 | 11,946 | 2,795 | 14,741 | -9,151 |
| 2023 Q3 | 6,146 | 499 | 6,644 | -5,647 |
| 2023 Q4 | 3,193 | 1,239 | 4,432 | -1,954 |
| 2024 Q1 | 4,241 | 657 | 4,898 | -3,583 |
| 2024 Q2 | 7,276 | 1,390 | 8,666 | -5,886 |
| 2024 Q3 | 5,874 | 6,021 | 11,895 | 148 |
| 2024 Q4 | 5,201 | 1,141 | 6,343 | -4,060 |
| 2025 Q1 | 7,600 | 1,099 | 8,699 | -6,502 |
| 2025 Q2 | 9,959 | 551 | 10,509 | -9,408 |
| 2025 Q3 | 4,928 | 753 | 5,681 | -4,176 |
| 2025 Q4 | 830 | 2,303 | 3,133 | 1,474 |
| 2026 Q1 | 11,017 | 1,848 | 12,865 | -9,168 |
| 2026 Q2 | 9,394 | 2,422 | 11,817 | -6,972 |
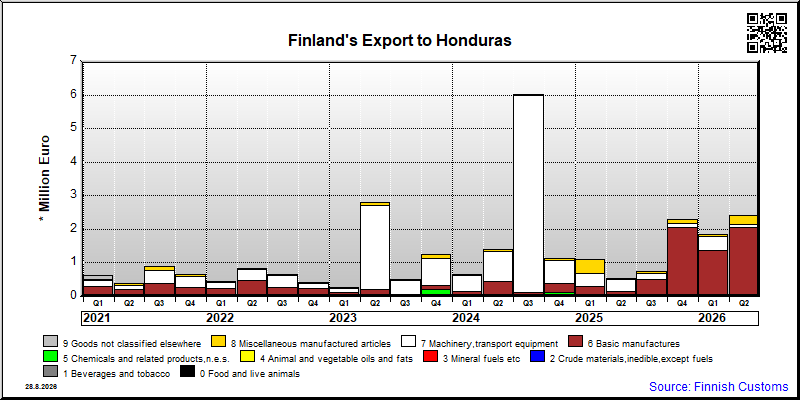
| Q2 / 2026 | Q2 / 2025 | Muutos edellisestä vastaavasta kaudesta % | ||
|---|---|---|---|---|
| 1,000 € | % | 1,000 € | ||
| 5. Chemicals and related products,n.e.s. | 0 | 0 | 50 | .. |
| 6. Basic manufactures | 2,065 | 85.2 | 112 | .. |
| 7. Machinery,transport equipment | 92 | 3.8 | 345 | -73.5 |
| 8. Miscellaneous manufactured articles | 266 | 11.0 | 44 | 508.0 |
| All groups combined | 2,422 | 100.0 | 551 | 339.9 |
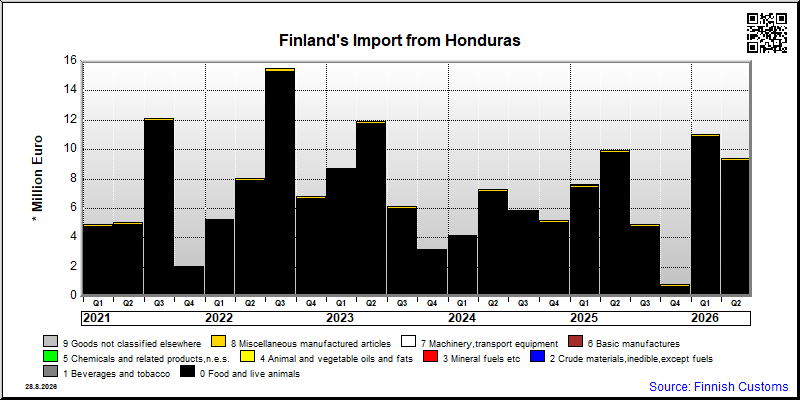
| Q2 / 2026 | Q2 / 2025 | Muutos edellisestä vastaavasta kaudesta % | ||
|---|---|---|---|---|
| 1,000 € | % | 1,000 € | ||
| 0. Food and live animals | 9,266 | 98.6 | 9,827 | -5.7 |
| 1. Beverages and tobacco | 5 | 0.1 | 0 | .. |
| 2. Crude materials,inedible,except fuels | 0 | 0.0 | 0 | 78.0 |
| 4. Animal and vegetable oils and fats | 8 | 0.1 | 0 | .. |
| 6. Basic manufactures | 0 | 0.0 | 1 | -96.4 |
| 7. Machinery,transport equipment | 2 | 0.0 | 3 | -10.1 |
| 8. Miscellaneous manufactured articles | 113 | 1.2 | 126 | -10.4 |
| 9. Goods not classified elsewhere | 0 | 0.0 | 0 | -81.0 |
| All groups combined | 9,394 | 100.0 | 9,957 | -5.7 |
| Classification | Description | Year level | Quarter level | Month level | Year 2026 sofar |
|---|---|---|---|---|---|
| SITC | Standard International Trade Classification (classification system is maintained by the United Nations) | ███ | ███ | ███ | ███ |
| BEC | The standard of statistical classification of BEC (Broad Economic Categories) is upheld by the UN and it is based on SITC-nomenclature. | ███ | ███ | ███ | ███ |
| NACE | National industrial classification based on Statistical Classification of Economic Activities in the European Community Nomenclature générale des Activités économiques dans les Communautés européennes | ███ | ███ | ███ | ███ |
| CPA | CPA = Classification of Products by Activities | ███ | ███ | ███ | ███ |
| CN | The Combined Nomenclature is the common nomenclature of the European Community. | ███ | ███ | ███ | ███ |