
| Export of goods from Finland and import to Finland | Trade Balance |

| Year | Month | Import 1,000 € | Export 1,000 € | Trade 1,000 € | Trade Balance 1,000 € |
|---|---|---|---|---|---|
| 2023 | 1 | 4,649,450 | 4,409,430 | 9,058,880 | -240,020 |
| 2023 | 2 | 4,224,848 | 3,778,395 | 8,003,243 | -446,454 |
| 2023 | 3 | 5,557,640 | 5,490,070 | 11,047,710 | -67,571 |
| 2023 | 4 | 4,537,867 | 4,472,554 | 9,010,421 | -65,313 |
| 2023 | 5 | 4,998,350 | 4,755,987 | 9,754,337 | -242,363 |
| 2023 | 6 | 4,777,917 | 4,539,058 | 9,316,975 | -238,858 |
| 2023 | 7 | 4,119,124 | 3,824,588 | 7,943,713 | -294,536 |
| 2023 | 8 | 4,384,125 | 4,473,147 | 8,857,272 | 89,021 |
| 2023 | 9 | 4,497,348 | 4,692,529 | 9,189,878 | 195,181 |
| 2023 | 10 | 4,582,993 | 4,719,097 | 9,302,089 | 136,104 |
| 2023 | 11 | 4,840,250 | 6,519,202 | 11,359,452 | 1,678,952 |
| 2023 | 12 | 4,307,722 | 4,094,799 | 8,402,521 | -212,924 |
| 2024 | 1 | 4,485,502 | 4,209,253 | 8,694,754 | -276,249 |
| 2024 | 2 | 4,620,525 | 3,871,782 | 8,492,307 | -748,743 |
| 2024 | 3 | 4,397,424 | 3,656,940 | 8,054,364 | -740,484 |
| 2024 | 4 | 4,790,725 | 4,450,472 | 9,241,197 | -340,254 |
| 2024 | 5 | 4,421,950 | 4,444,536 | 8,866,486 | 22,586 |
| 2024 | 6 | 4,276,789 | 5,064,370 | 9,341,159 | 787,581 |
| 2024 | 7 | 4,661,348 | 4,492,506 | 9,153,854 | -168,842 |
| 2024 | 8 | 4,376,286 | 4,121,992 | 8,498,278 | -254,294 |
| 2024 | 9 | 4,509,899 | 4,624,362 | 9,134,261 | 114,462 |
| 2024 | 10 | 4,932,256 | 4,738,228 | 9,670,484 | -194,028 |
| 2024 | 11 | 4,433,031 | 4,494,163 | 8,927,194 | 61,131 |
| 2024 | 12 | 4,565,643 | 4,463,521 | 9,029,164 | -102,122 |
| 2025 | 1 | 4,394,152 | 4,133,351 | 8,527,502 | -260,801 |
| 2025 | 2 | 4,458,412 | 4,167,258 | 8,625,671 | -291,154 |
| 2025 | 3 | 4,765,296 | 4,686,724 | 9,452,020 | -78,572 |
| 2025 | 4 | 4,677,938 | 4,423,859 | 9,101,797 | -254,079 |
| 2025 | 5 | 4,408,497 | 4,444,069 | 8,852,565 | 35,572 |
| 2025 | 6 | 4,408,151 | 4,549,079 | 8,957,230 | 140,928 |
| 2025 | 7 | 4,521,537 | 5,856,043 | 10,377,581 | 1,334,506 |
| 2025 | 8 | 4,285,831 | 3,849,761 | 8,135,591 | -436,070 |
| 2025 | 9 | 4,715,815 | 4,567,166 | 9,282,981 | -148,649 |
| 2025 | 10 | 4,821,776 | 5,043,950 | 9,865,727 | 222,174 |
| 2025 | 11 | 4,309,551 | 4,308,792 | 8,618,343 | -759 |
| 2025 | 12 | 4,409,111 | 4,199,942 | 8,609,052 | -209,169 |
| 2026 | 1 | 4,502,956 | 4,343,771 | 8,846,727 | -159,185 |
| 2026 | 2 | 4,694,571 | 4,155,096 | 8,849,667 | -539,476 |
| 2026 | 3 | 5,161,226 | 5,377,329 | 10,538,555 | 216,103 |
| 2026 | 4 | 5,258,915 | 5,175,430 | 10,434,345 | -83,485 |
| 2026 | 5 | 5,061,643 | 4,804,872 | 9,866,515 | -256,771 |
| 2026 | 6 | 4,757,442 | 7,117,879 | 11,875,320 | 2,360,437 |
| 2026 | 7 | 4,739,389 | 4,523,994 | 9,263,383 | -215,396 |

| 2026/3 | 2026/4 | 2026/5 | 2026/6 | 2026/7 | ||||||
|---|---|---|---|---|---|---|---|---|---|---|
| 1000 € | % | 1000 € | % | 1000 € | % | 1000 € | % | 1000 € | % | |
| 0. Food and live animals | 141,319 | 2.6 | 129,037 | 2.5 | 130,902 | 2.7 | 142,167 | 2.0 | 134,270 | 3.0 |
| 1. Beverages and tobacco | 19,444 | 0.4 | 22,584 | 0.4 | 21,246 | 0.4 | 20,551 | 0.3 | 22,201 | 0.5 |
| 2. Crude materials,inedible,except fuels | 411,012 | 7.6 | 407,374 | 7.9 | 378,474 | 7.9 | 380,368 | 5.3 | 370,465 | 8.2 |
| 3. Mineral fuels etc | 777,263 | 14.5 | 730,954 | 14.1 | 572,306 | 11.9 | 597,258 | 8.4 | 512,676 | 11.3 |
| 4. Animal and vegetable oils and fats | 11,544 | 0.2 | 7,086 | 0.1 | 6,809 | 0.1 | 7,555 | 0.1 | 2,391 | 0.1 |
| 5. Chemicals and related products,n.e.s. | 767,806 | 14.3 | 750,826 | 14.5 | 665,646 | 13.9 | 855,305 | 12.0 | 685,745 | 15.2 |
| 6. Basic manufactures | 1,476,102 | 27.5 | 1,402,293 | 27.1 | 1,414,216 | 29.4 | 1,447,645 | 20.3 | 1,325,587 | 29.3 |
| 7. Machinery,transport equipment | 1,315,883 | 24.5 | 1,314,615 | 25.4 | 1,244,145 | 25.9 | 3,326,746 | 46.7 | 1,179,087 | 26.1 |
| 8. Miscellaneous manufactured articles | 430,979 | 8.0 | 388,972 | 7.5 | 349,917 | 7.3 | 322,969 | 4.5 | 274,503 | 6.1 |
| 9. Goods not classified elsewhere | 25,977 | 0.5 | 21,690 | 0.4 | 21,212 | 0.4 | 17,315 | 0.2 | 17,067 | 0.4 |
| All groups combined | 5,377,329 | 100.0 | 5,175,430 | 100.0 | 4,804,872 | 100.0 | 7,117,879 | 100.0 | 4,523,994 | 100.0 |
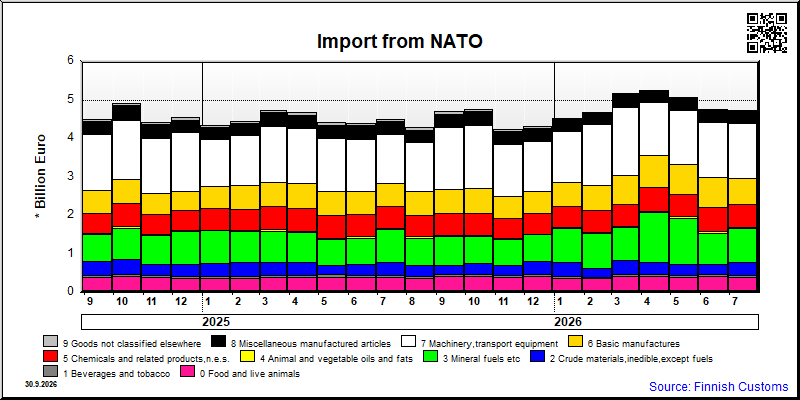
| 2026/3 | 2026/4 | 2026/5 | 2026/6 | 2026/7 | ||||||
|---|---|---|---|---|---|---|---|---|---|---|
| 1000 € | % | 1000 € | % | 1000 € | % | 1000 € | % | 1000 € | % | |
| 0. Food and live animals | 404,743 | 7.8 | 409,739 | 7.8 | 385,756 | 7.6 | 405,831 | 8.5 | 386,783 | 8.2 |
| 1. Beverages and tobacco | 54,101 | 1.0 | 53,631 | 1.0 | 52,216 | 1.0 | 66,375 | 1.4 | 58,220 | 1.2 |
| 2. Crude materials,inedible,except fuels | 372,288 | 7.2 | 313,823 | 6.0 | 291,057 | 5.8 | 253,012 | 5.3 | 334,215 | 7.1 |
| 3. Mineral fuels etc | 849,359 | 16.5 | 1,296,953 | 24.7 | 1,202,410 | 23.8 | 818,365 | 17.2 | 886,292 | 18.7 |
| 4. Animal and vegetable oils and fats | 24,698 | 0.5 | 26,972 | 0.5 | 29,867 | 0.6 | 31,160 | 0.7 | 21,710 | 0.5 |
| 5. Chemicals and related products,n.e.s. | 577,239 | 11.2 | 619,704 | 11.8 | 592,339 | 11.7 | 623,528 | 13.1 | 594,852 | 12.6 |
| 6. Basic manufactures | 758,191 | 14.7 | 831,630 | 15.8 | 772,722 | 15.3 | 785,065 | 16.5 | 672,953 | 14.2 |
| 7. Machinery,transport equipment | 1,764,228 | 34.2 | 1,375,445 | 26.2 | 1,400,805 | 27.7 | 1,428,726 | 30.0 | 1,447,448 | 30.5 |
| 8. Miscellaneous manufactured articles | 344,676 | 6.7 | 312,173 | 5.9 | 325,721 | 6.4 | 335,506 | 7.1 | 299,349 | 6.3 |
| 9. Goods not classified elsewhere | 11,702 | 0.2 | 18,846 | 0.4 | 8,751 | 0.2 | 9,872 | 0.2 | 37,568 | 0.8 |
| All groups combined | 5,161,226 | 100.0 | 5,258,915 | 100.0 | 5,061,643 | 100.0 | 4,757,442 | 100.0 | 4,739,389 | 100.0 |
| Classification | Description | Year level | Quarter level | Month level | Year 2026 sofar |
|---|---|---|---|---|---|
| SITC | Standard International Trade Classification (classification system is maintained by the United Nations) | ███ | ███ | ███ | ███ |
| BEC | The standard of statistical classification of BEC (Broad Economic Categories) is upheld by the UN and it is based on SITC-nomenclature. | ███ | ███ | ███ | ███ |
| NACE | National industrial classification based on Statistical Classification of Economic Activities in the European Community Nomenclature générale des Activités économiques dans les Communautés européennes | ███ | ███ | ███ | ███ |
| CPA | CPA = Classification of Products by Activities | ███ | ███ | ███ | ███ |
| CN | The Combined Nomenclature is the common nomenclature of the European Community. | ███ | ███ | ███ | ███ |