
| Export of goods from Finland and import to Finland | Trade Balance |

| Import 1,000 € | Export 1,000 € | Trade 1,000 € | Trade Balance 1,000 € | |
|---|---|---|---|---|
| 2019 Q1 | 41,806 | 10,591 | 52,397 | -31,216 |
| 2019 Q2 | 32,536 | 12,624 | 45,159 | -19,912 |
| 2019 Q3 | 54,510 | 4,873 | 59,384 | -49,637 |
| 2019 Q4 | 80,139 | 25,223 | 105,362 | -54,916 |
| 2020 Q1 | 31,684 | 8,820 | 40,504 | -22,864 |
| 2020 Q2 | 43,317 | 6,568 | 49,885 | -36,750 |
| 2020 Q3 | 68,950 | 4,180 | 73,131 | -64,770 |
| 2020 Q4 | 38,074 | 5,176 | 43,250 | -32,898 |
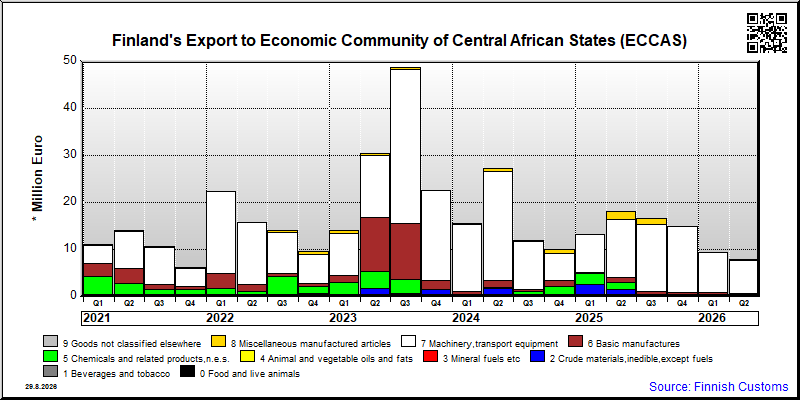
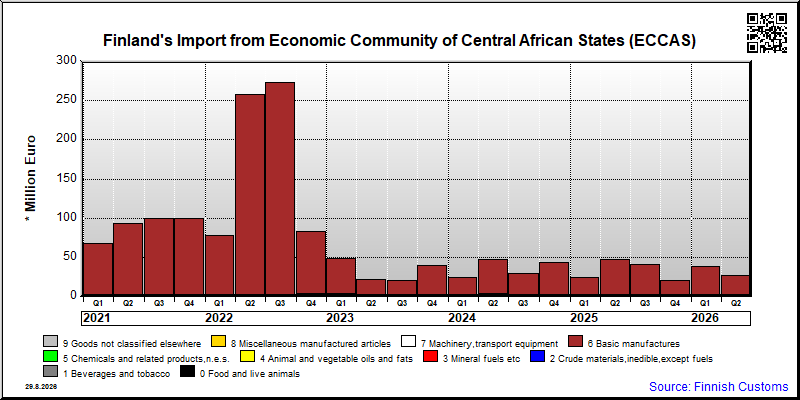
| 2021 Q1 | 89,513 | 10,995 | 100,508 | -78,517 |
| 2021 Q2 | 84,649 | 13,977 | 98,627 | -70,672 |
| 2021 Q3 | 93,007 | 10,900 | 103,907 | -82,107 |
| 2021 Q4 | 99,598 | 6,245 | 105,843 | -93,353 |
| 2022 Q1 | 82,278 | 22,558 | 104,836 | -59,720 |
| 2022 Q2 | 231,071 | 15,828 | 246,899 | -215,243 |
| 2022 Q3 | 266,424 | 14,079 | 280,503 | -252,344 |
| 2022 Q4 | 83,106 | 9,490 | 92,596 | -73,616 |
| 2023 Q1 | 43,576 | 14,131 | 57,707 | -29,446 |
| 2023 Q2 | 22,384 | 30,338 | 52,722 | 7,954 |
| 2023 Q3 | 20,456 | 48,783 | 69,239 | 28,326 |
| 2023 Q4 | 40,063 | 22,615 | 62,679 | -17,448 |
| 2024 Q1 | 26,031 | 15,468 | 41,499 | -10,563 |
| 2024 Q2 | 47,218 | 27,257 | 74,476 | -19,961 |
| 2024 Q3 | 29,736 | 11,896 | 41,632 | -17,840 |
| 2024 Q4 | 43,490 | 9,986 | 53,476 | -33,503 |
| 2025 Q1 | 24,925 | 13,231 | 38,156 | -11,695 |
| 2025 Q2 | 51,946 | 18,073 | 70,019 | -33,873 |
| 2025 Q3 | 41,164 | 16,526 | 57,690 | -24,638 |
| 2025 Q4 | 20,874 | 14,425 | 35,299 | -6,449 |
| 2026 Q1 | 38,188 | 9,409 | 47,597 | -28,779 |
| 2026 Q2 | 27,053 | 7,903 | 34,956 | -19,151 |
| Q2 / 2026 | Q2 / 2025 | Muutos edellisestä vastaavasta kaudesta % | ||
|---|---|---|---|---|
| 1,000 € | % | 1,000 € | ||
| 0. Food and live animals | 0 | 0.0 | 0 | -93.2 |
| 2. Crude materials,inedible,except fuels | 387 | 4.9 | 1,435 | -73.0 |
| 5. Chemicals and related products,n.e.s. | 0 | 0 | 1,536 | .. |
| 6. Basic manufactures | 339 | 4.3 | 1,019 | -66.7 |
| 7. Machinery,transport equipment | 6,869 | 86.9 | 12,320 | -44.2 |
| 8. Miscellaneous manufactured articles | 307 | 3.9 | 1,784 | -82.8 |
| All groups combined | 7,903 | 100.0 | 18,095 | -56.3 |
| Q2 / 2026 | Q2 / 2025 | Muutos edellisestä vastaavasta kaudesta % | ||
|---|---|---|---|---|
| 1,000 € | % | 1,000 € | ||
| 0. Food and live animals | 1,634 | 6.0 | 650 | 151.5 |
| 2. Crude materials,inedible,except fuels | 1,015 | 3.7 | 1,238 | -18.0 |
| 4. Animal and vegetable oils and fats | 1 | 0.0 | 0 | .. |
| 5. Chemicals and related products,n.e.s. | 239 | 0.9 | 3 | .. |
| 6. Basic manufactures | 24,163 | 89.3 | 45,093 | -46.4 |
| 7. Machinery,transport equipment | 49 | 0.2 | 2 | .. |
| 8. Miscellaneous manufactured articles | 4 | 0.0 | 49 | -91.5 |
| 9. Goods not classified elsewhere | 1 | 0.0 | 1 | 11.5 |
| All groups combined | 27,073 | 100.0 | 47,035 | -42.4 |
| Classification | Description | Year level | Quarter level | Month level | Year 2026 sofar |
|---|---|---|---|---|---|
| SITC | Standard International Trade Classification (classification system is maintained by the United Nations) | ███ | ███ | ███ | ███ |
| BEC | The standard of statistical classification of BEC (Broad Economic Categories) is upheld by the UN and it is based on SITC-nomenclature. | ███ | ███ | ███ | ███ |
| NACE | National industrial classification based on Statistical Classification of Economic Activities in the European Community Nomenclature générale des Activités économiques dans les Communautés européennes | ███ | ███ | ███ | ███ |
| CPA | CPA = Classification of Products by Activities | ███ | ███ | ███ | ███ |
| CN | The Combined Nomenclature is the common nomenclature of the European Community. | ███ | ███ | ███ | ███ |