
| Export of goods from Finland and import to Finland | Trade Balance |

| Import 1,000 € | Export 1,000 € | Trade 1,000 € | Trade Balance 1,000 € | |
|---|---|---|---|---|
| 2019 Q1 | 97,168 | 69,946 | 167,115 | -27,222 |
| 2019 Q2 | 28,012 | 56,745 | 84,757 | 28,733 |
| 2019 Q3 | 67,110 | 79,076 | 146,187 | 11,966 |
| 2019 Q4 | 91,513 | 106,059 | 197,572 | 14,546 |
| 2020 Q1 | 9,042 | 98,818 | 107,860 | 89,776 |
| 2020 Q2 | 98,169 | 120,298 | 218,467 | 22,130 |
| 2020 Q3 | 49,806 | 63,827 | 113,633 | 14,022 |
| 2020 Q4 | 10,029 | 51,340 | 61,370 | 41,311 |
| 2021 Q1 | 63,629 | 50,412 | 114,041 | -13,217 |
| 2021 Q2 | 103,395 | 51,725 | 155,120 | -51,669 |
| 2021 Q3 | 76,017 | 54,803 | 130,820 | -21,213 |
| 2021 Q4 | 61,209 | 59,566 | 120,775 | -1,642 |
| 2022 Q1 | 8,575 | 54,232 | 62,807 | 45,657 |
| 2022 Q2 | 35,142 | 78,711 | 113,852 | 43,569 |
| 2022 Q3 | 28,649 | 75,393 | 104,042 | 46,744 |
| 2022 Q4 | 10,775 | 73,320 | 84,095 | 62,544 |
| 2023 Q1 | 7,918 | 58,208 | 66,126 | 50,290 |
| 2023 Q2 | 32,435 | 75,691 | 108,125 | 43,256 |
| 2023 Q3 | 25,330 | 79,457 | 104,787 | 54,127 |
| 2023 Q4 | 8,435 | 61,508 | 69,943 | 53,072 |
| 2024 Q1 | 7,424 | 56,577 | 64,001 | 49,154 |
| 2024 Q2 | 11,626 | 68,824 | 80,450 | 57,199 |
| 2024 Q3 | 24,972 | 68,125 | 93,097 | 43,153 |
| 2024 Q4 | 88,007 | 82,371 | 170,377 | -5,636 |
| 2025 Q1 | 100,231 | 61,949 | 162,180 | -38,282 |
| 2025 Q2 | 91,446 | 80,969 | 172,415 | -10,477 |
| 2025 Q3 | 84,266 | 67,902 | 152,168 | -16,364 |
| 2025 Q4 | 79,327 | 66,634 | 145,962 | -12,693 |
| 2026 Q1 | 123,062 | 55,179 | 178,240 | -67,883 |
| 2026 Q2 | 120,011 | 70,383 | 190,393 | -49,628 |

| Q2 / 2026 | Q2 / 2025 | Muutos edellisestä vastaavasta kaudesta % | ||
|---|---|---|---|---|
| 1,000 € | % | 1,000 € | ||
| 0. Food and live animals | 0 | 0.0 | 0 | -98.8 |
| 1. Beverages and tobacco | 2 | 0.0 | 0 | .. |
| 2. Crude materials,inedible,except fuels | 34 | 0.0 | 77 | -56.2 |
| 3. Mineral fuels etc | 0 | 0.0 | 244 | -99.8 |
| 5. Chemicals and related products,n.e.s. | 9,060 | 12.9 | 7,263 | 24.7 |
| 6. Basic manufactures | 9,603 | 13.6 | 13,997 | -31.4 |
| 7. Machinery,transport equipment | 48,653 | 69.1 | 56,496 | -13.9 |
| 8. Miscellaneous manufactured articles | 3,030 | 4.3 | 2,887 | 5.0 |
| All groups combined | 70,383 | 100.0 | 80,964 | -13.1 |
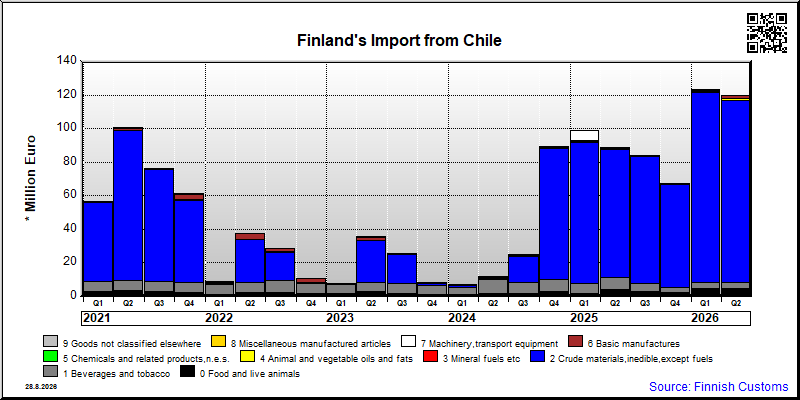
| Q2 / 2026 | Q2 / 2025 | Muutos edellisestä vastaavasta kaudesta % | ||
|---|---|---|---|---|
| 1,000 € | % | 1,000 € | ||
| 0. Food and live animals | 4,727 | 3.9 | 4,274 | 10.6 |
| 1. Beverages and tobacco | 3,459 | 2.9 | 7,139 | -51.6 |
| 2. Crude materials,inedible,except fuels | 108,771 | 90.6 | 76,422 | 42.3 |
| 3. Mineral fuels etc | 0 | 0.0 | 0 | .. |
| 4. Animal and vegetable oils and fats | 829 | 0.7 | 0 | .. |
| 5. Chemicals and related products,n.e.s. | 94 | 0.1 | 205 | -54.1 |
| 6. Basic manufactures | 2,096 | 1.7 | 448 | 367.9 |
| 7. Machinery,transport equipment | 29 | 0.0 | 201 | -85.8 |
| 8. Miscellaneous manufactured articles | 5 | 0.0 | 9 | -44.2 |
| 9. Goods not classified elsewhere | 2 | 0.0 | 1 | 40.6 |
| All groups combined | 120,011 | 100.0 | 88,699 | 35.3 |
| Classification | Description | Year level | Quarter level | Month level | Year 2026 sofar |
|---|---|---|---|---|---|
| SITC | Standard International Trade Classification (classification system is maintained by the United Nations) | ███ | ███ | ███ | ███ |
| BEC | The standard of statistical classification of BEC (Broad Economic Categories) is upheld by the UN and it is based on SITC-nomenclature. | ███ | ███ | ███ | ███ |
| NACE | National industrial classification based on Statistical Classification of Economic Activities in the European Community Nomenclature générale des Activités économiques dans les Communautés européennes | ███ | ███ | ███ | ███ |
| CPA | CPA = Classification of Products by Activities | ███ | ███ | ███ | ███ |
| CN | The Combined Nomenclature is the common nomenclature of the European Community. | ███ | ███ | ███ | ███ |