
| Export of goods from Finland and import to Finland | Trade Balance |
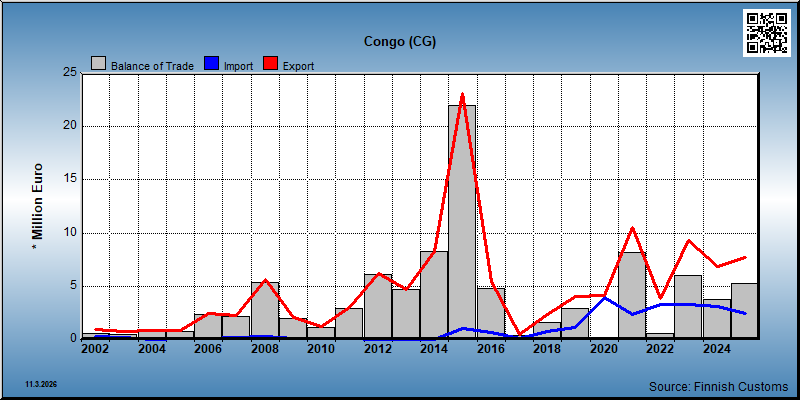
| Year | Import 1,000 € | Export 1,000 € | Trade 1,000 € | Trade balance 1,000 € |
|---|---|---|---|---|
| 2002 | 300 | 900 | 1,200 | 601 |
| 2003 | 196 | 708 | 904 | 512 |
| 2004 | 0 | 874 | 874 | 874 |
| 2005 | 81 | 878 | 959 | 797 |
| 2006 | 102 | 2,406 | 2,508 | 2,304 |
| 2007 | 153 | 2,302 | 2,455 | 2,149 |
| 2008 | 289 | 5,683 | 5,972 | 5,394 |
| 2009 | 88 | 2,104 | 2,192 | 2,016 |
| 2010 | 65 | 1,187 | 1,252 | 1,121 |
| 2011 | 106 | 2,981 | 3,087 | 2,875 |
| 2012 | 15 | 6,161 | 6,176 | 6,146 |
| 2013 | 35 | 4,692 | 4,726 | 4,657 |
| 2014 | 1 | 8,301 | 8,301 | 8,300 |
| 2015 | 1,051 | 23,088 | 24,138 | 22,037 |
| 2016 | 647 | 5,430 | 6,077 | 4,783 |
| 2017 | 54 | 471 | 525 | 417 |
| 2018 | 752 | 2,382 | 3,134 | 1,631 |
| 2019 | 1,132 | 4,051 | 5,183 | 2,920 |
| 2020 | 3,975 | 4,125 | 8,099 | 150 |
| 2021 | 2,328 | 10,505 | 12,833 | 8,177 |
| 2022 | 3,283 | 3,871 | 7,154 | 588 |
| 2023 | 3,308 | 9,313 | 12,621 | 6,005 |
| 2024 | 3,105 | 6,864 | 9,969 | 3,759 |
| 2025 | 2,476 | 7,743 | 10,218 | 5,267 |
*) SITC = Standard International Trade Classification (classification system is maintained by the United Nations)
| 2021 | 2022 | 2023 | 2024 | 2025 | ||||||
|---|---|---|---|---|---|---|---|---|---|---|
| 1,000 € | % | 1,000 € | % | 1,000 € | % | 1,000 € | % | 1,000 € | % | |
| 0. Food and live animals | 275 | 2.6 | 301 | 5.6 | 443 | 4.8 | 479 | 7.0 | 35 | 0.5 |
| 01. Meat and meat preparations | 275 | 2.6 | 301 | 5.6 | 443 | 4.8 | 479 | 7.0 | 35 | 0.5 |
| 2. Crude materials,inedible,except fuels | 12 | 0.1 | 12 | 0.2 | 5 | 0.1 | 12 | 0.2 | 2 | 0.0 |
| 26. Textile fibres and their wastes | 12 | 0.1 | 12 | 0.2 | 5 | 0.1 | 12 | 0.2 | 1 | 0.0 |
| 5. Chemicals and related products,n.e.s. | 1,879 | 17.9 | 301 | 5.6 | 727 | 7.8 | 103 | 1.5 | 571 | 7.4 |
| 54. Medicinal and pharmaceutical products | 1,879 | 17.9 | 301 | 5.6 | 689 | 7.4 | ||||
| 57. Plastics in primary forms | 103 | 1.5 | 570 | 7.4 | ||||||
| 58. Plastics in non-primary forms | 38 | 0.4 | ||||||||
| 6. Basic manufactures | 4,267 | 40.6 | 121 | 2.2 | 492 | 5.3 | 130 | 1.9 | 10 | 0.1 |
| 62. Rubber manufactures,n.e.s. | 4 | 0.0 | 53 | 1.0 | 322 | 3.5 | 19 | 0.3 | 2 | 0.0 |
| 64. Paper,paperboard and articles thereof | 103 | 1.0 | 2 | 0.0 | 87 | 0.9 | 65 | 1.0 | ||
| 65. Textile yarn,fabrics,made up articles,etc. | 1 | 0.0 | 60 | 1.1 | 3 | 0.0 | ||||
| 66. Non-metallic mineral manufactures,n.e.s. | 7 | 0.1 | 6 | 0.1 | 3 | 0.0 | 3 | 0.0 | ||
| 69. Manufactures of metals,n.e.s. | 4,154 | 39.5 | 1 | 0.0 | 77 | 0.8 | 43 | 0.6 | 7 | 0.1 |
| 7. Machinery,transport equipment | 4,035 | 38.4 | 4,067 | 75.7 | 7,061 | 75.8 | 5,988 | 87.2 | 7,036 | 90.9 |
| 71. Power generating machinery and equipment | 159 | 1.5 | 34 | 0.6 | 452 | 4.9 | 57 | 0.8 | 3 | 0.0 |
| 72. Machinery for specialized industries | 1,501 | 14.3 | 1,578 | 29.4 | 1,007 | 10.8 | 1,897 | 27.6 | 4,876 | 63.0 |
| 73. Metal working machinery | 6 | 0.1 | 35 | 0.4 | 2,092 | 30.5 | 9 | 0.1 | ||
| 74. General industrial machinery n.e.s. | 2,264 | 21.5 | 1,987 | 37.0 | 4,726 | 50.7 | 149 | 2.2 | 1,430 | 18.5 |
| 75. Office machines and adp machines | 16 | 0.2 | 8 | 0.2 | 24 | 0.3 | 58 | 0.8 | 36 | 0.5 |
| 76. Telecommunications and sound recording equipment | 8 | 0.1 | 28 | 0.5 | 52 | 0.6 | 66 | 1.0 | 1 | 0.0 |
| 77. Electric machinery,n.e.s.and parts | 9 | 0.1 | 121 | 2.2 | 686 | 7.4 | 197 | 2.9 | 140 | 1.8 |
| 78. Road vehicles | 78 | 0.7 | 304 | 5.7 | 79 | 0.8 | 1,474 | 21.5 | 541 | 7.0 |
| 8. Miscellaneous manufactured articles | 37 | 0.4 | 569 | 10.6 | 585 | 6.3 | 151 | 2.2 | 89 | 1.1 |
| 81. Prefabr.buildings;sanitary,lighting etc.fixtrs | 1 | 0.0 | 1 | 0.0 | 42 | 0.6 | 33 | 0.4 | ||
| 82. Furniture and parts thereof | 5 | 0.0 | 26 | 0.5 | 8 | 0.1 | ||||
| 87. Instruments and apparates n.e.s. | 31 | 0.3 | 536 | 10.0 | 553 | 5.9 | 89 | 1.3 | 53 | 0.7 |
| 88. Photographic equipment,optical goods etc. | 10 | 0.2 | ||||||||
| 89. Miscellaneous manufactured articles,n.e.s. | 7 | 0.1 | 32 | 0.3 | 1 | 0.0 | 3 | 0.0 | ||
| All groups combined | 10,505 | 100.0 | 5,371 | 100.0 | 9,313 | 100.0 | 6,864 | 100.0 | 7,743 | 100.0 |
| 2021 | 2022 | 2023 | 2024 | 2025 | ||||||
|---|---|---|---|---|---|---|---|---|---|---|
| 1,000 € | % | 1,000 € | % | 1,000 € | % | 1,000 € | % | 1,000 € | % | |
| 0. Food and live animals | 882 | 37.2 | 246 | 7.5 | 5 | 0.1 | 5 | 0.2 | 7 | 0.3 |
| 05. Vegetables and fruit | 4 | 0.1 | 7 | 0.3 | ||||||
| 07. Coffee,tea,cocoa,spices | 882 | 37.2 | 246 | 7.5 | 5 | 0.1 | 1 | 0.0 | ||
| 09. Miscellaneous edible products and preparations | 1 | 0.0 | ||||||||
| 2. Crude materials,inedible,except fuels | 1,479 | 62.3 | 3,011 | 91.7 | 3,298 | 99.7 | 3,098 | 99.8 | 2,466 | 99.6 |
| 24. Cork and wood | 1,479 | 62.3 | 3,011 | 91.7 | 3,298 | 99.7 | 3,098 | 99.8 | 2,466 | 99.6 |
| 5. Chemicals and related products,n.e.s. | 1 | 0.0 | 1 | 0.1 | ||||||
| 54. Medicinal and pharmaceutical products | 1 | 0.0 | ||||||||
| 59. Chemical materials and products,n.e.s. | 1 | 0.1 | ||||||||
| 6. Basic manufactures | 5 | 0.2 | 1 | 0.0 | ||||||
| 62. Rubber manufactures,n.e.s. | 5 | 0.2 | ||||||||
| 65. Textile yarn,fabrics,made up articles,etc. | 1 | 0.0 | ||||||||
| 7. Machinery,transport equipment | 3 | 0.1 | 25 | 0.8 | 5 | 0.1 | 2 | 0.1 | 1 | 0.1 |
| 71. Power generating machinery and equipment | 1 | 0.0 | ||||||||
| 72. Machinery for specialized industries | 1 | 0.0 | ||||||||
| 73. Metal working machinery | 4 | 0.1 | ||||||||
| 74. General industrial machinery n.e.s. | 3 | 0.1 | ||||||||
| 76. Telecommunications and sound recording equipment | 1 | 0.0 | ||||||||
| 77. Electric machinery,n.e.s.and parts | 24 | 0.7 | 1 | 0.0 | 1 | 0.0 | ||||
| 8. Miscellaneous manufactured articles | 4 | 0.2 | ||||||||
| 87. Instruments and apparates n.e.s. | 4 | 0.2 | ||||||||
| All groups combined | 2,373 | 100.0 | 3,283 | 100.0 | 3,308 | 100.0 | 3,105 | 100.0 | 2,476 | 100.0 |
| Classification | Description | Year level | Quarter level | Month level | |
|---|---|---|---|---|---|
| SITC | Standard International Trade Classification (classification system is maintained by the United Nations) | ||||
| BEC | The standard of statistical classification of BEC (Broad Economic Categories) is upheld by the UN and it is based on SITC-nomenclature. | ||||
| NACE | National industrial classification based on Statistical Classification of Economic Activities in the European Community Nomenclature générale des Activités économiques dans les Communautés européennes | ||||
| CPA | CPA = Classification of Products by Activities | ||||
| CN | The Combined Nomenclature is the common nomenclature of the European Community. |