
| Export of goods from Finland and import to Finland | Trade Balance |

| Import 1,000 € | Export 1,000 € | Trade 1,000 € | Trade Balance 1,000 € | |
|---|---|---|---|---|
| 2019 Q1 | 23,556 | 155,215 | 178,771 | 131,659 |
| 2019 Q2 | 20,543 | 175,483 | 196,027 | 154,940 |
| 2019 Q3 | 21,414 | 163,006 | 184,420 | 141,592 |
| 2019 Q4 | 18,650 | 179,307 | 197,957 | 160,657 |
| 2020 Q1 | 24,178 | 166,445 | 190,623 | 142,266 |
| 2020 Q2 | 19,287 | 146,803 | 166,091 | 127,516 |
| 2020 Q3 | 69,084 | 155,885 | 224,970 | 86,801 |
| 2020 Q4 | 20,506 | 156,738 | 177,244 | 136,232 |
| 2021 Q1 | 22,262 | 165,871 | 188,133 | 143,609 |
| 2021 Q2 | 29,422 | 167,896 | 197,317 | 138,474 |
| 2021 Q3 | 129,858 | 180,852 | 310,710 | 50,995 |
| 2021 Q4 | 78,371 | 169,554 | 247,925 | 91,183 |
| 2022 Q1 | 36,653 | 196,174 | 232,828 | 159,521 |
| 2022 Q2 | 62,670 | 224,862 | 287,532 | 162,192 |
| 2022 Q3 | 238,644 | 214,144 | 452,788 | -24,500 |
| 2022 Q4 | 202,008 | 194,821 | 396,829 | -7,188 |
| 2023 Q1 | 116,719 | 215,034 | 331,753 | 98,315 |
| 2023 Q2 | 75,989 | 189,107 | 265,096 | 113,117 |
| 2023 Q3 | 50,093 | 207,127 | 257,219 | 157,034 |
| 2023 Q4 | 130,353 | 187,854 | 318,207 | 57,501 |
| 2024 Q1 | 107,062 | 152,229 | 259,291 | 45,167 |
| 2024 Q2 | 95,645 | 207,526 | 303,170 | 111,881 |
| 2024 Q3 | 41,294 | 469,687 | 510,981 | 428,393 |
| 2024 Q4 | 84,686 | 170,360 | 255,046 | 85,675 |
| 2025 Q1 | 120,166 | 164,321 | 284,487 | 44,155 |
| 2025 Q2 | 46,774 | 455,888 | 502,662 | 409,115 |
| 2025 Q3 | 54,150 | 175,440 | 229,591 | 121,290 |
| 2025 Q4 | 24,436 | 264,967 | 289,403 | 240,532 |
| 2026 Q1 | 30,935 | 221,486 | 252,421 | 190,551 |
| 2026 Q2 | 199,935 | 271,851 | 471,786 | 71,916 |
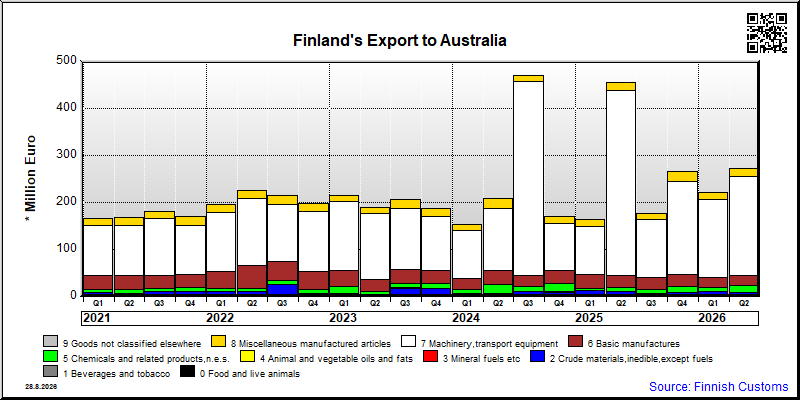
| Q2 / 2026 | Q2 / 2025 | Muutos edellisestä vastaavasta kaudesta % | ||
|---|---|---|---|---|
| 1,000 € | % | 1,000 € | ||
| 0. Food and live animals | 161 | 0.1 | 282 | -43.0 |
| 00. Live animals | 1 | 0.0 | 1 | -16.7 |
| 01. Meat and meat preparations | 0 | 0.0 | 0 | -34.3 |
| 02. Dairy products and birds' eggs | 0 | 0.0 | 0 | .. |
| 03. Fish and fish preparations | 0 | 0.0 | 0 | 143.3 |
| 04. Cereals and cereal preparations | 105 | 0.0 | 138 | -24.1 |
| 05. Vegetables and fruit | 1 | 0.0 | 1 | 37.5 |
| 06. Sugars,sugar preparations and honey | 10 | 0.0 | 11 | -10.8 |
| 07. Coffee,tea,cocoa,spices | 9 | 0.0 | 108 | -91.4 |
| 09. Miscellaneous edible products and preparations | 36 | 0.0 | 24 | 47.5 |
| 1. Beverages and tobacco | 1 | 0.0 | 0 | .. |
| 11. Beverages | 1 | 0.0 | 0 | .. |
| 2. Crude materials,inedible,except fuels | 8,376 | 3.1 | 9,637 | -13.1 |
| 23. Crude rubber (incl.synthetic) | 0 | 0.0 | 0 | -35.6 |
| 24. Cork and wood | 3,450 | 1.3 | 3,408 | 1.2 |
| 25. Pulp and waste paper | 3,642 | 1.3 | 5,396 | -32.5 |
| 26. Textile fibres and their wastes | 0 | 0.0 | 1 | -62.0 |
| 27. Crude fertilizers and crude minerals | 35 | 0.0 | 20 | 75.7 |
| 28. Metalliferous ores and metal scrap | 1,246 | 0.5 | 805 | 54.7 |
| 29. Crude animal,vegetable materials n.e.s. | 2 | 0.0 | 6 | -70.0 |
| 3. Mineral fuels etc | 451 | 0.2 | 92 | 391.1 |
| 32. Coal,coke and briquettes | 277 | 0.1 | 6 | .. |
| 33. Petroleum and products | 175 | 0.1 | 86 | 104.0 |
| 4. Animal and vegetable oils and fats | 56 | 0.0 | 3 | .. |
| 42. Fixed vegetable fats and oils | 56 | 0.0 | 3 | .. |
| 43. Processed animal or vegetable oils,etc. | 0 | 0.0 | 0 | -97.4 |
| 5. Chemicals and related products,n.e.s. | 13,731 | 5.1 | 9,369 | 46.6 |
| 51. Organic chemicals | 891 | 0.3 | 751 | 18.7 |
| 52. Inorganic chemicals | 1,552 | 0.6 | 1,373 | 13.1 |
| 53. Dyeing,tanning and colouring material | 74 | 0.0 | 255 | -71.0 |
| 54. Medicinal and pharmaceutical products | 8,714 | 3.2 | 2,318 | 276.0 |
| 55. Perfume,cleaning etc.preparations | 20 | 0.0 | 124 | -83.6 |
| 56. Fertilizers,manufactured | 252 | 0.1 | 3,051 | -91.7 |
| 57. Plastics in primary forms | 173 | 0.1 | 149 | 16.2 |
| 58. Plastics in non-primary forms | 876 | 0.3 | 568 | 54.3 |
| 59. Chemical materials and products,n.e.s. | 1,178 | 0.4 | 781 | 50.9 |
| 6. Basic manufactures | 22,513 | 8.3 | 24,259 | -7.2 |
| 61. Leather,dressed fur,etc. | 42 | 0.0 | 43 | -2.0 |
| 62. Rubber manufactures,n.e.s. | 577 | 0.2 | 974 | -40.8 |
| 63. Wood and cork manufactures | 4,816 | 1.8 | 5,899 | -18.4 |
| 64. Paper,paperboard and articles thereof | 9,514 | 3.5 | 9,206 | 3.4 |
| 65. Textile yarn,fabrics,made up articles,etc. | 516 | 0.2 | 341 | 51.1 |
| 66. Non-metallic mineral manufactures,n.e.s. | 857 | 0.3 | 753 | 13.7 |
| 67. Iron and steel | 1,954 | 0.7 | 1,573 | 24.2 |
| 68. Non-ferrous metals | 13 | 0.0 | 483 | -97.3 |
| 69. Manufactures of metals,n.e.s. | 4,223 | 1.6 | 4,986 | -15.3 |
| 7. Machinery,transport equipment | 209,088 | 76.9 | 395,106 | -47.1 |
| 71. Power generating machinery and equipment | 5,909 | 2.2 | 3,468 | 70.4 |
| 72. Machinery for specialized industries | 100,275 | 36.9 | 49,900 | 101.0 |
| 73. Metal working machinery | 2,501 | 0.9 | 1,603 | 56.1 |
| 74. General industrial machinery n.e.s. | 26,283 | 9.7 | 10,643 | 146.9 |
| 75. Office machines and adp machines | 420 | 0.2 | 692 | -39.3 |
| 76. Telecommunications and sound recording equipment | 1,719 | 0.6 | 898 | 91.4 |
| 77. Electric machinery,n.e.s.and parts | 19,755 | 7.3 | 18,433 | 7.2 |
| 78. Road vehicles | 52,148 | 19.2 | 24,445 | 113.3 |
| 79. Other transport equipment | 78 | 0.0 | 285,024 | -100.0 |
| 8. Miscellaneous manufactured articles | 17,475 | 6.4 | 17,140 | 2.0 |
| 81. Prefabr.buildings;sanitary,lighting etc.fixtrs | 438 | 0.2 | 549 | -20.2 |
| 82. Furniture and parts thereof | 564 | 0.2 | 397 | 42.2 |
| 83. Travel goods,handbags and sim.containers | 140 | 0.1 | 118 | 18.3 |
| 84. Articles of apparel and clothing accessories | 638 | 0.2 | 522 | 22.2 |
| 85. Footwear | 92 | 0.0 | 48 | 89.9 |
| 87. Instruments and apparates n.e.s. | 11,412 | 4.2 | 11,304 | 0.9 |
| 88. Photographic equipment,optical goods etc. | 116 | 0.0 | 90 | 28.5 |
| 89. Miscellaneous manufactured articles,n.e.s. | 4,075 | 1.5 | 4,111 | -0.9 |
| All groups combined | 271,851 | 100.0 | 455,888 | -40.4 |
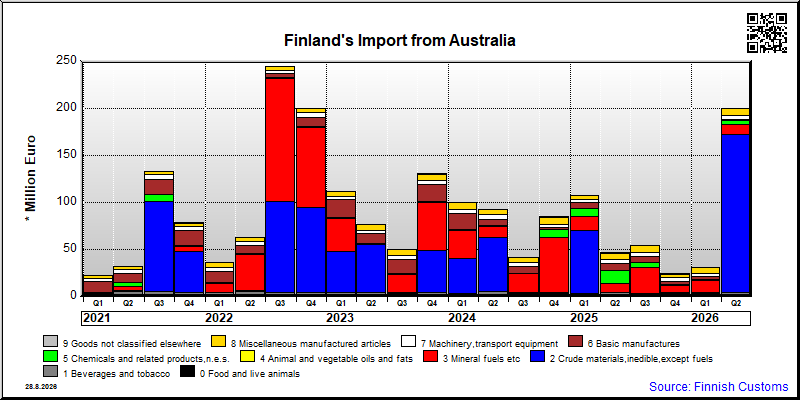
| Q2 / 2026 | Q2 / 2025 | Muutos edellisestä vastaavasta kaudesta % | ||
|---|---|---|---|---|
| 1,000 € | % | 1,000 € | ||
| 0. Food and live animals | 937 | 0.5 | 971 | -3.5 |
| 01. Meat and meat preparations | 806 | 0.4 | 876 | -8.0 |
| 03. Fish and fish preparations | 8 | 0.0 | 0 | .. |
| 04. Cereals and cereal preparations | 22 | 0.0 | 20 | 11.1 |
| 05. Vegetables and fruit | 24 | 0.0 | 28 | -15.8 |
| 06. Sugars,sugar preparations and honey | 1 | 0.0 | 0 | 182.8 |
| 07. Coffee,tea,cocoa,spices | 1 | 0.0 | 0 | 378.6 |
| 08. Feeding stuff for animals | 0 | 0.0 | 0 | -45.9 |
| 09. Miscellaneous edible products and preparations | 76 | 0.0 | 45 | 66.3 |
| 1. Beverages and tobacco | 3,071 | 1.5 | 3,359 | -8.5 |
| 11. Beverages | 3,071 | 1.5 | 3,359 | -8.5 |
| 2. Crude materials,inedible,except fuels | 167,849 | 84.0 | 422 | .. |
| 25. Pulp and waste paper | 0 | 0 | 0 | .. |
| 26. Textile fibres and their wastes | 0 | 0.0 | 39 | -99.2 |
| 27. Crude fertilizers and crude minerals | 251 | 0.1 | 141 | 78.5 |
| 28. Metalliferous ores and metal scrap | 167,372 | 83.7 | 1 | .. |
| 29. Crude animal,vegetable materials n.e.s. | 226 | 0.1 | 241 | -6.2 |
| 3. Mineral fuels etc | 11,496 | 5.8 | 9,332 | 23.2 |
| 32. Coal,coke and briquettes | 11,490 | 5.7 | 9,332 | 23.1 |
| 33. Petroleum and products | 6 | 0.0 | 0 | .. |
| 4. Animal and vegetable oils and fats | 14 | 0.0 | 0 | .. |
| 42. Fixed vegetable fats and oils | 0 | 0.0 | 0 | .. |
| 43. Processed animal or vegetable oils,etc. | 14 | 0.0 | 0 | .. |
| 5. Chemicals and related products,n.e.s. | 3,454 | 1.7 | 13,731 | -74.8 |
| 51. Organic chemicals | 1 | 0.0 | 14 | -93.4 |
| 52. Inorganic chemicals | 23 | 0.0 | 12,442 | -99.8 |
| 53. Dyeing,tanning and colouring material | 509 | 0.3 | 85 | 500.6 |
| 54. Medicinal and pharmaceutical products | 2,316 | 1.2 | 854 | 171.4 |
| 55. Perfume,cleaning etc.preparations | 432 | 0.2 | 280 | 54.6 |
| 57. Plastics in primary forms | 78 | 0.0 | 3 | .. |
| 58. Plastics in non-primary forms | 11 | 0.0 | 11 | 5.4 |
| 59. Chemical materials and products,n.e.s. | 84 | 0.0 | 43 | 92.6 |
| 6. Basic manufactures | 1,964 | 1.0 | 6,936 | -71.7 |
| 61. Leather,dressed fur,etc. | 63 | 0.0 | 6 | 935.2 |
| 62. Rubber manufactures,n.e.s. | 18 | 0.0 | 83 | -78.6 |
| 63. Wood and cork manufactures | 6 | 0.0 | 0 | .. |
| 64. Paper,paperboard and articles thereof | 0 | 0.0 | 1 | -43.4 |
| 65. Textile yarn,fabrics,made up articles,etc. | 27 | 0.0 | 59 | -54.3 |
| 66. Non-metallic mineral manufactures,n.e.s. | 175 | 0.1 | 194 | -9.9 |
| 67. Iron and steel | 0 | 0.0 | 4 | -89.2 |
| 68. Non-ferrous metals | 1,487 | 0.7 | 6,407 | -76.8 |
| 69. Manufactures of metals,n.e.s. | 187 | 0.1 | 182 | 2.7 |
| 7. Machinery,transport equipment | 3,791 | 1.9 | 4,473 | -15.2 |
| 71. Power generating machinery and equipment | 110 | 0.1 | 46 | 141.3 |
| 72. Machinery for specialized industries | 265 | 0.1 | 570 | -53.6 |
| 73. Metal working machinery | 16 | 0.0 | 4 | 289.6 |
| 74. General industrial machinery n.e.s. | 1,685 | 0.8 | 963 | 74.9 |
| 75. Office machines and adp machines | 14 | 0.0 | 228 | -93.8 |
| 76. Telecommunications and sound recording equipment | 556 | 0.3 | 782 | -28.9 |
| 77. Electric machinery,n.e.s.and parts | 589 | 0.3 | 1,609 | -63.4 |
| 78. Road vehicles | 555 | 0.3 | 267 | 108.2 |
| 79. Other transport equipment | 1 | 0.0 | 4 | -78.1 |
| 8. Miscellaneous manufactured articles | 6,981 | 3.5 | 7,000 | -0.3 |
| 81. Prefabr.buildings;sanitary,lighting etc.fixtrs | 0 | 0.0 | 19 | -99.0 |
| 82. Furniture and parts thereof | 4 | 0.0 | 106 | -96.4 |
| 83. Travel goods,handbags and sim.containers | 6 | 0.0 | 7 | -6.6 |
| 84. Articles of apparel and clothing accessories | 97 | 0.0 | 147 | -34.1 |
| 85. Footwear | 9 | 0.0 | 4 | 131.9 |
| 87. Instruments and apparates n.e.s. | 3,890 | 1.9 | 3,155 | 23.3 |
| 88. Photographic equipment,optical goods etc. | 9 | 0.0 | 123 | -92.6 |
| 89. Miscellaneous manufactured articles,n.e.s. | 2,966 | 1.5 | 3,439 | -13.8 |
| 9. Goods not classified elsewhere | 377 | 0.2 | 353 | 6.9 |
| 93. Special transactions and commodities not classified | 374 | 0.2 | 353 | 5.9 |
| 97. Gold,non-monetary | 4 | 0.0 | 0 | .. |
| All groups combined | 199,935 | 100.0 | 46,575 | 329.3 |
| Classification | Description | Year level | Quarter level | Month level | Year 2026 sofar |
|---|---|---|---|---|---|
| SITC | Standard International Trade Classification (classification system is maintained by the United Nations) | ███ | ███ | ███ | ███ |
| BEC | The standard of statistical classification of BEC (Broad Economic Categories) is upheld by the UN and it is based on SITC-nomenclature. | ███ | ███ | ███ | ███ |
| NACE | National industrial classification based on Statistical Classification of Economic Activities in the European Community Nomenclature générale des Activités économiques dans les Communautés européennes | ███ | ███ | ███ | ███ |
| CPA | CPA = Classification of Products by Activities | ███ | ███ | ███ | ███ |
| CN | The Combined Nomenclature is the common nomenclature of the European Community. | ███ | ███ | ███ | ███ |