
| United States' value of trade in goods with different European countries |
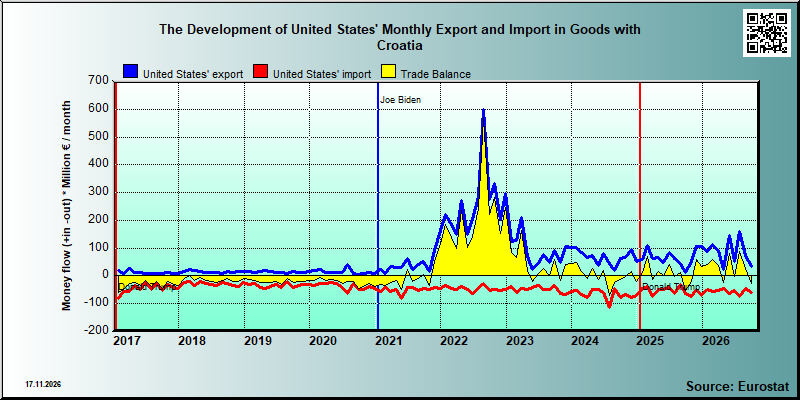
Eurostat's data has been used to provide a more detailed view of US exports by country, as the US stopped publishing detailed SITC data as of February 2025. Eurostat data is in euros and is compiled from European countries' customs statistics. There are certainly some differences in customs regulations between the US and European countries, as shown in the accompanying figures based on US Census Bureau and Eurostat data.
Data: US Census Bureau

Data:Eurostat
| 2026/5 | 2026/6 | 2026/7 | 2026/8 | 2026/9 | ||||||
|---|---|---|---|---|---|---|---|---|---|---|
| 1.000 € | % | 1.000 € | % | 1.000 € | % | 1.000 € | % | 1.000 € | % | |
| 0. Food and live animals | 1,364 | 0.9 | 1,352 | 2.5 | 1,632 | 1.0 | 1,049 | 1.5 | 1,454 | 4.5 |
| 04. Cereals and cereal preparations | 23 | 0.0 | ||||||||
| 05. Vegetables and fruit | 831 | 0.6 | 893 | 1.7 | 1,383 | 0.9 | 743 | 1.0 | 1,256 | 3.9 |
| 06. Sugars,sugar preparations and honey | 1 | 0.0 | ||||||||
| 08. Feeding stuff for animals | 1 | 0.0 | ||||||||
| 09. Miscellaneous edible products and preparations | 510 | 0.4 | 458 | 0.9 | 248 | 0.2 | 306 | 0.4 | 198 | 0.6 |
| 1. Beverages and tobacco | 561 | 0.4 | 1,248 | 2.3 | 834 | 0.5 | 878 | 1.2 | 863 | 2.7 |
| 11. Beverages | 561 | 0.4 | 1,248 | 2.3 | 834 | 0.5 | 878 | 1.2 | 863 | 2.7 |
| 12. Tobacco and tobacco manufactures | ||||||||||
| 2. Crude materials,inedible,except fuels | 2 | 0.0 | 54 | 0.1 | 36 | 0.0 | 19 | 0.0 | 48 | 0.1 |
| 21. Hides,skins,furskins,raw | 1 | 0.0 | ||||||||
| 24. Cork and wood | 17 | 0.0 | 18 | 0.0 | ||||||
| 25. Pulp and waste paper | 9 | 0.0 | ||||||||
| 26. Textile fibres and their wastes | 9 | 0.0 | 2 | 0.0 | ||||||
| 27. Crude fertilizers and crude minerals | 2 | 0.0 | 38 | 0.1 | 2 | 0.0 | ||||
| 29. Crude animal,vegetable materials n.e.s. | 6 | 0.0 | 8 | 0.0 | 46 | 0.1 | ||||
| 3. Mineral fuels etc | 130,292 | 90.5 | 33,284 | 62.4 | 140,758 | 87.3 | 58,591 | 81.6 | 13,331 | 41.1 |
| 33. Petroleum and products | 15 | 0.0 | 58,155 | 36.1 | 8 | 0.0 | 12,793 | 39.5 | ||
| 34. Gas,natural and manufactured | 130,277 | 90.5 | 33,284 | 62.4 | 82,603 | 51.2 | 58,583 | 81.5 | 539 | 1.7 |
| 4. Animal and vegetable oils and fats | 6 | 0.0 | 7 | 0.0 | 2 | 0.0 | ||||
| 42. Fixed vegetable fats and oils | 1 | 0.0 | 6 | 0.0 | 2 | 0.0 | ||||
| 43. Processed animal or vegetable oils,etc. | 6 | 0.0 | 1 | 0.0 | ||||||
| 5. Chemicals and related products,n.e.s. | 3,585 | 2.5 | 5,089 | 9.5 | 3,838 | 2.4 | 4,833 | 6.7 | 2,830 | 8.7 |
| 51. Organic chemicals | 22 | 0.0 | 343 | 0.6 | 8 | 0.0 | 34 | 0.0 | 27 | 0.1 |
| 52. Inorganic chemicals | 6 | 0.0 | 68 | 0.1 | 78 | 0.0 | 8 | 0.0 | 4 | 0.0 |
| 53. Dyeing,tanning and colouring material | 50 | 0.0 | 40 | 0.1 | 81 | 0.1 | 60 | 0.1 | 39 | 0.1 |
| 54. Medicinal and pharmaceutical products | 835 | 0.6 | 405 | 0.8 | 803 | 0.5 | 158 | 0.2 | 804 | 2.5 |
| 55. Perfume,cleaning etc.preparations | 1,022 | 0.7 | 399 | 0.7 | 947 | 0.6 | 623 | 0.9 | 552 | 1.7 |
| 56. Fertilizers,manufactured | 2 | 0.0 | ||||||||
| 57. Plastics in primary forms | 1,243 | 0.9 | 3,332 | 6.2 | 1,584 | 1.0 | 3,628 | 5.0 | 913 | 2.8 |
| 58. Plastics in non-primary forms | 212 | 0.1 | 78 | 0.1 | 91 | 0.1 | 172 | 0.2 | 86 | 0.3 |
| 59. Chemical materials and products,n.e.s. | 192 | 0.1 | 424 | 0.8 | 245 | 0.2 | 149 | 0.2 | 405 | 1.2 |
| 6. Basic manufactures | 1,795 | 1.2 | 685 | 1.3 | 2,208 | 1.4 | 553 | 0.8 | 2,740 | 8.5 |
| 61. Leather,dressed fur,etc. | 1 | 0.0 | ||||||||
| 62. Rubber manufactures,n.e.s. | 54 | 0.0 | 114 | 0.2 | 27 | 0.0 | 35 | 0.0 | 11 | 0.0 |
| 63. Wood and cork manufactures | 11 | 0.0 | 49 | 0.1 | 53 | 0.0 | 42 | 0.1 | 25 | 0.1 |
| 64. Paper,paperboard and articles thereof | 58 | 0.0 | 8 | 0.0 | 152 | 0.1 | 8 | 0.0 | 132 | 0.4 |
| 65. Textile yarn,fabrics,made up articles,etc. | 254 | 0.2 | 45 | 0.1 | 148 | 0.1 | 17 | 0.0 | 111 | 0.3 |
| 66. Non-metallic mineral manufactures,n.e.s. | 593 | 0.4 | 84 | 0.2 | 845 | 0.5 | 108 | 0.1 | 1,251 | 3.9 |
| 67. Iron and steel | 456 | 0.3 | 15 | 0.0 | 619 | 0.4 | 16 | 0.0 | 631 | 1.9 |
| 68. Non-ferrous metals | 10 | 0.0 | 79 | 0.1 | 156 | 0.1 | 193 | 0.3 | 272 | 0.8 |
| 69. Manufactures of metals,n.e.s. | 359 | 0.2 | 291 | 0.5 | 209 | 0.1 | 133 | 0.2 | 308 | 0.9 |
| 7. Machinery,transport equipment | 2,917 | 2.0 | 7,612 | 14.3 | 8,203 | 5.1 | 3,735 | 5.2 | 8,074 | 24.9 |
| 71. Power generating machinery and equipment | 102 | 0.1 | 424 | 0.8 | 3,149 | 2.0 | 1,038 | 1.4 | 48 | 0.1 |
| 72. Machinery for specialized industries | 111 | 0.1 | 2,757 | 5.2 | 234 | 0.1 | 267 | 0.4 | 330 | 1.0 |
| 73. Metal working machinery | 12 | 0.0 | 25 | 0.0 | 5 | 0.0 | 13 | 0.0 | 32 | 0.1 |
| 74. General industrial machinery n.e.s. | 320 | 0.2 | 1,111 | 2.1 | 1,718 | 1.1 | 290 | 0.4 | 2,451 | 7.6 |
| 75. Office machines and adp machines | 178 | 0.1 | 9 | 0.0 | 76 | 0.0 | 67 | 0.1 | 352 | 1.1 |
| 76. Telecommunications and sound recording equipment | 293 | 0.2 | 503 | 0.9 | 622 | 0.4 | 321 | 0.4 | 2,146 | 6.6 |
| 77. Electric machinery,n.e.s.and parts | 763 | 0.5 | 1,721 | 3.2 | 922 | 0.6 | 776 | 1.1 | 1,349 | 4.2 |
| 78. Road vehicles | 344 | 0.2 | 426 | 0.8 | 462 | 0.3 | 423 | 0.6 | 371 | 1.1 |
| 79. Other transport equipment | 794 | 0.6 | 636 | 1.2 | 1,016 | 0.6 | 540 | 0.8 | 994 | 3.1 |
| 8. Miscellaneous manufactured articles | 3,449 | 2.4 | 4,044 | 7.6 | 3,766 | 2.3 | 2,185 | 3.0 | 3,080 | 9.5 |
| 81. Prefabr.buildings;sanitary,lighting etc.fixtrs | 54 | 0.0 | 16 | 0.0 | 239 | 0.1 | 190 | 0.3 | 34 | 0.1 |
| 82. Furniture and parts thereof | 77 | 0.1 | 6 | 0.0 | 21 | 0.0 | 16 | 0.0 | 12 | 0.0 |
| 83. Travel goods,handbags and sim.containers | 1 | 0.0 | 25 | 0.0 | 3 | 0.0 | 9 | 0.0 | ||
| 84. Articles of apparel and clothing accessories | 5 | 0.0 | 25 | 0.0 | 1 | 0.0 | 52 | 0.1 | 4 | 0.0 |
| 85. Footwear | ||||||||||
| 87. Instruments and apparates n.e.s. | 1,711 | 1.2 | 2,151 | 4.0 | 1,927 | 1.2 | 1,157 | 1.6 | 2,011 | 6.2 |
| 88. Photographic equipment,optical goods etc. | 9 | 0.0 | 46 | 0.1 | 23 | 0.0 | 14 | 0.0 | 12 | 0.0 |
| 89. Miscellaneous manufactured articles,n.e.s. | 1,591 | 1.1 | 1,774 | 3.3 | 1,552 | 1.0 | 747 | 1.0 | 1,007 | 3.1 |
| In Total | 143,970 | 100.0 | 53,374 | 100.0 | 161,275 | 100.0 | 71,842 | 100.0 | 32,423 | 100.0 |
| 2026/5 | 2026/6 | 2026/7 | 2026/8 | 2026/9 | ||||||
|---|---|---|---|---|---|---|---|---|---|---|
| 1.000 € | % | 1.000 € | % | 1.000 € | % | 1.000 € | % | 1.000 € | % | |
| 0. Food and live animals | 2,928 | 4.6 | 3,478 | 6.4 | 2,920 | 4.0 | 3,166 | 6.8 | 3,044 | 5.2 |
| 04. Cereals and cereal preparations | 301 | 0.5 | 224 | 0.4 | 265 | 0.4 | 433 | 0.9 | 590 | 1.0 |
| 05. Vegetables and fruit | 888 | 1.4 | 1,039 | 1.9 | 819 | 1.1 | 1,003 | 2.2 | 1,184 | 2.0 |
| 06. Sugars,sugar preparations and honey | 12 | 0.0 | 20 | 0.0 | 15 | 0.0 | 8 | 0.0 | 22 | 0.0 |
| 08. Feeding stuff for animals | 286 | 0.4 | 725 | 1.3 | 269 | 0.4 | 467 | 1.0 | 157 | 0.3 |
| 09. Miscellaneous edible products and preparations | 750 | 1.2 | 549 | 1.0 | 690 | 1.0 | 752 | 1.6 | 537 | 0.9 |
| 1. Beverages and tobacco | 282 | 0.4 | 257 | 0.5 | 126 | 0.2 | 290 | 0.6 | 134 | 0.2 |
| 11. Beverages | 282 | 0.4 | 256 | 0.5 | 126 | 0.2 | 290 | 0.6 | 133 | 0.2 |
| 12. Tobacco and tobacco manufactures | ||||||||||
| 2. Crude materials,inedible,except fuels | 194 | 0.3 | 255 | 0.5 | 584 | 0.8 | 222 | 0.5 | 160 | 0.3 |
| 21. Hides,skins,furskins,raw | ||||||||||
| 24. Cork and wood | 127 | 0.2 | 16 | 0.0 | 64 | 0.1 | 17 | 0.0 | 59 | 0.1 |
| 25. Pulp and waste paper | ||||||||||
| 26. Textile fibres and their wastes | ||||||||||
| 27. Crude fertilizers and crude minerals | 4 | 0.0 | 15 | 0.0 | 14 | 0.0 | ||||
| 29. Crude animal,vegetable materials n.e.s. | 63 | 0.1 | 239 | 0.4 | 505 | 0.7 | 192 | 0.4 | 100 | 0.2 |
| 3. Mineral fuels etc | ||||||||||
| 33. Petroleum and products | ||||||||||
| 34. Gas,natural and manufactured | ||||||||||
| 4. Animal and vegetable oils and fats | 126 | 0.2 | 29 | 0.1 | 86 | 0.1 | 42 | 0.1 | ||
| 42. Fixed vegetable fats and oils | 126 | 0.2 | 29 | 0.1 | 86 | 0.1 | 42 | 0.1 | ||
| 43. Processed animal or vegetable oils,etc. | ||||||||||
| 5. Chemicals and related products,n.e.s. | 7,379 | 11.5 | 17,335 | 32.0 | 24,058 | 33.2 | 8,244 | 17.8 | 18,221 | 30.9 |
| 51. Organic chemicals | 347 | 0.5 | 144 | 0.3 | 1 | 0.0 | 147 | 0.3 | 75 | 0.1 |
| 52. Inorganic chemicals | 28 | 0.0 | ||||||||
| 53. Dyeing,tanning and colouring material | 1 | 0.0 | 66 | 0.1 | 3 | 0.0 | 8 | 0.0 | ||
| 54. Medicinal and pharmaceutical products | 6,939 | 10.8 | 16,922 | 31.3 | 24,005 | 33.1 | 7,614 | 16.4 | 17,985 | 30.5 |
| 55. Perfume,cleaning etc.preparations | 2 | 0.0 | 43 | 0.1 | 3 | 0.0 | 10 | 0.0 | 9 | 0.0 |
| 56. Fertilizers,manufactured | 27 | 0.1 | ||||||||
| 57. Plastics in primary forms | 35 | 0.1 | 417 | 0.9 | ||||||
| 58. Plastics in non-primary forms | 53 | 0.1 | 156 | 0.3 | 45 | 0.1 | 20 | 0.0 | 94 | 0.2 |
| 59. Chemical materials and products,n.e.s. | 2 | 0.0 | 5 | 0.0 | 3 | 0.0 | 7 | 0.0 | 21 | 0.0 |
| 6. Basic manufactures | 2,632 | 4.1 | 4,771 | 8.8 | 4,425 | 6.1 | 3,008 | 6.5 | 3,653 | 6.2 |
| 61. Leather,dressed fur,etc. | 125 | 0.2 | 370 | 0.7 | 305 | 0.4 | 181 | 0.4 | 360 | 0.6 |
| 62. Rubber manufactures,n.e.s. | 10 | 0.0 | 73 | 0.1 | 9 | 0.0 | 2 | 0.0 | 6 | 0.0 |
| 63. Wood and cork manufactures | 1,154 | 1.8 | 2,041 | 3.8 | 905 | 1.2 | 323 | 0.7 | 591 | 1.0 |
| 64. Paper,paperboard and articles thereof | 7 | 0.0 | 20 | 0.0 | 1 | 0.0 | 16 | 0.0 | 41 | 0.1 |
| 65. Textile yarn,fabrics,made up articles,etc. | 175 | 0.3 | 185 | 0.3 | 17 | 0.0 | 1 | 0.0 | 125 | 0.2 |
| 66. Non-metallic mineral manufactures,n.e.s. | 881 | 1.4 | 1,645 | 3.0 | 2,633 | 3.6 | 1,761 | 3.8 | 1,864 | 3.2 |
| 67. Iron and steel | 173 | 0.4 | ||||||||
| 68. Non-ferrous metals | 1 | 0.0 | ||||||||
| 69. Manufactures of metals,n.e.s. | 281 | 0.4 | 438 | 0.8 | 555 | 0.8 | 551 | 1.2 | 664 | 1.1 |
| 7. Machinery,transport equipment | 37,835 | 58.9 | 14,165 | 26.2 | 29,321 | 40.4 | 23,879 | 51.5 | 21,344 | 36.2 |
| 71. Power generating machinery and equipment | 1,325 | 2.1 | 1,868 | 3.5 | 3,668 | 5.1 | 1,635 | 3.5 | 3,117 | 5.3 |
| 72. Machinery for specialized industries | 354 | 0.6 | 423 | 0.8 | 358 | 0.5 | 858 | 1.9 | 661 | 1.1 |
| 73. Metal working machinery | 248 | 0.4 | 278 | 0.5 | 165 | 0.2 | 179 | 0.4 | 156 | 0.3 |
| 74. General industrial machinery n.e.s. | 2,463 | 3.8 | 1,296 | 2.4 | 2,369 | 3.3 | 1,285 | 2.8 | 1,933 | 3.3 |
| 75. Office machines and adp machines | 637 | 1.0 | 704 | 1.3 | 485 | 0.7 | 199 | 0.4 | 277 | 0.5 |
| 76. Telecommunications and sound recording equipment | 1,161 | 1.8 | 1,167 | 2.2 | 2,120 | 2.9 | 1,694 | 3.7 | 1,606 | 2.7 |
| 77. Electric machinery,n.e.s.and parts | 30,180 | 47.0 | 8,145 | 15.1 | 18,828 | 26.0 | 17,646 | 38.1 | 13,217 | 22.4 |
| 78. Road vehicles | 4 | 0.0 | 11 | 0.0 | 58 | 0.1 | 160 | 0.3 | 17 | 0.0 |
| 79. Other transport equipment | 1,463 | 2.3 | 273 | 0.5 | 1,271 | 1.8 | 224 | 0.5 | 360 | 0.6 |
| 8. Miscellaneous manufactured articles | 12,685 | 19.8 | 13,479 | 24.9 | 10,795 | 14.9 | 7,055 | 15.2 | 12,052 | 20.5 |
| 81. Prefabr.buildings;sanitary,lighting etc.fixtrs | 69 | 0.1 | 9 | 0.0 | 157 | 0.2 | 123 | 0.3 | 82 | 0.1 |
| 82. Furniture and parts thereof | 195 | 0.3 | 469 | 0.9 | 419 | 0.6 | 45 | 0.1 | 336 | 0.6 |
| 83. Travel goods,handbags and sim.containers | 5 | 0.0 | 1 | 0.0 | 6 | 0.0 | 28 | 0.1 | 15 | 0.0 |
| 84. Articles of apparel and clothing accessories | 156 | 0.2 | 25 | 0.0 | 127 | 0.2 | 77 | 0.2 | 136 | 0.2 |
| 85. Footwear | 8 | 0.0 | 19 | 0.0 | 2 | 0.0 | ||||
| 87. Instruments and apparates n.e.s. | 971 | 1.5 | 874 | 1.6 | 867 | 1.2 | 787 | 1.7 | 882 | 1.5 |
| 88. Photographic equipment,optical goods etc. | 14 | 0.0 | 15 | 0.0 | 118 | 0.2 | 8 | 0.0 | 4 | 0.0 |
| 89. Miscellaneous manufactured articles,n.e.s. | 11,268 | 17.5 | 12,087 | 22.3 | 9,081 | 12.5 | 5,987 | 12.9 | 10,595 | 18.0 |
| In Total | 64,212 | 100.0 | 54,093 | 100.0 | 72,536 | 100.0 | 46,359 | 100.0 | 58,896 | 100.0 |