
| European countries' export and import of goods | SITC |
Data:Eurostat


| 2021 | 2022 | 2023 | 2024 | 2025 | ||||||
|---|---|---|---|---|---|---|---|---|---|---|
| 1.000 € | % | 1.000 € | % | 1.000 € | % | 1.000 € | % | 1.000 € | % | |
| 0. Food and live animals | 419 | 24.8 | 454 | 7.6 | 417 | 25.2 | 109 | 17.1 | ||
| 04. Cereals and cereal preparations | ||||||||||
| 05. Vegetables and fruit | ||||||||||
| 08. Feeding stuff for animals | ||||||||||
| 2. Crude materials,inedible,except fuels | ||||||||||
| 24. Cork and wood | ||||||||||
| 27. Crude fertilizers and crude minerals | ||||||||||
| 4. Animal and vegetable oils and fats | ||||||||||
| 42. Fixed vegetable fats and oils | ||||||||||
| 5. Chemicals and related products,n.e.s. | 75 | 4.4 | 65 | 4.5 | 141 | 22.3 | ||||
| 58. Plastics in non-primary forms | 67 | 4.0 | 65 | 4.5 | 141 | 22.3 | ||||
| 6. Basic manufactures | 11 | 0.6 | 3 | 0.2 | 9 | 1.4 | ||||
| 63. Wood and cork manufactures | ||||||||||
| 65. Textile yarn,fabrics,made up articles,etc. | ||||||||||
| 66. Non-metallic mineral manufactures,n.e.s. | ||||||||||
| 67. Iron and steel | ||||||||||
| 69. Manufactures of metals,n.e.s. | ||||||||||
| 7. Machinery,transport equipment | 1,132 | 67.1 | 228 | 3.8 | 293 | 46.3 | ||||
| 72. Machinery for specialized industries | 529 | 31.4 | ||||||||
| 74. General industrial machinery n.e.s. | 290 | 45.8 | ||||||||
| 76. Telecommunications and sound recording equipment | 7 | 0.4 | ||||||||
| 77. Electric machinery,n.e.s.and parts | ||||||||||
| 8. Miscellaneous manufactured articles | 21 | 1.3 | 106 | 1.8 | ||||||
| 81. Prefabr.buildings;sanitary,lighting etc.fixtrs | ||||||||||
| 82. Furniture and parts thereof | ||||||||||
| 84. Articles of apparel and clothing accessories | ||||||||||
| 87. Instruments and apparates n.e.s. | ||||||||||
| 88. Photographic equipment,optical goods etc. | ||||||||||
| 89. Miscellaneous manufactured articles,n.e.s. | 21 | 1.3 | ||||||||
| In Total | 1,687 | 100.0 | 5,947 | 100.0 | 1,656 | 100.0 | 1,445 | 100.0 | 633 | 100.0 |
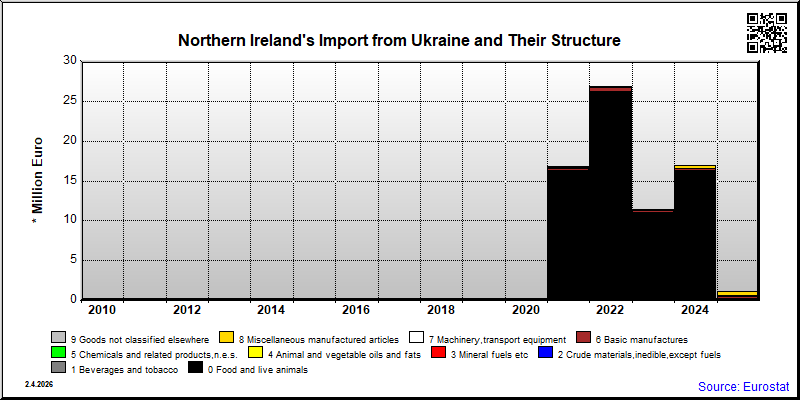
| 2021 | 2022 | 2023 | 2024 | 2025 | ||||||
|---|---|---|---|---|---|---|---|---|---|---|
| 1.000 € | % | 1.000 € | % | 1.000 € | % | 1.000 € | % | 1.000 € | % | |
| 0. Food and live animals | 16,086 | 95.9 | 26,216 | 97.6 | 10,872 | 95.2 | 7 | 0.7 | ||
| 04. Cereals and cereal preparations | ||||||||||
| 05. Vegetables and fruit | ||||||||||
| 08. Feeding stuff for animals | ||||||||||
| 2. Crude materials,inedible,except fuels | ||||||||||
| 24. Cork and wood | ||||||||||
| 27. Crude fertilizers and crude minerals | ||||||||||
| 4. Animal and vegetable oils and fats | ||||||||||
| 42. Fixed vegetable fats and oils | ||||||||||
| 5. Chemicals and related products,n.e.s. | 67 | 0.4 | 20 | 0.1 | 132 | 12.3 | ||||
| 58. Plastics in non-primary forms | 67 | 0.4 | 20 | 0.1 | 132 | 12.3 | ||||
| 6. Basic manufactures | 281 | 1.7 | 244 | 1.4 | 236 | 21.9 | ||||
| 63. Wood and cork manufactures | ||||||||||
| 65. Textile yarn,fabrics,made up articles,etc. | ||||||||||
| 66. Non-metallic mineral manufactures,n.e.s. | ||||||||||
| 67. Iron and steel | ||||||||||
| 69. Manufactures of metals,n.e.s. | ||||||||||
| 7. Machinery,transport equipment | 99 | 0.6 | 24 | 0.1 | 99 | 9.2 | ||||
| 72. Machinery for specialized industries | 56 | 0.3 | ||||||||
| 74. General industrial machinery n.e.s. | 91 | 8.4 | ||||||||
| 76. Telecommunications and sound recording equipment | 43 | 0.3 | ||||||||
| 77. Electric machinery,n.e.s.and parts | ||||||||||
| 8. Miscellaneous manufactured articles | 113 | 0.7 | 65 | 0.2 | ||||||
| 81. Prefabr.buildings;sanitary,lighting etc.fixtrs | ||||||||||
| 82. Furniture and parts thereof | ||||||||||
| 84. Articles of apparel and clothing accessories | ||||||||||
| 87. Instruments and apparates n.e.s. | ||||||||||
| 88. Photographic equipment,optical goods etc. | ||||||||||
| 89. Miscellaneous manufactured articles,n.e.s. | 14 | 0.1 | ||||||||
| In Total | 16,768 | 100.0 | 26,858 | 100.0 | 11,417 | 100.0 | 16,995 | 100.0 | 1,079 | 100.0 |