
| European countries' export and import of goods | SITC |
Data:Eurostat

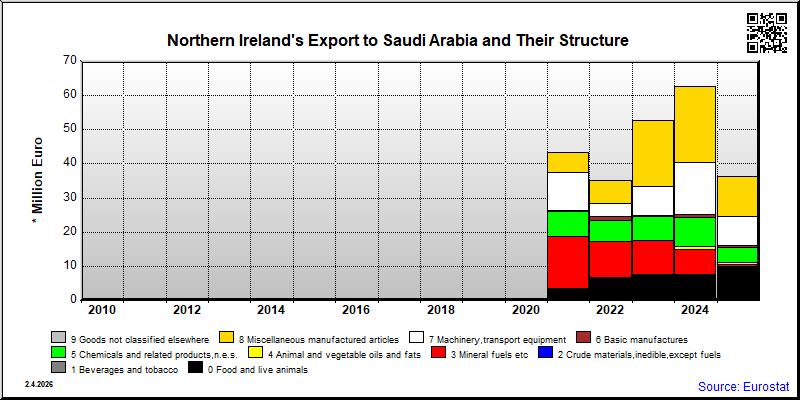
| 2021 | 2022 | 2023 | 2024 | 2025 | ||||||
|---|---|---|---|---|---|---|---|---|---|---|
| 1.000 € | % | 1.000 € | % | 1.000 € | % | 1.000 € | % | 1.000 € | % | |
| 1. Beverages and tobacco | 292 | 0.8 | ||||||||
| 11. Beverages | 292 | 0.8 | ||||||||
| 2. Crude materials,inedible,except fuels | 5 | 0.0 | ||||||||
| 26. Textile fibres and their wastes | 5 | 0.0 | ||||||||
| 3. Mineral fuels etc | 15,358 | 35.4 | 7,339 | 11.7 | ||||||
| 33. Petroleum and products | ||||||||||
| 5. Chemicals and related products,n.e.s. | 7,049 | 16.3 | 6,072 | 17.2 | 6,980 | 13.2 | 8,458 | 13.5 | 4,606 | 12.7 |
| 52. Inorganic chemicals | 982 | 1.6 | ||||||||
| 57. Plastics in primary forms | 3 | 0.0 | 2 | 0.0 | ||||||
| 58. Plastics in non-primary forms | 83 | 0.2 | 33 | 0.1 | 670 | 1.3 | 771 | 1.2 | 231 | 0.6 |
| 6. Basic manufactures | 415 | 1.0 | 1,168 | 3.3 | 267 | 0.5 | 931 | 1.5 | 428 | 1.2 |
| 65. Textile yarn,fabrics,made up articles,etc. | 356 | 0.8 | 1,038 | 2.9 | 30 | 0.1 | 112 | 0.2 | 74 | 0.2 |
| 66. Non-metallic mineral manufactures,n.e.s. | 66 | 0.2 | ||||||||
| 67. Iron and steel | ||||||||||
| 69. Manufactures of metals,n.e.s. | 69 | 0.2 | ||||||||
| 7. Machinery,transport equipment | 11,006 | 25.4 | 3,800 | 10.8 | 15,287 | 24.3 | 8,446 | 23.3 | ||
| 72. Machinery for specialized industries | 2,284 | 3.6 | ||||||||
| 75. Office machines and adp machines | 48 | 0.1 | 434 | 1.2 | ||||||
| 76. Telecommunications and sound recording equipment | 344 | 0.9 | ||||||||
| 77. Electric machinery,n.e.s.and parts | 273 | 0.8 | 1,503 | 2.4 | 364 | 1.0 | ||||
| 78. Road vehicles | 816 | 2.3 | ||||||||
| 79. Other transport equipment | 1,197 | 3.3 | ||||||||
| 8. Miscellaneous manufactured articles | 6,032 | 13.9 | 6,823 | 19.4 | 19,188 | 36.4 | 22,359 | 35.6 | 11,697 | 32.3 |
| 82. Furniture and parts thereof | 38 | 0.1 | 2,426 | 4.6 | 2,216 | 3.5 | ||||
| 84. Articles of apparel and clothing accessories | 133 | 0.4 | ||||||||
| 87. Instruments and apparates n.e.s. | 5,769 | 13.3 | 5,986 | 17.0 | 16,235 | 30.8 | 20,029 | 31.9 | 11,166 | 30.8 |
| 88. Photographic equipment,optical goods etc. | ||||||||||
| 89. Miscellaneous manufactured articles,n.e.s. | 224 | 0.5 | 801 | 2.3 | 526 | 1.0 | 102 | 0.2 | 373 | 1.0 |
| In Total | 43,375 | 100.0 | 35,253 | 100.0 | 52,714 | 100.0 | 62,799 | 100.0 | 36,209 | 100.0 |
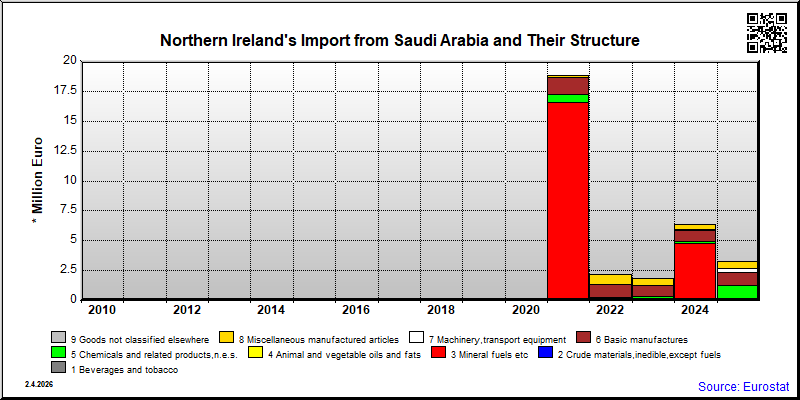
| 2021 | 2022 | 2023 | 2024 | 2025 | ||||||
|---|---|---|---|---|---|---|---|---|---|---|
| 1.000 € | % | 1.000 € | % | 1.000 € | % | 1.000 € | % | 1.000 € | % | |
| 1. Beverages and tobacco | 3 | 0.1 | ||||||||
| 11. Beverages | 3 | 0.1 | ||||||||
| 2. Crude materials,inedible,except fuels | 1 | 0.0 | ||||||||
| 26. Textile fibres and their wastes | 1 | 0.0 | ||||||||
| 3. Mineral fuels etc | 16,537 | 87.8 | 4,749 | 74.6 | ||||||
| 33. Petroleum and products | ||||||||||
| 5. Chemicals and related products,n.e.s. | 697 | 3.7 | 227 | 10.4 | 308 | 16.9 | 176 | 2.8 | 1,271 | 38.9 |
| 52. Inorganic chemicals | 37 | 0.6 | ||||||||
| 57. Plastics in primary forms | 44 | 0.7 | 1,112 | 34.1 | ||||||
| 58. Plastics in non-primary forms | 157 | 0.8 | 197 | 9.1 | 234 | 12.8 | 95 | 1.5 | 159 | 4.9 |
| 6. Basic manufactures | 1,412 | 7.5 | 1,115 | 51.3 | 938 | 51.5 | 962 | 15.1 | 1,075 | 32.9 |
| 65. Textile yarn,fabrics,made up articles,etc. | 1,348 | 7.2 | 1,115 | 51.3 | 886 | 48.7 | 926 | 14.6 | 1,039 | 31.8 |
| 66. Non-metallic mineral manufactures,n.e.s. | 31 | 1.0 | ||||||||
| 67. Iron and steel | ||||||||||
| 69. Manufactures of metals,n.e.s. | 4 | 0.1 | ||||||||
| 7. Machinery,transport equipment | 25 | 0.1 | 20 | 0.9 | 19 | 0.3 | 310 | 9.5 | ||
| 72. Machinery for specialized industries | 9 | 0.1 | ||||||||
| 75. Office machines and adp machines | 25 | 0.1 | 151 | 4.6 | ||||||
| 76. Telecommunications and sound recording equipment | 102 | 3.1 | ||||||||
| 77. Electric machinery,n.e.s.and parts | 20 | 0.9 | 10 | 0.2 | 50 | 1.5 | ||||
| 78. Road vehicles | 1 | 0.0 | ||||||||
| 79. Other transport equipment | 5 | 0.2 | ||||||||
| 8. Miscellaneous manufactured articles | 165 | 0.9 | 812 | 37.4 | 575 | 31.6 | 456 | 7.2 | 606 | 18.6 |
| 82. Furniture and parts thereof | 45 | 0.2 | 27 | 1.5 | 15 | 0.2 | ||||
| 84. Articles of apparel and clothing accessories | 8 | 0.3 | ||||||||
| 87. Instruments and apparates n.e.s. | 66 | 0.4 | 734 | 33.8 | 483 | 26.5 | 399 | 6.3 | 520 | 15.9 |
| 88. Photographic equipment,optical goods etc. | ||||||||||
| 89. Miscellaneous manufactured articles,n.e.s. | 54 | 0.3 | 78 | 3.6 | 66 | 3.6 | 42 | 0.7 | 75 | 2.3 |
| In Total | 18,838 | 100.0 | 2,173 | 100.0 | 1,822 | 100.0 | 6,362 | 100.0 | 3,264 | 100.0 |