
| European countries' export and import of goods | SITC |
Data:Eurostat
| 2021 | 2022 | 2023 | 2024 | 2025 | ||||||
|---|---|---|---|---|---|---|---|---|---|---|
| 1.000 € | % | 1.000 € | % | 1.000 € | % | 1.000 € | % | 1.000 € | % | |
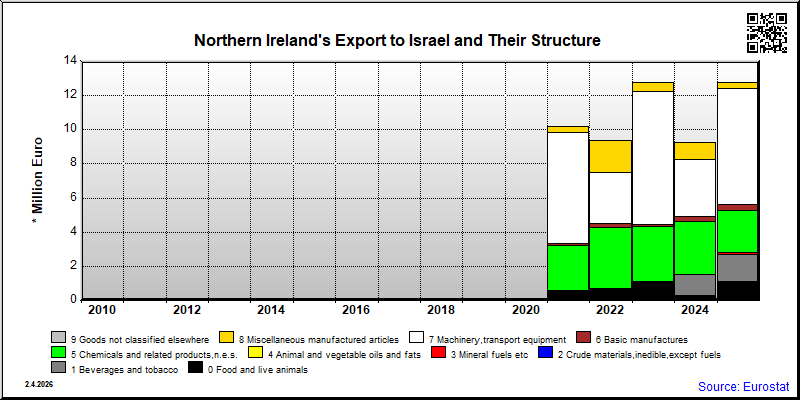
| 0. Food and live animals | 522 | 5.1 | 684 | 7.3 | 1,098 | 8.6 | 290 | 3.1 | 1,115 | 8.7 |
| 03. Fish and fish preparations | ||||||||||
| 05. Vegetables and fruit | ||||||||||
| 09. Miscellaneous edible products and preparations | ||||||||||
| 2. Crude materials,inedible,except fuels | ||||||||||
| 29. Crude animal,vegetable materials n.e.s. | ||||||||||
| 3. Mineral fuels etc | 30 | 0.3 | ||||||||
| 33. Petroleum and products | ||||||||||
| 5. Chemicals and related products,n.e.s. | 2,669 | 26.1 | 3,542 | 37.9 | 3,213 | 25.2 | 3,093 | 33.3 | 2,485 | 19.4 |
| 51. Organic chemicals | ||||||||||
| 52. Inorganic chemicals | ||||||||||
| 54. Medicinal and pharmaceutical products | 1,447 | 15.5 | 1,164 | 9.1 | 43 | 0.3 | ||||
| 55. Perfume,cleaning etc.preparations | 76 | 0.6 | ||||||||
| 57. Plastics in primary forms | 107 | 1.1 | 162 | 1.7 | 507 | 4.0 | ||||
| 58. Plastics in non-primary forms | 2,032 | 19.9 | 1,902 | 20.3 | 1,982 | 15.5 | 2,580 | 27.8 | 1,842 | 14.4 |
| 59. Chemical materials and products,n.e.s. | 94 | 0.9 | 85 | 0.9 | 67 | 0.5 | 16 | 0.1 | ||
| 6. Basic manufactures | 116 | 1.1 | 242 | 2.6 | 118 | 0.9 | 251 | 2.7 | 355 | 2.8 |
| 62. Rubber manufactures,n.e.s. | 5 | 0.0 | ||||||||
| 63. Wood and cork manufactures | 71 | 0.8 | 2 | 0.0 | ||||||
| 65. Textile yarn,fabrics,made up articles,etc. | 111 | 0.9 | 51 | 0.6 | 93 | 0.7 | ||||
| 66. Non-metallic mineral manufactures,n.e.s. | 39 | 0.4 | ||||||||
| 67. Iron and steel | 6 | 0.0 | ||||||||
| 69. Manufactures of metals,n.e.s. | 78 | 0.8 | 158 | 1.7 | 257 | 2.0 | ||||
| 7. Machinery,transport equipment | 6,483 | 63.5 | 3,029 | 32.4 | 7,804 | 61.2 | 3,354 | 36.1 | 6,738 | 52.7 |
| 71. Power generating machinery and equipment | 869 | 9.3 | 288 | 2.3 | 6 | 0.1 | 1,596 | 12.5 | ||
| 72. Machinery for specialized industries | 914 | 8.9 | 269 | 2.9 | 704 | 5.5 | 1,211 | 13.0 | 3,461 | 27.0 |
| 73. Metal working machinery | ||||||||||
| 74. General industrial machinery n.e.s. | 3,410 | 33.4 | 915 | 7.2 | ||||||
| 75. Office machines and adp machines | 114 | 1.2 | 69 | 0.5 | 16 | 0.2 | ||||
| 76. Telecommunications and sound recording equipment | 33 | 0.3 | 236 | 1.8 | 25 | 0.3 | ||||
| 77. Electric machinery,n.e.s.and parts | 145 | 1.4 | 70 | 0.7 | 20 | 0.2 | 38 | 0.3 | ||
| 79. Other transport equipment | 503 | 5.4 | ||||||||
| 8. Miscellaneous manufactured articles | 374 | 3.7 | 1,820 | 19.5 | 517 | 4.1 | 1,037 | 11.2 | 408 | 3.2 |
| 81. Prefabr.buildings;sanitary,lighting etc.fixtrs | ||||||||||
| 82. Furniture and parts thereof | 111 | 1.1 | ||||||||
| 83. Travel goods,handbags and sim.containers | ||||||||||
| 84. Articles of apparel and clothing accessories | ||||||||||
| 87. Instruments and apparates n.e.s. | 224 | 2.2 | 1,684 | 18.0 | 448 | 3.5 | 985 | 10.6 | 404 | 3.2 |
| 88. Photographic equipment,optical goods etc. | ||||||||||
| 89. Miscellaneous manufactured articles,n.e.s. | 39 | 0.4 | 91 | 1.0 | 47 | 0.5 | 4 | 0.0 | ||
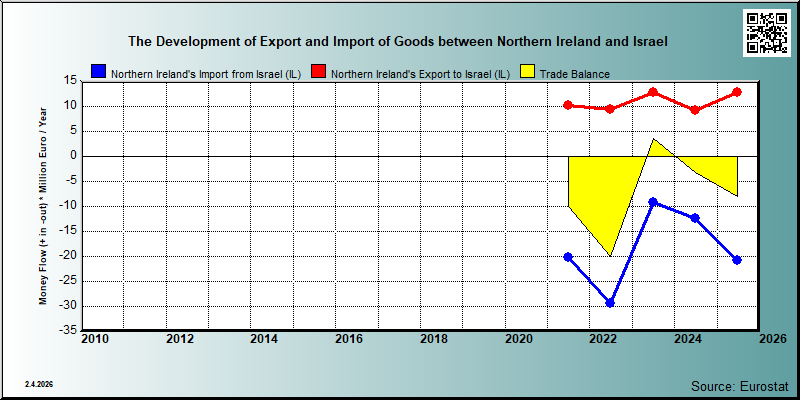
| In Total | 10,210 | 100.0 | 9,346 | 100.0 | 12,751 | 100.0 | 9,284 | 100.0 | 12,798 | 100.0 |
| 2021 | 2022 | 2023 | 2024 | 2025 | ||||||
|---|---|---|---|---|---|---|---|---|---|---|
| 1.000 € | % | 1.000 € | % | 1.000 € | % | 1.000 € | % | 1.000 € | % | |
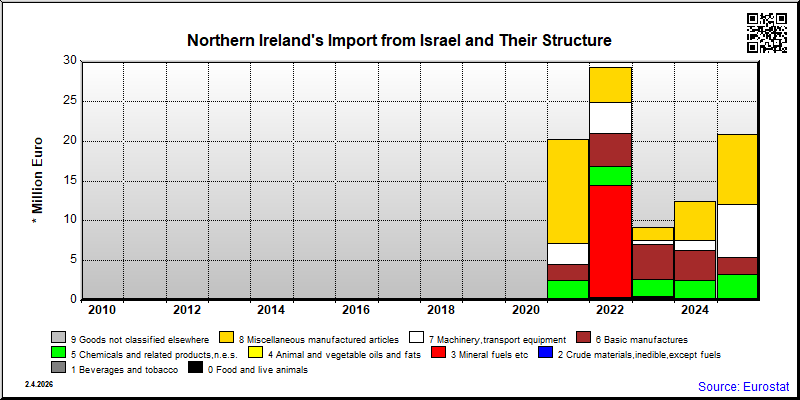
| 0. Food and live animals | 206 | 1.0 | 428 | 1.5 | 499 | 5.4 | 62 | 0.5 | 17 | 0.1 |
| 03. Fish and fish preparations | ||||||||||
| 05. Vegetables and fruit | ||||||||||
| 09. Miscellaneous edible products and preparations | ||||||||||
| 2. Crude materials,inedible,except fuels | ||||||||||
| 29. Crude animal,vegetable materials n.e.s. | ||||||||||
| 3. Mineral fuels etc | 14,027 | 47.9 | ||||||||
| 33. Petroleum and products | ||||||||||
| 5. Chemicals and related products,n.e.s. | 2,356 | 11.6 | 2,356 | 8.0 | 2,134 | 23.3 | 2,473 | 19.8 | 3,208 | 15.4 |
| 51. Organic chemicals | ||||||||||
| 52. Inorganic chemicals | ||||||||||
| 54. Medicinal and pharmaceutical products | 280 | 1.0 | 221 | 2.4 | 222 | 1.1 | ||||
| 55. Perfume,cleaning etc.preparations | 3 | 0.0 | ||||||||
| 57. Plastics in primary forms | 982 | 3.3 | 2,065 | 16.6 | 2,576 | 12.4 | ||||
| 58. Plastics in non-primary forms | 564 | 2.8 | 865 | 3.0 | 371 | 4.0 | 318 | 2.6 | 312 | 1.5 |
| 59. Chemical materials and products,n.e.s. | 85 | 0.4 | 138 | 0.5 | 103 | 1.1 | 25 | 0.1 | ||
| 6. Basic manufactures | 2,000 | 9.9 | 4,146 | 14.1 | 4,417 | 48.2 | 3,773 | 30.2 | 2,172 | 10.4 |
| 62. Rubber manufactures,n.e.s. | 25 | 0.1 | ||||||||
| 63. Wood and cork manufactures | 4 | 0.0 | 1 | 0.0 | ||||||
| 65. Textile yarn,fabrics,made up articles,etc. | 147 | 1.6 | 141 | 1.1 | 204 | 1.0 | ||||
| 66. Non-metallic mineral manufactures,n.e.s. | 3,626 | 29.1 | ||||||||
| 67. Iron and steel | 11 | 0.1 | ||||||||
| 69. Manufactures of metals,n.e.s. | 13 | 0.1 | 32 | 0.1 | 2 | 0.0 | ||||
| 7. Machinery,transport equipment | 2,546 | 12.6 | 3,929 | 13.4 | 432 | 4.7 | 1,169 | 9.4 | 6,631 | 31.8 |
| 71. Power generating machinery and equipment | 690 | 2.4 | 2 | 0.0 | 730 | 5.9 | 208 | 1.0 | ||
| 72. Machinery for specialized industries | 20 | 0.1 | 13 | 0.0 | 89 | 1.0 | 5 | 0.0 | 65 | 0.3 |
| 73. Metal working machinery | ||||||||||
| 74. General industrial machinery n.e.s. | 197 | 1.0 | 44 | 0.2 | ||||||
| 75. Office machines and adp machines | 217 | 0.7 | 88 | 1.0 | 50 | 0.4 | ||||
| 76. Telecommunications and sound recording equipment | 234 | 1.2 | 45 | 0.5 | 259 | 2.1 | ||||
| 77. Electric machinery,n.e.s.and parts | 1,628 | 8.0 | 893 | 3.0 | 209 | 2.3 | 5,111 | 24.5 | ||
| 79. Other transport equipment | 8 | 0.1 | ||||||||
| 8. Miscellaneous manufactured articles | 13,146 | 64.9 | 4,419 | 15.1 | 1,684 | 18.4 | 4,991 | 40.0 | 8,811 | 42.3 |
| 81. Prefabr.buildings;sanitary,lighting etc.fixtrs | ||||||||||
| 82. Furniture and parts thereof | 4 | 0.0 | ||||||||
| 83. Travel goods,handbags and sim.containers | ||||||||||
| 84. Articles of apparel and clothing accessories | ||||||||||
| 87. Instruments and apparates n.e.s. | 12,599 | 62.2 | 3,902 | 13.3 | 745 | 8.1 | 4,161 | 33.4 | 7,791 | 37.4 |
| 88. Photographic equipment,optical goods etc. | ||||||||||
| 89. Miscellaneous manufactured articles,n.e.s. | 444 | 2.2 | 477 | 1.6 | 581 | 4.7 | 738 | 3.5 | ||
| In Total | 20,254 | 100.0 | 29,306 | 100.0 | 9,167 | 100.0 | 12,472 | 100.0 | 20,838 | 100.0 |