
| European countries' export and import of goods | SITC |
Data:Eurostat


| 2021 | 2022 | 2023 | 2024 | 2025 | ||||||
|---|---|---|---|---|---|---|---|---|---|---|
| 1.000 € | % | 1.000 € | % | 1.000 € | % | 1.000 € | % | 1.000 € | % | |
| 0. Food and live animals | 8,578 | 46.2 | 2,116 | 10.1 | 5,332 | 63.0 | 7,333 | 63.6 | ||
| 03. Fish and fish preparations | ||||||||||
| 04. Cereals and cereal preparations | 2,836 | 15.3 | 788 | 3.8 | 1,657 | 19.6 | 2,309 | 20.0 | ||
| 05. Vegetables and fruit | 3,104 | 16.7 | 576 | 2.8 | 2,249 | 26.6 | 3,241 | 28.1 | ||
| 06. Sugars,sugar preparations and honey | 887 | 10.5 | ||||||||
| 07. Coffee,tea,cocoa,spices | 1,040 | 5.6 | 230 | 1.1 | 210 | 2.5 | 438 | 3.8 | ||
| 09. Miscellaneous edible products and preparations | 110 | 0.6 | 31 | 0.1 | 134 | 1.2 | ||||
| 1. Beverages and tobacco | 408 | 2.2 | 119 | 0.6 | 61 | 0.7 | 42 | 0.4 | ||
| 11. Beverages | 69 | 0.4 | 14 | 0.1 | 61 | 0.7 | 42 | 0.4 | ||
| 2. Crude materials,inedible,except fuels | 320 | 1.7 | 325 | 1.6 | 61 | 0.7 | 312 | 2.7 | ||
| 22. Oil seeds,oleaginous fruits | 265 | 2.3 | ||||||||
| 26. Textile fibres and their wastes | ||||||||||
| 27. Crude fertilizers and crude minerals | 8 | 0.0 | 1 | 0.0 | 12 | 0.1 | ||||
| 28. Metalliferous ores and metal scrap | 1 | 0.0 | ||||||||
| 29. Crude animal,vegetable materials n.e.s. | 56 | 0.3 | ||||||||
| 3. Mineral fuels etc | 303 | 1.6 | 74 | 0.4 | ||||||
| 32. Coal,coke and briquettes | ||||||||||
| 33. Petroleum and products | 303 | 1.6 | 74 | 0.4 | ||||||
| 4. Animal and vegetable oils and fats | 446 | 2.4 | 13,926 | 66.5 | 770 | 6.7 | ||||
| 42. Fixed vegetable fats and oils | 446 | 2.4 | 13,926 | 66.5 | 770 | 6.7 | ||||
| 5. Chemicals and related products,n.e.s. | 1,702 | 9.2 | 416 | 2.0 | 179 | 2.1 | 141 | 1.2 | ||
| 51. Organic chemicals | 48 | 0.3 | ||||||||
| 52. Inorganic chemicals | 33 | 0.2 | ||||||||
| 53. Dyeing,tanning and colouring material | 1 | 0.0 | 11 | 0.1 | 1 | 0.0 | ||||
| 54. Medicinal and pharmaceutical products | 13 | 0.1 | 11 | 0.1 | 22 | 0.3 | 2 | 0.0 | ||
| 55. Perfume,cleaning etc.preparations | 2 | 0.0 | ||||||||
| 56. Fertilizers,manufactured | 1,008 | 5.4 | ||||||||
| 58. Plastics in non-primary forms | 8 | 0.0 | 3 | 0.0 | ||||||
| 59. Chemical materials and products,n.e.s. | 407 | 2.2 | 368 | 1.8 | 146 | 1.7 | 135 | 1.2 | ||
| 6. Basic manufactures | 702 | 3.8 | 1,197 | 5.7 | 1,095 | 12.9 | 1,227 | 10.6 | ||
| 61. Leather,dressed fur,etc. | 16 | 0.1 | 5 | 0.1 | ||||||
| 62. Rubber manufactures,n.e.s. | 2 | 0.0 | 15 | 0.2 | 3 | 0.0 | ||||
| 63. Wood and cork manufactures | 13 | 0.1 | 17 | 0.1 | ||||||
| 64. Paper,paperboard and articles thereof | 232 | 1.3 | 97 | 0.5 | 55 | 0.7 | 141 | 1.2 | ||
| 65. Textile yarn,fabrics,made up articles,etc. | 75 | 0.4 | 17 | 0.1 | 9 | 0.1 | 3 | 0.0 | ||
| 66. Non-metallic mineral manufactures,n.e.s. | 55 | 0.3 | 2 | 0.0 | 9 | 0.1 | ||||
| 67. Iron and steel | 1 | 0.0 | 695 | 3.3 | 104 | 0.9 | ||||
| 68. Non-ferrous metals | 2 | 0.0 | 1 | 0.0 | ||||||
| 69. Manufactures of metals,n.e.s. | 304 | 1.6 | 386 | 1.8 | 1,009 | 11.9 | 950 | 8.2 | ||
| 7. Machinery,transport equipment | 4,731 | 25.5 | 1,739 | 8.3 | 971 | 11.5 | 1,046 | 9.1 | ||
| 71. Power generating machinery and equipment | 41 | 0.2 | 1 | 0.0 | 25 | 0.3 | 64 | 0.6 | ||
| 72. Machinery for specialized industries | 301 | 1.6 | 257 | 1.2 | 145 | 1.7 | 152 | 1.3 | ||
| 73. Metal working machinery | 2 | 0.0 | 1 | 0.0 | ||||||
| 74. General industrial machinery n.e.s. | 603 | 3.3 | 241 | 1.2 | 328 | 3.9 | 465 | 4.0 | ||
| 76. Telecommunications and sound recording equipment | 203 | 1.1 | 99 | 0.5 | 6 | 0.1 | 1 | 0.0 | ||
| 77. Electric machinery,n.e.s.and parts | 3,414 | 18.4 | 690 | 3.3 | 217 | 2.6 | 143 | 1.2 | ||
| 78. Road vehicles | 168 | 0.8 | ||||||||
| 79. Other transport equipment | 195 | 1.7 | ||||||||
| 8. Miscellaneous manufactured articles | 1,360 | 7.3 | 986 | 4.7 | 770 | 9.1 | 664 | 5.8 | ||
| 81. Prefabr.buildings;sanitary,lighting etc.fixtrs | 31 | 0.2 | 52 | 0.4 | ||||||
| 82. Furniture and parts thereof | 32 | 0.2 | 52 | 0.6 | ||||||
| 83. Travel goods,handbags and sim.containers | 1 | 0.0 | 1 | 0.0 | 1 | 0.0 | ||||
| 84. Articles of apparel and clothing accessories | 103 | 0.6 | 67 | 0.3 | 96 | 1.1 | 78 | 0.7 | ||
| 87. Instruments and apparates n.e.s. | 952 | 5.1 | 582 | 2.8 | 350 | 4.1 | 329 | 2.9 | ||
| 88. Photographic equipment,optical goods etc. | 12 | 0.1 | 2 | 0.0 | 2 | 0.0 | ||||
| 89. Miscellaneous manufactured articles,n.e.s. | 227 | 1.2 | 336 | 1.6 | 235 | 2.8 | 197 | 1.7 | ||
| 9. Goods not classified elsewhere | 12 | 0.1 | ||||||||
| In Total | 18,561 | 100.0 | 20,941 | 100.0 | 8,470 | 100.0 | 11,535 | 100.0 | ||
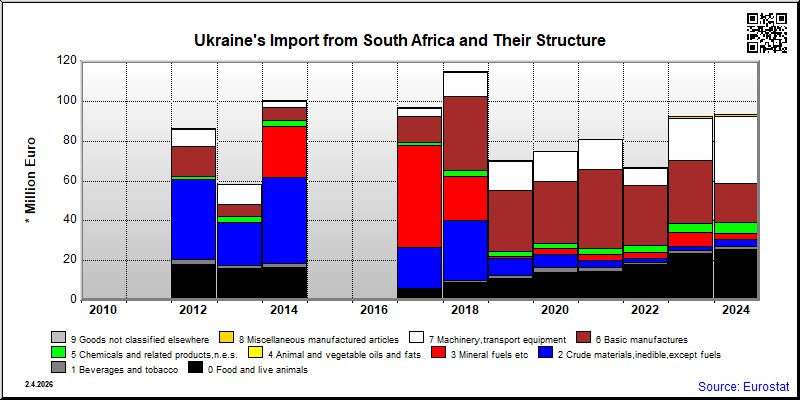
| 2021 | 2022 | 2023 | 2024 | 2025 | ||||||
|---|---|---|---|---|---|---|---|---|---|---|
| 1.000 € | % | 1.000 € | % | 1.000 € | % | 1.000 € | % | 1.000 € | % | |
| 0. Food and live animals | 14,684 | 18.1 | 18,046 | 27.0 | 23,785 | 25.8 | 25,474 | 27.3 | ||
| 03. Fish and fish preparations | ||||||||||
| 04. Cereals and cereal preparations | 3 | 0.0 | 1 | 0.0 | 29 | 0.0 | 1 | 0.0 | ||
| 05. Vegetables and fruit | 14,605 | 18.0 | 18,024 | 26.9 | 23,695 | 25.7 | 25,418 | 27.2 | ||
| 06. Sugars,sugar preparations and honey | 1 | 0.0 | ||||||||
| 07. Coffee,tea,cocoa,spices | 49 | 0.1 | 12 | 0.0 | 31 | 0.0 | 30 | 0.0 | ||
| 09. Miscellaneous edible products and preparations | 26 | 0.0 | 8 | 0.0 | 26 | 0.0 | 25 | 0.0 | ||
| 1. Beverages and tobacco | 1,820 | 2.2 | 1,181 | 1.8 | 1,316 | 1.4 | 1,763 | 1.9 | ||
| 11. Beverages | 1,820 | 2.2 | 1,181 | 1.8 | 1,316 | 1.4 | 1,763 | 1.9 | ||
| 2. Crude materials,inedible,except fuels | 3,485 | 4.3 | 1,971 | 2.9 | 2,176 | 2.4 | 3,561 | 3.8 | ||
| 22. Oil seeds,oleaginous fruits | 48 | 0.1 | ||||||||
| 26. Textile fibres and their wastes | ||||||||||
| 27. Crude fertilizers and crude minerals | 196 | 0.2 | 442 | 0.7 | 124 | 0.1 | ||||
| 28. Metalliferous ores and metal scrap | 2,970 | 3.7 | 2,724 | 2.9 | ||||||
| 29. Crude animal,vegetable materials n.e.s. | 201 | 0.3 | ||||||||
| 3. Mineral fuels etc | 3,175 | 3.9 | 2,888 | 4.3 | 6,983 | 7.6 | 2,646 | 2.8 | ||
| 32. Coal,coke and briquettes | ||||||||||
| 33. Petroleum and products | 3,175 | 3.9 | 195 | 0.3 | 370 | 0.4 | 187 | 0.2 | ||
| 4. Animal and vegetable oils and fats | 18 | 0.0 | 15 | 0.0 | 22 | 0.0 | ||||
| 42. Fixed vegetable fats and oils | 18 | 0.0 | 14 | 0.0 | 22 | 0.0 | ||||
| 5. Chemicals and related products,n.e.s. | 3,005 | 3.7 | 3,637 | 5.4 | 4,570 | 5.0 | 5,568 | 6.0 | ||
| 51. Organic chemicals | 54 | 0.1 | 812 | 1.2 | 1,496 | 1.6 | ||||
| 52. Inorganic chemicals | 47 | 0.1 | 69 | 0.1 | 231 | 0.3 | ||||
| 53. Dyeing,tanning and colouring material | 76 | 0.1 | 77 | 0.1 | 360 | 0.4 | 749 | 0.8 | ||
| 54. Medicinal and pharmaceutical products | 1,630 | 2.0 | 1,390 | 2.1 | 2,196 | 2.4 | 1,461 | 1.6 | ||
| 55. Perfume,cleaning etc.preparations | 488 | 0.6 | 239 | 0.3 | 330 | 0.4 | ||||
| 56. Fertilizers,manufactured | 129 | 0.2 | ||||||||
| 58. Plastics in non-primary forms | 9 | 0.0 | 33 | 0.0 | 918 | 1.0 | ||||
| 59. Chemical materials and products,n.e.s. | 572 | 0.7 | 1,138 | 1.7 | 26 | 0.0 | 422 | 0.5 | ||
| 6. Basic manufactures | 39,815 | 49.2 | 29,871 | 44.6 | 31,494 | 34.2 | 19,595 | 21.0 | ||
| 61. Leather,dressed fur,etc. | 28,498 | 35.2 | 26,472 | 28.7 | ||||||
| 62. Rubber manufactures,n.e.s. | 193 | 0.2 | 1,207 | 1.3 | 293 | 0.3 | ||||
| 63. Wood and cork manufactures | 47 | 0.1 | ||||||||
| 64. Paper,paperboard and articles thereof | 3 | 0.0 | 4 | 0.0 | ||||||
| 65. Textile yarn,fabrics,made up articles,etc. | 135 | 0.2 | 205 | 0.3 | 47 | 0.1 | 78 | 0.1 | ||
| 66. Non-metallic mineral manufactures,n.e.s. | 77 | 0.1 | 95 | 0.1 | 29 | 0.0 | ||||
| 67. Iron and steel | 4,411 | 5.5 | 2,280 | 3.4 | 215 | 0.2 | ||||
| 68. Non-ferrous metals | 6,051 | 7.5 | 4,042 | 6.0 | 3,161 | 3.4 | 1,495 | 1.6 | ||
| 69. Manufactures of metals,n.e.s. | 399 | 0.5 | 185 | 0.3 | 190 | 0.2 | 308 | 0.3 | ||
| 7. Machinery,transport equipment | 14,646 | 18.1 | 8,480 | 12.7 | 20,952 | 22.7 | 33,730 | 36.1 | ||
| 71. Power generating machinery and equipment | 387 | 0.5 | 253 | 0.4 | 494 | 0.5 | 757 | 0.8 | ||
| 72. Machinery for specialized industries | 2,777 | 3.4 | 1,610 | 2.4 | 295 | 0.3 | 1,702 | 1.8 | ||
| 73. Metal working machinery | 20 | 0.0 | ||||||||
| 74. General industrial machinery n.e.s. | 900 | 1.1 | 635 | 0.9 | 924 | 1.0 | 1,024 | 1.1 | ||
| 76. Telecommunications and sound recording equipment | 1 | 0.0 | 22 | 0.0 | 241 | 0.3 | 35 | 0.0 | ||
| 77. Electric machinery,n.e.s.and parts | 40 | 0.0 | 33 | 0.0 | 77 | 0.1 | 42 | 0.0 | ||
| 78. Road vehicles | 10,541 | 13.0 | 5,928 | 8.9 | ||||||
| 79. Other transport equipment | 57 | 0.1 | ||||||||
| 8. Miscellaneous manufactured articles | 251 | 0.3 | 580 | 0.9 | 838 | 0.9 | 1,068 | 1.1 | ||
| 81. Prefabr.buildings;sanitary,lighting etc.fixtrs | 58 | 0.1 | 1 | 0.0 | ||||||
| 82. Furniture and parts thereof | 5 | 0.0 | ||||||||
| 83. Travel goods,handbags and sim.containers | 1 | 0.0 | 5 | 0.0 | 2 | 0.0 | ||||
| 84. Articles of apparel and clothing accessories | 9 | 0.0 | 400 | 0.6 | 401 | 0.4 | 474 | 0.5 | ||
| 87. Instruments and apparates n.e.s. | 24 | 0.0 | 59 | 0.1 | 105 | 0.1 | 111 | 0.1 | ||
| 88. Photographic equipment,optical goods etc. | 83 | 0.1 | 306 | 0.3 | 433 | 0.5 | ||||
| 89. Miscellaneous manufactured articles,n.e.s. | 71 | 0.1 | 76 | 0.1 | 21 | 0.0 | 45 | 0.0 | ||
| 9. Goods not classified elsewhere | 36 | 0.0 | 10 | 0.0 | 24 | 0.0 | ||||
| In Total | 80,934 | 100.0 | 66,931 | 100.0 | 92,145 | 100.0 | 93,452 | 100.0 | ||