
| European countries' export and import of goods | SITC |
Data:Eurostat
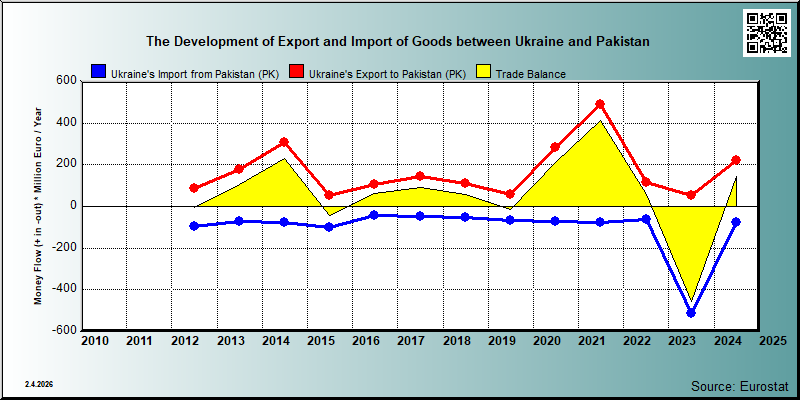

| 2021 | 2022 | 2023 | 2024 | 2025 | ||||||
|---|---|---|---|---|---|---|---|---|---|---|
| 1.000 € | % | 1.000 € | % | 1.000 € | % | 1.000 € | % | 1.000 € | % | |
| 0. Food and live animals | 317,663 | 64.7 | 82,766 | 70.8 | 45,241 | 83.3 | 93,631 | 42.9 | ||
| 00. Live animals | 37 | 0.0 | ||||||||
| 03. Fish and fish preparations | ||||||||||
| 04. Cereals and cereal preparations | 303,365 | 61.8 | 76,272 | 65.2 | 42,000 | 77.4 | 91,167 | 41.7 | ||
| 05. Vegetables and fruit | 12,256 | 2.5 | 5,281 | 4.5 | 2,705 | 5.0 | 1,843 | 0.8 | ||
| 06. Sugars,sugar preparations and honey | ||||||||||
| 07. Coffee,tea,cocoa,spices | ||||||||||
| 08. Feeding stuff for animals | ||||||||||
| 09. Miscellaneous edible products and preparations | ||||||||||
| 1. Beverages and tobacco | ||||||||||
| 12. Tobacco and tobacco manufactures | ||||||||||
| 2. Crude materials,inedible,except fuels | 101,817 | 20.7 | 32,355 | 27.7 | 132 | 0.2 | 114,703 | 52.5 | ||
| 22. Oil seeds,oleaginous fruits | 97,921 | 20.0 | 31,222 | 26.7 | 9 | 0.0 | 114,679 | 52.5 | ||
| 26. Textile fibres and their wastes | 66 | 0.0 | 23 | 0.0 | 4 | 0.0 | ||||
| 27. Crude fertilizers and crude minerals | 216 | 0.0 | 89 | 0.1 | 15 | 0.0 | 10 | 0.0 | ||
| 29. Crude animal,vegetable materials n.e.s. | ||||||||||
| 5. Chemicals and related products,n.e.s. | 1,735 | 0.4 | 208 | 0.2 | 2,180 | 4.0 | 377 | 0.2 | ||
| 52. Inorganic chemicals | ||||||||||
| 54. Medicinal and pharmaceutical products | 1 | 0.0 | 175 | 0.1 | 2,115 | 3.9 | 269 | 0.1 | ||
| 55. Perfume,cleaning etc.preparations | ||||||||||
| 57. Plastics in primary forms | ||||||||||
| 58. Plastics in non-primary forms | 15 | 0.0 | 1 | 0.0 | 3 | 0.0 | 8 | 0.0 | ||
| 59. Chemical materials and products,n.e.s. | 1,683 | 0.3 | 6 | 0.0 | 66 | 0.0 | ||||
| 6. Basic manufactures | 24,575 | 5.0 | 179 | 0.2 | 12 | 0.0 | 842 | 0.4 | ||
| 61. Leather,dressed fur,etc. | ||||||||||
| 62. Rubber manufactures,n.e.s. | 313 | 0.1 | 1 | 0.0 | 45 | 0.0 | ||||
| 64. Paper,paperboard and articles thereof | 201 | 0.0 | 135 | 0.1 | ||||||
| 65. Textile yarn,fabrics,made up articles,etc. | 5 | 0.0 | ||||||||
| 66. Non-metallic mineral manufactures,n.e.s. | 29 | 0.0 | 1 | 0.0 | 1 | 0.0 | ||||
| 67. Iron and steel | 23,687 | 4.8 | 29 | 0.0 | 1 | 0.0 | 42 | 0.0 | ||
| 69. Manufactures of metals,n.e.s. | 297 | 0.1 | 29 | 0.0 | 11 | 0.0 | 620 | 0.3 | ||
| 7. Machinery,transport equipment | 29,499 | 6.0 | 1,143 | 1.0 | 4,268 | 7.9 | 3,397 | 1.6 | ||
| 72. Machinery for specialized industries | 736 | 0.1 | 29 | 0.0 | 2 | 0.0 | 20 | 0.0 | ||
| 74. General industrial machinery n.e.s. | 2,679 | 0.5 | 1,021 | 0.9 | 335 | 0.6 | 512 | 0.2 | ||
| 75. Office machines and adp machines | ||||||||||
| 77. Electric machinery,n.e.s.and parts | 1,824 | 0.4 | 51 | 0.0 | 737 | 1.4 | 292 | 0.1 | ||
| 78. Road vehicles | 1,827 | 0.4 | 35 | 0.0 | 223 | 0.4 | 85 | 0.0 | ||
| 8. Miscellaneous manufactured articles | 6,533 | 1.3 | 203 | 0.2 | 1,805 | 3.3 | 4,830 | 2.2 | ||
| 81. Prefabr.buildings;sanitary,lighting etc.fixtrs | 4 | 0.0 | ||||||||
| 82. Furniture and parts thereof | 1 | 0.0 | 17 | 0.0 | ||||||
| 83. Travel goods,handbags and sim.containers | 1 | 0.0 | ||||||||
| 84. Articles of apparel and clothing accessories | 1 | 0.0 | ||||||||
| 85. Footwear | ||||||||||
| 87. Instruments and apparates n.e.s. | 6,194 | 1.3 | 63 | 0.1 | 1,805 | 3.3 | 4,809 | 2.2 | ||
| 88. Photographic equipment,optical goods etc. | 3 | 0.0 | ||||||||
| 89. Miscellaneous manufactured articles,n.e.s. | 332 | 0.1 | 135 | 0.1 | 4 | 0.0 | ||||
| 9. Goods not classified elsewhere | 7,534 | 1.5 | 53 | 0.1 | 665 | 0.3 | ||||
| In Total | 490,821 | 100.0 | 116,943 | 100.0 | 54,278 | 100.0 | 218,445 | 100.0 | ||
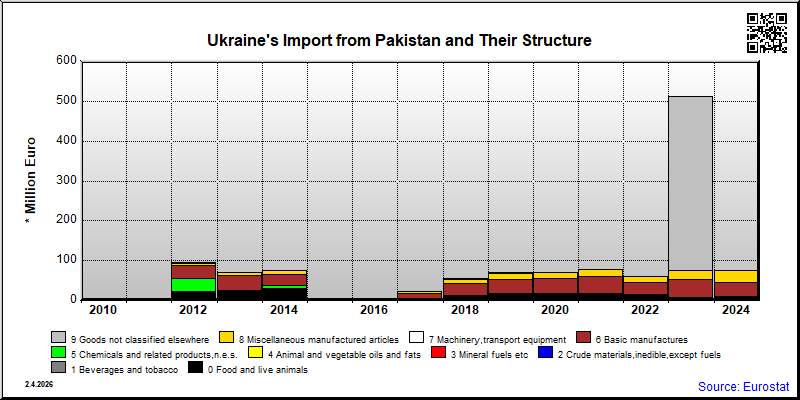
| 2021 | 2022 | 2023 | 2024 | 2025 | ||||||
|---|---|---|---|---|---|---|---|---|---|---|
| 1.000 € | % | 1.000 € | % | 1.000 € | % | 1.000 € | % | 1.000 € | % | |
| 0. Food and live animals | 13,228 | 17.1 | 12,956 | 21.2 | 5,398 | 1.1 | 8,903 | 11.7 | ||
| 00. Live animals | 2 | 0.0 | ||||||||
| 03. Fish and fish preparations | ||||||||||
| 04. Cereals and cereal preparations | 4,776 | 6.2 | 8,228 | 13.5 | 2,750 | 0.5 | 4,810 | 6.3 | ||
| 05. Vegetables and fruit | 8,250 | 10.7 | 4,530 | 7.4 | 2,160 | 0.4 | 3,466 | 4.6 | ||
| 06. Sugars,sugar preparations and honey | 199 | 0.3 | ||||||||
| 07. Coffee,tea,cocoa,spices | ||||||||||
| 08. Feeding stuff for animals | ||||||||||
| 09. Miscellaneous edible products and preparations | ||||||||||
| 1. Beverages and tobacco | ||||||||||
| 12. Tobacco and tobacco manufactures | ||||||||||
| 2. Crude materials,inedible,except fuels | 933 | 1.2 | 318 | 0.5 | 520 | 0.1 | 589 | 0.8 | ||
| 22. Oil seeds,oleaginous fruits | 1 | 0.0 | 5 | 0.0 | 42 | 0.0 | 75 | 0.1 | ||
| 26. Textile fibres and their wastes | 238 | 0.3 | ||||||||
| 27. Crude fertilizers and crude minerals | 688 | 0.9 | 310 | 0.5 | 470 | 0.1 | 513 | 0.7 | ||
| 29. Crude animal,vegetable materials n.e.s. | 7 | 0.0 | ||||||||
| 5. Chemicals and related products,n.e.s. | 1,990 | 2.6 | 1,455 | 2.4 | 1,345 | 0.3 | 1,312 | 1.7 | ||
| 52. Inorganic chemicals | ||||||||||
| 54. Medicinal and pharmaceutical products | 218 | 0.3 | 233 | 0.4 | 76 | 0.0 | 123 | 0.2 | ||
| 55. Perfume,cleaning etc.preparations | 876 | 1.4 | 1,144 | 1.5 | ||||||
| 57. Plastics in primary forms | 41 | 0.1 | ||||||||
| 58. Plastics in non-primary forms | 1 | 0.0 | 1 | 0.0 | 1 | 0.0 | 1 | 0.0 | ||
| 59. Chemical materials and products,n.e.s. | 305 | 0.4 | 161 | 0.3 | 3 | 0.0 | ||||
| 6. Basic manufactures | 42,707 | 55.2 | 29,067 | 47.6 | 45,339 | 8.9 | 34,219 | 44.9 | ||
| 61. Leather,dressed fur,etc. | ||||||||||
| 62. Rubber manufactures,n.e.s. | 61 | 0.1 | 62 | 0.1 | 52 | 0.1 | ||||
| 64. Paper,paperboard and articles thereof | 1 | 0.0 | ||||||||
| 65. Textile yarn,fabrics,made up articles,etc. | 40,080 | 51.8 | 28,520 | 46.7 | ||||||
| 66. Non-metallic mineral manufactures,n.e.s. | 86 | 0.1 | 15 | 0.0 | 212 | 0.0 | 87 | 0.1 | ||
| 67. Iron and steel | 1,964 | 2.5 | 77 | 0.1 | 21 | 0.0 | 105 | 0.1 | ||
| 69. Manufactures of metals,n.e.s. | 360 | 0.5 | 284 | 0.5 | 324 | 0.1 | 530 | 0.7 | ||
| 7. Machinery,transport equipment | 15 | 0.0 | 73 | 0.1 | 122 | 0.0 | 33 | 0.0 | ||
| 72. Machinery for specialized industries | 48 | 0.1 | 96 | 0.0 | ||||||
| 74. General industrial machinery n.e.s. | 5 | 0.0 | 6 | 0.0 | 13 | 0.0 | 9 | 0.0 | ||
| 75. Office machines and adp machines | ||||||||||
| 77. Electric machinery,n.e.s.and parts | 2 | 0.0 | ||||||||
| 78. Road vehicles | 10 | 0.0 | 19 | 0.0 | 12 | 0.0 | 13 | 0.0 | ||
| 8. Miscellaneous manufactured articles | 16,735 | 21.6 | 15,590 | 25.5 | 22,440 | 4.4 | 30,642 | 40.2 | ||
| 81. Prefabr.buildings;sanitary,lighting etc.fixtrs | 6 | 0.0 | ||||||||
| 82. Furniture and parts thereof | 112 | 0.2 | 4 | 0.0 | ||||||
| 83. Travel goods,handbags and sim.containers | 101 | 0.1 | 74 | 0.1 | ||||||
| 84. Articles of apparel and clothing accessories | 13,471 | 17.4 | 12,413 | 20.3 | ||||||
| 85. Footwear | ||||||||||
| 87. Instruments and apparates n.e.s. | 913 | 1.2 | 1,149 | 1.9 | 1,700 | 0.3 | 1,283 | 1.7 | ||
| 88. Photographic equipment,optical goods etc. | ||||||||||
| 89. Miscellaneous manufactured articles,n.e.s. | 1,510 | 1.9 | 1,264 | 2.1 | 963 | 0.2 | 1,195 | 1.6 | ||
| 9. Goods not classified elsewhere | 151 | 0.2 | 436,234 | 85.2 | 168 | 0.2 | ||||
| In Total | 77,431 | 100.0 | 61,101 | 100.0 | 511,713 | 100.0 | 76,135 | 100.0 | ||