
| European countries' export and import of goods | SITC |
Data:Eurostat

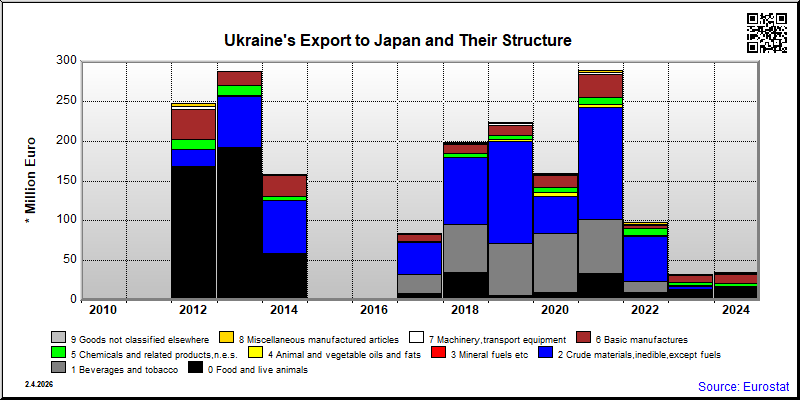
| 2021 | 2022 | 2023 | 2024 | 2025 | ||||||
|---|---|---|---|---|---|---|---|---|---|---|
| 1.000 € | % | 1.000 € | % | 1.000 € | % | 1.000 € | % | 1.000 € | % | |
| 0. Food and live animals | 33,284 | 11.5 | 9,499 | 9.7 | 13,536 | 41.0 | 14,558 | 41.6 | ||
| 00. Live animals | 119 | 0.0 | ||||||||
| 01. Meat and meat preparations | 49 | 0.0 | 3 | 0.0 | ||||||
| 03. Fish and fish preparations | 3,034 | 1.1 | 5,289 | 5.4 | 3 | 0.0 | 48 | 0.1 | ||
| 04. Cereals and cereal preparations | 23,437 | 8.1 | 281 | 0.3 | 12,239 | 37.1 | 8,826 | 25.2 | ||
| 05. Vegetables and fruit | 1,362 | 0.5 | 1,216 | 1.2 | 178 | 0.5 | 2,208 | 6.3 | ||
| 06. Sugars,sugar preparations and honey | 3,320 | 1.1 | 1,729 | 1.8 | 553 | 1.7 | 908 | 2.6 | ||
| 07. Coffee,tea,cocoa,spices | 113 | 0.0 | 32 | 0.1 | 20 | 0.1 | ||||
| 09. Miscellaneous edible products and preparations | 13 | 0.0 | 28 | 0.0 | 60 | 0.2 | 176 | 0.5 | ||
| 1. Beverages and tobacco | 68,824 | 23.8 | 14,881 | 15.2 | 236 | 0.7 | 206 | 0.6 | ||
| 11. Beverages | 36 | 0.0 | 276 | 0.3 | 236 | 0.7 | 206 | 0.6 | ||
| 12. Tobacco and tobacco manufactures | 68,787 | 23.8 | 14,605 | 15.0 | ||||||
| 2. Crude materials,inedible,except fuels | 139,594 | 48.4 | 56,139 | 57.5 | 4,362 | 13.2 | 1,692 | 4.8 | ||
| 21. Hides,skins,furskins,raw | 19 | 0.0 | ||||||||
| 23. Crude rubber (incl.synthetic) | ||||||||||
| 26. Textile fibres and their wastes | 1 | 0.0 | ||||||||
| 27. Crude fertilizers and crude minerals | 83 | 0.0 | 61 | 0.1 | 68 | 0.2 | 34 | 0.1 | ||
| 28. Metalliferous ores and metal scrap | 3,018 | 9.1 | ||||||||
| 29. Crude animal,vegetable materials n.e.s. | 38 | 0.0 | 5 | 0.0 | 158 | 0.5 | ||||
| 3. Mineral fuels etc | 41 | 0.0 | 2 | 0.0 | 7 | 0.0 | 17 | 0.0 | ||
| 33. Petroleum and products | 41 | 0.0 | 2 | 0.0 | 7 | 0.0 | 17 | 0.0 | ||
| 4. Animal and vegetable oils and fats | 4,270 | 1.5 | 1,110 | 1.1 | 339 | 1.0 | 1,033 | 2.9 | ||
| 42. Fixed vegetable fats and oils | 4,270 | 1.5 | 1,110 | 1.1 | 339 | 1.0 | 1,033 | 2.9 | ||
| 5. Chemicals and related products,n.e.s. | 8,458 | 2.9 | 8,200 | 8.4 | 4,623 | 14.0 | 3,406 | 9.7 | ||
| 51. Organic chemicals | 690 | 0.2 | 419 | 0.4 | 755 | 2.3 | 939 | 2.7 | ||
| 52. Inorganic chemicals | 2,040 | 0.7 | 5,673 | 5.8 | 2,233 | 6.8 | 1,263 | 3.6 | ||
| 53. Dyeing,tanning and colouring material | 765 | 0.3 | 277 | 0.3 | 3 | 0.0 | 4 | 0.0 | ||
| 54. Medicinal and pharmaceutical products | 6 | 0.0 | 1 | 0.0 | 127 | 0.4 | 8 | 0.0 | ||
| 55. Perfume,cleaning etc.preparations | 65 | 0.0 | 5 | 0.0 | ||||||
| 56. Fertilizers,manufactured | ||||||||||
| 57. Plastics in primary forms | ||||||||||
| 58. Plastics in non-primary forms | 52 | 0.0 | 19 | 0.0 | 32 | 0.1 | 29 | 0.1 | ||
| 59. Chemical materials and products,n.e.s. | 4,841 | 1.7 | 2 | 0.0 | 1,473 | 4.5 | 1,162 | 3.3 | ||
| 6. Basic manufactures | 29,817 | 10.3 | 4,839 | 5.0 | 7,720 | 23.4 | 11,966 | 34.2 | ||
| 61. Leather,dressed fur,etc. | 2 | 0.0 | 64 | 0.1 | 9 | 0.0 | 21 | 0.1 | ||
| 62. Rubber manufactures,n.e.s. | 6 | 0.0 | 1 | 0.0 | 1 | 0.0 | ||||
| 63. Wood and cork manufactures | 686 | 0.2 | 495 | 0.5 | 589 | 1.8 | 102 | 0.3 | ||
| 64. Paper,paperboard and articles thereof | 3 | 0.0 | 1 | 0.0 | 6 | 0.0 | 3 | 0.0 | ||
| 65. Textile yarn,fabrics,made up articles,etc. | 365 | 0.1 | 132 | 0.1 | 173 | 0.5 | 57 | 0.2 | ||
| 66. Non-metallic mineral manufactures,n.e.s. | 28 | 0.0 | 126 | 0.1 | 35 | 0.1 | 21 | 0.1 | ||
| 67. Iron and steel | 3,561 | 1.2 | 35 | 0.0 | 24 | 0.1 | ||||
| 68. Non-ferrous metals | 22,499 | 7.8 | 3,630 | 3.7 | 6,876 | 20.8 | 11,757 | 33.6 | ||
| 69. Manufactures of metals,n.e.s. | 2,668 | 0.9 | 356 | 0.4 | 6 | 0.0 | 5 | 0.0 | ||
| 7. Machinery,transport equipment | 2,494 | 0.9 | 1,209 | 1.2 | 779 | 2.4 | 630 | 1.8 | ||
| 71. Power generating machinery and equipment | 5 | 0.0 | 1 | 0.0 | 234 | 0.7 | ||||
| 72. Machinery for specialized industries | 159 | 0.1 | 57 | 0.2 | ||||||
| 73. Metal working machinery | ||||||||||
| 74. General industrial machinery n.e.s. | 1,996 | 0.7 | 977 | 1.0 | 219 | 0.7 | 502 | 1.4 | ||
| 75. Office machines and adp machines | 6 | 0.0 | 3 | 0.0 | 31 | 0.1 | ||||
| 76. Telecommunications and sound recording equipment | 3 | 0.0 | 52 | 0.1 | ||||||
| 77. Electric machinery,n.e.s.and parts | 279 | 0.1 | 148 | 0.2 | 295 | 0.9 | 62 | 0.2 | ||
| 78. Road vehicles | 17 | 0.0 | 26 | 0.0 | 6 | 0.0 | ||||
| 79. Other transport equipment | 30 | 0.0 | 2 | 0.0 | 3 | 0.0 | ||||
| 8. Miscellaneous manufactured articles | 1,760 | 0.6 | 1,649 | 1.7 | 1,408 | 4.3 | 1,470 | 4.2 | ||
| 81. Prefabr.buildings;sanitary,lighting etc.fixtrs | 58 | 0.0 | 50 | 0.1 | 22 | 0.1 | 39 | 0.1 | ||
| 82. Furniture and parts thereof | 25 | 0.0 | 7 | 0.0 | 27 | 0.1 | 50 | 0.1 | ||
| 83. Travel goods,handbags and sim.containers | 92 | 0.0 | 82 | 0.1 | 109 | 0.3 | 143 | 0.4 | ||
| 84. Articles of apparel and clothing accessories | 226 | 0.1 | 169 | 0.2 | 380 | 1.1 | 425 | 1.2 | ||
| 85. Footwear | 5 | 0.0 | ||||||||
| 87. Instruments and apparates n.e.s. | 123 | 0.0 | 120 | 0.1 | 52 | 0.2 | 41 | 0.1 | ||
| 88. Photographic equipment,optical goods etc. | 212 | 0.1 | 166 | 0.2 | 149 | 0.5 | 171 | 0.5 | ||
| 89. Miscellaneous manufactured articles,n.e.s. | 1,020 | 0.4 | 1,053 | 1.1 | 668 | 2.0 | 601 | 1.7 | ||
| 9. Goods not classified elsewhere | 140 | 0.0 | 143 | 0.1 | 56 | 0.2 | ||||
| 97. Gold,non-monetary | ||||||||||
| In Total | 288,683 | 100.0 | 97,678 | 100.0 | 33,009 | 100.0 | 35,033 | 100.0 | ||
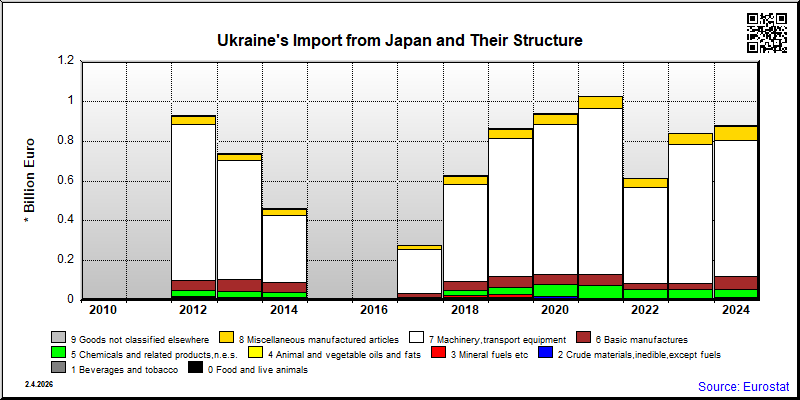
| 2021 | 2022 | 2023 | 2024 | 2025 | ||||||
|---|---|---|---|---|---|---|---|---|---|---|
| 1.000 € | % | 1.000 € | % | 1.000 € | % | 1.000 € | % | 1.000 € | % | |
| 0. Food and live animals | 1,621 | 0.2 | 558 | 0.1 | 801 | 0.1 | 1,036 | 0.1 | ||
| 00. Live animals | 25 | 0.0 | ||||||||
| 01. Meat and meat preparations | 46 | 0.0 | 16 | 0.0 | ||||||
| 03. Fish and fish preparations | 9 | 0.0 | 10 | 0.0 | 33 | 0.0 | 48 | 0.0 | ||
| 04. Cereals and cereal preparations | 418 | 0.0 | 139 | 0.0 | 195 | 0.0 | 299 | 0.0 | ||
| 05. Vegetables and fruit | 23 | 0.0 | 1 | 0.0 | 7 | 0.0 | 13 | 0.0 | ||
| 06. Sugars,sugar preparations and honey | 4 | 0.0 | 1 | 0.0 | 42 | 0.0 | 19 | 0.0 | ||
| 07. Coffee,tea,cocoa,spices | 333 | 0.0 | 102 | 0.0 | 247 | 0.0 | 322 | 0.0 | ||
| 09. Miscellaneous edible products and preparations | 764 | 0.1 | 305 | 0.0 | 277 | 0.0 | 320 | 0.0 | ||
| 1. Beverages and tobacco | 748 | 0.1 | 475 | 0.1 | 887 | 0.1 | 1,406 | 0.2 | ||
| 11. Beverages | 747 | 0.1 | 474 | 0.1 | 887 | 0.1 | 1,406 | 0.2 | ||
| 12. Tobacco and tobacco manufactures | 1 | 0.0 | 1 | 0.0 | ||||||
| 2. Crude materials,inedible,except fuels | 7,511 | 0.7 | 8,906 | 1.4 | 8,296 | 1.0 | 8,123 | 0.9 | ||
| 21. Hides,skins,furskins,raw | 9 | 0.0 | ||||||||
| 23. Crude rubber (incl.synthetic) | ||||||||||
| 26. Textile fibres and their wastes | 7,089 | 0.7 | 8,673 | 1.4 | ||||||
| 27. Crude fertilizers and crude minerals | 27 | 0.0 | 22 | 0.0 | 30 | 0.0 | 36 | 0.0 | ||
| 28. Metalliferous ores and metal scrap | 3 | 0.0 | ||||||||
| 29. Crude animal,vegetable materials n.e.s. | 259 | 0.0 | 65 | 0.0 | 93 | 0.0 | ||||
| 3. Mineral fuels etc | 2,094 | 0.2 | 901 | 0.1 | 1,604 | 0.2 | 2,602 | 0.3 | ||
| 33. Petroleum and products | 2,094 | 0.2 | 901 | 0.1 | 1,604 | 0.2 | 2,602 | 0.3 | ||
| 4. Animal and vegetable oils and fats | 23 | 0.0 | 6 | 0.0 | 3 | 0.0 | 7 | 0.0 | ||
| 42. Fixed vegetable fats and oils | 23 | 0.0 | 6 | 0.0 | 3 | 0.0 | 7 | 0.0 | ||
| 5. Chemicals and related products,n.e.s. | 64,219 | 6.3 | 42,351 | 6.9 | 42,071 | 5.0 | 44,155 | 5.0 | ||
| 51. Organic chemicals | 6,158 | 0.6 | 7,986 | 1.3 | 7,926 | 0.9 | 9,483 | 1.1 | ||
| 52. Inorganic chemicals | 236 | 0.0 | 252 | 0.0 | 146 | 0.0 | 366 | 0.0 | ||
| 53. Dyeing,tanning and colouring material | 1,332 | 0.1 | 658 | 0.1 | 1,058 | 0.1 | 1,567 | 0.2 | ||
| 54. Medicinal and pharmaceutical products | 39,164 | 3.8 | 23,069 | 3.7 | 20,377 | 2.4 | 17,834 | 2.0 | ||
| 55. Perfume,cleaning etc.preparations | 4,505 | 0.4 | 1,466 | 0.2 | ||||||
| 56. Fertilizers,manufactured | ||||||||||
| 57. Plastics in primary forms | 1,950 | 0.2 | ||||||||
| 58. Plastics in non-primary forms | 2,081 | 0.2 | 2,143 | 0.3 | 2,747 | 0.3 | 1,988 | 0.2 | ||
| 59. Chemical materials and products,n.e.s. | 6,834 | 0.7 | 3,011 | 0.5 | 5,562 | 0.7 | 7,690 | 0.9 | ||
| 6. Basic manufactures | 52,692 | 5.1 | 31,788 | 5.2 | 30,348 | 3.6 | 62,087 | 7.1 | ||
| 61. Leather,dressed fur,etc. | 1 | 0.0 | ||||||||
| 62. Rubber manufactures,n.e.s. | 29,921 | 2.9 | 17,713 | 2.9 | 17,171 | 2.0 | 12,188 | 1.4 | ||
| 63. Wood and cork manufactures | 17 | 0.0 | 13 | 0.0 | 7 | 0.0 | 9 | 0.0 | ||
| 64. Paper,paperboard and articles thereof | 692 | 0.1 | 559 | 0.1 | 505 | 0.1 | 691 | 0.1 | ||
| 65. Textile yarn,fabrics,made up articles,etc. | 7,029 | 0.7 | 4,006 | 0.6 | 3,380 | 0.4 | 1,494 | 0.2 | ||
| 66. Non-metallic mineral manufactures,n.e.s. | 3,823 | 0.4 | 2,137 | 0.3 | 2,308 | 0.3 | 3,099 | 0.4 | ||
| 67. Iron and steel | 3,872 | 0.4 | 1,922 | 0.3 | 653 | 0.1 | ||||
| 68. Non-ferrous metals | 391 | 0.0 | 184 | 0.0 | 179 | 0.0 | 606 | 0.1 | ||
| 69. Manufactures of metals,n.e.s. | 6,947 | 0.7 | 5,253 | 0.9 | 6,145 | 0.7 | 8,784 | 1.0 | ||
| 7. Machinery,transport equipment | 832,898 | 81.1 | 482,050 | 78.2 | 697,581 | 83.1 | 682,020 | 77.8 | ||
| 71. Power generating machinery and equipment | 9,970 | 1.0 | 8,645 | 1.4 | 11,979 | 1.4 | 15,763 | 1.8 | ||
| 72. Machinery for specialized industries | 20,718 | 2.0 | 41,773 | 4.8 | ||||||
| 73. Metal working machinery | ||||||||||
| 74. General industrial machinery n.e.s. | 32,217 | 3.1 | 18,176 | 2.9 | 28,026 | 3.3 | 32,755 | 3.7 | ||
| 75. Office machines and adp machines | 12,211 | 1.2 | 6,660 | 1.1 | 10,088 | 1.2 | ||||
| 76. Telecommunications and sound recording equipment | 6,338 | 0.6 | 1,280 | 0.2 | ||||||
| 77. Electric machinery,n.e.s.and parts | 79,677 | 7.8 | 48,589 | 7.9 | 52,704 | 6.3 | 52,375 | 6.0 | ||
| 78. Road vehicles | 667,978 | 65.1 | 385,907 | 62.6 | 505,116 | 57.6 | ||||
| 79. Other transport equipment | 133 | 0.0 | 249 | 0.0 | 22 | 0.0 | ||||
| 8. Miscellaneous manufactured articles | 60,800 | 5.9 | 44,534 | 7.2 | 56,052 | 6.7 | 73,118 | 8.3 | ||
| 81. Prefabr.buildings;sanitary,lighting etc.fixtrs | 23 | 0.0 | 11 | 0.0 | 244 | 0.0 | 329 | 0.0 | ||
| 82. Furniture and parts thereof | 358 | 0.0 | 33 | 0.0 | 168 | 0.0 | 228 | 0.0 | ||
| 83. Travel goods,handbags and sim.containers | 101 | 0.0 | 70 | 0.0 | 43 | 0.0 | 45 | 0.0 | ||
| 84. Articles of apparel and clothing accessories | 204 | 0.0 | 160 | 0.0 | 312 | 0.0 | 433 | 0.0 | ||
| 85. Footwear | 6 | 0.0 | 12 | 0.0 | ||||||
| 87. Instruments and apparates n.e.s. | 37,700 | 3.7 | 32,236 | 5.2 | 36,068 | 4.3 | 49,416 | 5.6 | ||
| 88. Photographic equipment,optical goods etc. | 10,619 | 1.0 | 4,181 | 0.7 | 7,506 | 0.9 | 9,472 | 1.1 | ||
| 89. Miscellaneous manufactured articles,n.e.s. | 11,790 | 1.1 | 7,842 | 1.3 | 11,675 | 1.4 | 13,175 | 1.5 | ||
| 9. Goods not classified elsewhere | 4,165 | 0.4 | 1,416 | 0.2 | 1,853 | 0.2 | ||||
| 97. Gold,non-monetary | ||||||||||
| In Total | 1,026,772 | 100.0 | 616,819 | 100.0 | 839,482 | 100.0 | 876,407 | 100.0 | ||