
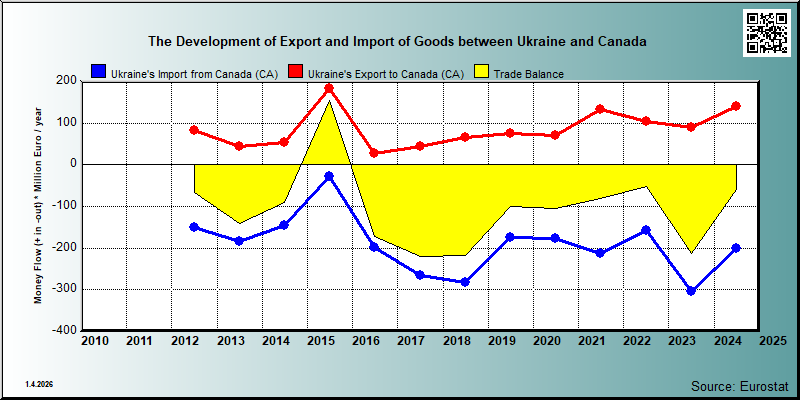
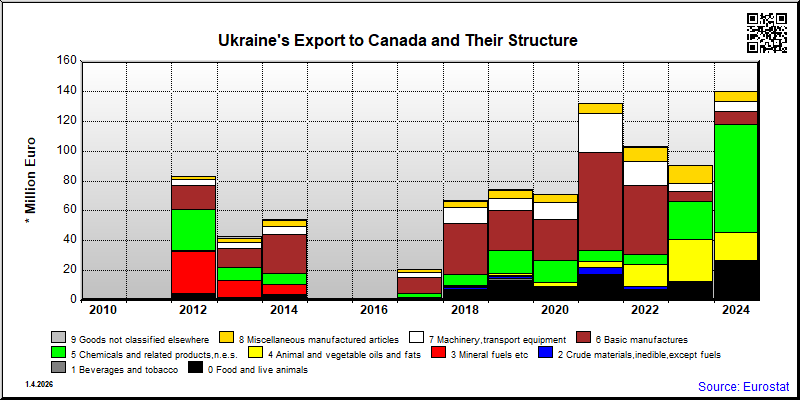
| European countries' export and import of goods | SITC |
Data:Eurostat
| 2021 | 2022 | 2023 | 2024 | 2025 | ||||||
|---|---|---|---|---|---|---|---|---|---|---|
| 1.000 € | % | 1.000 € | % | 1.000 € | % | 1.000 € | % | 1.000 € | % | |
| 0. Food and live animals | 16,588 | 12.6 | 6,997 | 6.7 | 11,741 | 13.0 | 25,202 | 18.0 | ||
| 00. Live animals | 233 | 0.3 | ||||||||
| 01. Meat and meat preparations | 75 | 0.1 | 4,314 | 4.8 | 3,084 | 2.2 | ||||
| 03. Fish and fish preparations | 206 | 0.2 | 85 | 0.1 | 283 | 0.3 | 397 | 0.3 | ||
| 04. Cereals and cereal preparations | 2,147 | 1.6 | 987 | 0.9 | 1,794 | 2.0 | 1,896 | 1.4 | ||
| 05. Vegetables and fruit | 13,089 | 9.9 | 3,434 | 3.3 | 2,437 | 2.7 | 15,740 | 11.2 | ||
| 06. Sugars,sugar preparations and honey | 352 | 0.3 | 634 | 0.6 | 780 | 0.9 | 943 | 0.7 | ||
| 07. Coffee,tea,cocoa,spices | 250 | 0.2 | 347 | 0.3 | 860 | 0.9 | 1,837 | 1.3 | ||
| 08. Feeding stuff for animals | 2 | 0.0 | 319 | 0.3 | 337 | 0.4 | 4 | 0.0 | ||
| 09. Miscellaneous edible products and preparations | 343 | 0.3 | 732 | 0.7 | 455 | 0.5 | 870 | 0.6 | ||
| 1. Beverages and tobacco | 624 | 0.5 | 598 | 0.6 | 507 | 0.6 | 753 | 0.5 | ||
| 11. Beverages | 610 | 0.5 | 578 | 0.6 | 507 | 0.6 | 753 | 0.5 | ||
| 12. Tobacco and tobacco manufactures | 20 | 0.0 | ||||||||
| 2. Crude materials,inedible,except fuels | 4,625 | 3.5 | 1,621 | 1.5 | 493 | 0.5 | 416 | 0.3 | ||
| 22. Oil seeds,oleaginous fruits | 2,707 | 2.1 | 864 | 0.8 | 402 | 0.4 | 86 | 0.1 | ||
| 23. Crude rubber (incl.synthetic) | ||||||||||
| 24. Cork and wood | 1,747 | 1.3 | 63 | 0.1 | 246 | 0.2 | ||||
| 25. Pulp and waste paper | ||||||||||
| 26. Textile fibres and their wastes | 1 | 0.0 | ||||||||
| 27. Crude fertilizers and crude minerals | 6 | 0.0 | 1 | 0.0 | 1 | 0.0 | 1 | 0.0 | ||
| 28. Metalliferous ores and metal scrap | 36 | 0.0 | ||||||||
| 29. Crude animal,vegetable materials n.e.s. | 129 | 0.1 | 43 | 0.0 | 27 | 0.0 | 84 | 0.1 | ||
| 3. Mineral fuels etc | 194 | 0.1 | 118 | 0.1 | 173 | 0.2 | 200 | 0.1 | ||
| 32. Coal,coke and briquettes | ||||||||||
| 33. Petroleum and products | 194 | 0.1 | 118 | 0.1 | 173 | 0.2 | 200 | 0.1 | ||
| 4. Animal and vegetable oils and fats | 4,075 | 3.1 | 27,589 | 30.4 | 18,971 | 13.5 | ||||
| 41. Animal oils and fats | ||||||||||
| 5. Chemicals and related products,n.e.s. | 7,297 | 5.5 | 6,660 | 6.3 | 25,870 | 28.5 | 72,510 | 51.7 | ||
| 51. Organic chemicals | 6 | 0.0 | 4 | 0.0 | 24 | 0.0 | 12 | 0.0 | ||
| 52. Inorganic chemicals | 967 | 0.7 | 2 | 0.0 | 25,180 | 27.8 | 71,976 | 51.3 | ||
| 53. Dyeing,tanning and colouring material | 5,809 | 4.4 | 6,409 | 6.1 | 226 | 0.2 | 37 | 0.0 | ||
| 54. Medicinal and pharmaceutical products | 84 | 0.1 | 154 | 0.1 | 170 | 0.2 | 125 | 0.1 | ||
| 55. Perfume,cleaning etc.preparations | 63 | 0.0 | 35 | 0.0 | 99 | 0.1 | 171 | 0.1 | ||
| 56. Fertilizers,manufactured | ||||||||||
| 57. Plastics in primary forms | ||||||||||
| 58. Plastics in non-primary forms | 37 | 0.0 | 45 | 0.0 | 148 | 0.2 | 167 | 0.1 | ||
| 59. Chemical materials and products,n.e.s. | 332 | 0.3 | 8 | 0.0 | 22 | 0.0 | 23 | 0.0 | ||
| 6. Basic manufactures | 65,396 | 49.5 | 45,962 | 43.7 | 6,748 | 7.4 | 8,731 | 6.2 | ||
| 61. Leather,dressed fur,etc. | 36 | 0.0 | 8 | 0.0 | 18 | 0.0 | 31 | 0.0 | ||
| 62. Rubber manufactures,n.e.s. | 186 | 0.1 | 60 | 0.1 | 23 | 0.0 | 3 | 0.0 | ||
| 63. Wood and cork manufactures | 5,273 | 4.0 | 973 | 0.9 | 951 | 1.0 | 1,197 | 0.9 | ||
| 64. Paper,paperboard and articles thereof | 16 | 0.0 | 6 | 0.0 | 13 | 0.0 | 64 | 0.0 | ||
| 65. Textile yarn,fabrics,made up articles,etc. | 882 | 0.7 | 344 | 0.3 | 362 | 0.4 | 431 | 0.3 | ||
| 66. Non-metallic mineral manufactures,n.e.s. | 1,731 | 1.3 | 569 | 0.5 | 208 | 0.2 | 242 | 0.2 | ||
| 67. Iron and steel | 28,599 | 21.7 | 34,561 | 32.9 | 1,135 | 1.3 | 3,249 | 2.3 | ||
| 68. Non-ferrous metals | 26,753 | 20.3 | 6,104 | 5.8 | 1,762 | 1.9 | 2 | 0.0 | ||
| 69. Manufactures of metals,n.e.s. | 1,920 | 1.5 | 3,337 | 3.2 | 2,276 | 2.5 | 3,510 | 2.5 | ||
| 7. Machinery,transport equipment | 26,429 | 20.0 | 16,248 | 15.5 | 5,367 | 5.9 | 6,469 | 4.6 | ||
| 71. Power generating machinery and equipment | 976 | 0.7 | 21 | 0.0 | 101 | 0.1 | 23 | 0.0 | ||
| 72. Machinery for specialized industries | 1,341 | 1.0 | 546 | 0.5 | 1,261 | 1.4 | 540 | 0.4 | ||
| 73. Metal working machinery | 234 | 0.2 | 10 | 0.0 | 66 | 0.1 | ||||
| 74. General industrial machinery n.e.s. | 2,496 | 1.9 | 878 | 0.8 | 1,779 | 2.0 | 1,770 | 1.3 | ||
| 75. Office machines and adp machines | 29 | 0.0 | 194 | 0.2 | 10 | 0.0 | 30 | 0.0 | ||
| 76. Telecommunications and sound recording equipment | 38 | 0.0 | 362 | 0.3 | 25 | 0.0 | 64 | 0.0 | ||
| 77. Electric machinery,n.e.s.and parts | 498 | 0.4 | 293 | 0.3 | 592 | 0.7 | 398 | 0.3 | ||
| 78. Road vehicles | 9,638 | 7.3 | 8,681 | 8.3 | 418 | 0.5 | 1,766 | 1.3 | ||
| 79. Other transport equipment | 11,180 | 8.5 | 5,263 | 5.0 | 1,115 | 1.2 | 1,808 | 1.3 | ||
| 8. Miscellaneous manufactured articles | 6,628 | 5.0 | 9,625 | 9.2 | 12,083 | 13.3 | 6,797 | 4.8 | ||
| 81. Prefabr.buildings;sanitary,lighting etc.fixtrs | 134 | 0.1 | 116 | 0.1 | 280 | 0.3 | 221 | 0.2 | ||
| 82. Furniture and parts thereof | 1,193 | 0.9 | 1,085 | 1.0 | 1,664 | 1.8 | 2,472 | 1.8 | ||
| 83. Travel goods,handbags and sim.containers | 18 | 0.0 | 7 | 0.0 | 17 | 0.0 | 14 | 0.0 | ||
| 84. Articles of apparel and clothing accessories | 1,335 | 1.0 | 1,381 | 1.3 | 1,543 | 1.7 | 1,033 | 0.7 | ||
| 85. Footwear | 196 | 0.1 | 164 | 0.2 | 196 | 0.2 | 124 | 0.1 | ||
| 87. Instruments and apparates n.e.s. | 472 | 0.4 | 4,767 | 4.5 | 5,924 | 6.5 | 436 | 0.3 | ||
| 88. Photographic equipment,optical goods etc. | 18 | 0.0 | 18 | 0.0 | 61 | 0.1 | 1 | 0.0 | ||
| 89. Miscellaneous manufactured articles,n.e.s. | 3,261 | 2.5 | 2,083 | 2.0 | 2,400 | 2.6 | 2,495 | 1.8 | ||
| 9. Goods not classified elsewhere | 140 | 0.1 | 86 | 0.1 | 88 | 0.1 | 160 | 0.1 | ||
| In Total | 131,997 | 100.0 | 105,082 | 100.0 | 90,660 | 100.0 | 140,210 | 100.0 | ||

| 2021 | 2022 | 2023 | 2024 | 2025 | ||||||
|---|---|---|---|---|---|---|---|---|---|---|
| 1.000 € | % | 1.000 € | % | 1.000 € | % | 1.000 € | % | 1.000 € | % | |
| 0. Food and live animals | 54,678 | 25.6 | 38,945 | 24.7 | 34,742 | 11.4 | 31,718 | 15.8 | ||
| 00. Live animals | 19 | 0.0 | ||||||||
| 01. Meat and meat preparations | 3,250 | 1.5 | 600 | 0.4 | 5,304 | 1.7 | 2,732 | 1.4 | ||
| 03. Fish and fish preparations | 40,555 | 19.0 | 31,067 | 19.7 | 23,351 | 7.7 | 22,960 | 11.4 | ||
| 04. Cereals and cereal preparations | 237 | 0.1 | 1 | 0.0 | 58 | 0.0 | 62 | 0.0 | ||
| 05. Vegetables and fruit | 3,988 | 1.9 | 1,991 | 1.3 | 2,643 | 0.9 | 1,753 | 0.9 | ||
| 06. Sugars,sugar preparations and honey | 161 | 0.1 | 41 | 0.0 | 94 | 0.0 | 116 | 0.1 | ||
| 07. Coffee,tea,cocoa,spices | 122 | 0.1 | 1 | 0.0 | 7 | 0.0 | 81 | 0.0 | ||
| 08. Feeding stuff for animals | 6,319 | 3.0 | 5,243 | 3.3 | 3,239 | 1.1 | 4,015 | 2.0 | ||
| 09. Miscellaneous edible products and preparations | 45 | 0.0 | 2 | 0.0 | 26 | 0.0 | ||||
| 1. Beverages and tobacco | 438 | 0.2 | 324 | 0.2 | 953 | 0.3 | 653 | 0.3 | ||
| 11. Beverages | 438 | 0.2 | 293 | 0.2 | 559 | 0.2 | 653 | 0.3 | ||
| 12. Tobacco and tobacco manufactures | 31 | 0.0 | ||||||||
| 2. Crude materials,inedible,except fuels | 3,110 | 1.5 | 2,183 | 1.4 | 3,800 | 1.3 | 3,739 | 1.9 | ||
| 22. Oil seeds,oleaginous fruits | 524 | 0.2 | 93 | 0.1 | 682 | 0.2 | 682 | 0.3 | ||
| 23. Crude rubber (incl.synthetic) | ||||||||||
| 24. Cork and wood | 87 | 0.0 | 54 | 0.0 | 1 | 0.0 | ||||
| 25. Pulp and waste paper | ||||||||||
| 26. Textile fibres and their wastes | ||||||||||
| 27. Crude fertilizers and crude minerals | 135 | 0.1 | 7 | 0.0 | 157 | 0.1 | 108 | 0.1 | ||
| 28. Metalliferous ores and metal scrap | 512 | 0.2 | ||||||||
| 29. Crude animal,vegetable materials n.e.s. | 1,852 | 0.9 | 1,931 | 1.2 | 2,800 | 0.9 | 2,645 | 1.3 | ||
| 3. Mineral fuels etc | 950 | 0.4 | 1,135 | 0.7 | 1,214 | 0.4 | 20,166 | 10.1 | ||
| 32. Coal,coke and briquettes | ||||||||||
| 33. Petroleum and products | 950 | 0.4 | 1,135 | 0.7 | 1,214 | 0.4 | 969 | 0.5 | ||
| 4. Animal and vegetable oils and fats | 1 | 0.0 | ||||||||
| 41. Animal oils and fats | ||||||||||
| 5. Chemicals and related products,n.e.s. | 21,168 | 9.9 | 15,826 | 10.0 | 16,280 | 5.4 | 19,530 | 9.7 | ||
| 51. Organic chemicals | 173 | 0.1 | 85 | 0.1 | 174 | 0.1 | 242 | 0.1 | ||
| 52. Inorganic chemicals | 346 | 0.2 | 194 | 0.1 | 172 | 0.1 | 184 | 0.1 | ||
| 53. Dyeing,tanning and colouring material | 477 | 0.2 | 325 | 0.2 | 321 | 0.1 | 318 | 0.2 | ||
| 54. Medicinal and pharmaceutical products | 16,989 | 7.9 | 12,590 | 8.0 | 11,433 | 3.8 | 14,402 | 7.2 | ||
| 55. Perfume,cleaning etc.preparations | 1,458 | 0.7 | 788 | 0.5 | 1,322 | 0.4 | 1,896 | 0.9 | ||
| 56. Fertilizers,manufactured | ||||||||||
| 57. Plastics in primary forms | ||||||||||
| 58. Plastics in non-primary forms | 589 | 0.3 | 184 | 0.1 | 164 | 0.1 | 220 | 0.1 | ||
| 59. Chemical materials and products,n.e.s. | 1,002 | 0.5 | 1,254 | 0.8 | 798 | 0.3 | 1,300 | 0.6 | ||
| 6. Basic manufactures | 7,577 | 3.5 | 8,404 | 5.3 | 6,533 | 2.2 | 10,247 | 5.1 | ||
| 61. Leather,dressed fur,etc. | 4 | 0.0 | 7 | 0.0 | 8 | 0.0 | 8 | 0.0 | ||
| 62. Rubber manufactures,n.e.s. | 2,068 | 1.0 | 2,084 | 1.3 | 2,450 | 0.8 | 2,906 | 1.4 | ||
| 63. Wood and cork manufactures | 8 | 0.0 | 43 | 0.0 | 1 | 0.0 | ||||
| 64. Paper,paperboard and articles thereof | 99 | 0.0 | 32 | 0.0 | 220 | 0.1 | 422 | 0.2 | ||
| 65. Textile yarn,fabrics,made up articles,etc. | 181 | 0.1 | 268 | 0.2 | 106 | 0.0 | 216 | 0.1 | ||
| 66. Non-metallic mineral manufactures,n.e.s. | 202 | 0.1 | 185 | 0.1 | 499 | 0.2 | 493 | 0.2 | ||
| 67. Iron and steel | 1,027 | 0.5 | 275 | 0.2 | 278 | 0.1 | 1,392 | 0.7 | ||
| 68. Non-ferrous metals | 68 | 0.0 | 1,352 | 0.9 | 829 | 0.3 | 1,854 | 0.9 | ||
| 69. Manufactures of metals,n.e.s. | 3,921 | 1.8 | 4,159 | 2.6 | 2,141 | 0.7 | 2,950 | 1.5 | ||
| 7. Machinery,transport equipment | 88,050 | 41.2 | 57,730 | 36.6 | 51,810 | 17.1 | 65,995 | 32.9 | ||
| 71. Power generating machinery and equipment | 1,839 | 0.9 | 1,795 | 1.1 | 2,151 | 0.7 | 2,298 | 1.1 | ||
| 72. Machinery for specialized industries | 9,818 | 4.6 | 11,145 | 7.1 | 10,537 | 3.5 | 11,316 | 5.6 | ||
| 73. Metal working machinery | 18 | 0.0 | 1 | 0.0 | 6 | 0.0 | ||||
| 74. General industrial machinery n.e.s. | 6,831 | 3.2 | 4,667 | 3.0 | 6,292 | 2.1 | 4,147 | 2.1 | ||
| 75. Office machines and adp machines | 413 | 0.2 | 198 | 0.1 | 382 | 0.1 | 914 | 0.5 | ||
| 76. Telecommunications and sound recording equipment | 2,678 | 1.3 | 2,871 | 1.8 | 6,053 | 2.0 | 11,473 | 5.7 | ||
| 77. Electric machinery,n.e.s.and parts | 1,934 | 0.9 | 1,291 | 0.8 | 2,691 | 0.9 | 3,777 | 1.9 | ||
| 78. Road vehicles | 54,835 | 25.6 | 25,208 | 16.0 | 23,361 | 7.7 | 31,837 | 15.9 | ||
| 79. Other transport equipment | 9,676 | 4.5 | 10,555 | 6.7 | 324 | 0.1 | 174 | 0.1 | ||
| 8. Miscellaneous manufactured articles | 36,074 | 16.9 | 8,305 | 5.3 | 5,632 | 1.9 | 7,159 | 3.6 | ||
| 81. Prefabr.buildings;sanitary,lighting etc.fixtrs | 18 | 0.0 | 445 | 0.3 | 197 | 0.1 | 127 | 0.1 | ||
| 82. Furniture and parts thereof | 56 | 0.0 | 17 | 0.0 | 33 | 0.0 | 23 | 0.0 | ||
| 83. Travel goods,handbags and sim.containers | 37 | 0.0 | 203 | 0.1 | 105 | 0.0 | 659 | 0.3 | ||
| 84. Articles of apparel and clothing accessories | 327 | 0.2 | 230 | 0.1 | 70 | 0.0 | 129 | 0.1 | ||
| 85. Footwear | 1 | 0.0 | 1 | 0.0 | 1 | 0.0 | ||||
| 87. Instruments and apparates n.e.s. | 33,796 | 15.8 | 3,179 | 2.0 | 3,356 | 1.1 | 3,974 | 2.0 | ||
| 88. Photographic equipment,optical goods etc. | 168 | 0.1 | 119 | 0.1 | 265 | 0.1 | 150 | 0.1 | ||
| 89. Miscellaneous manufactured articles,n.e.s. | 1,670 | 0.8 | 4,111 | 2.6 | 1,605 | 0.5 | 2,095 | 1.0 | ||
| 9. Goods not classified elsewhere | 1,904 | 0.9 | 23,344 | 14.8 | 182,674 | 60.2 | 41,390 | 20.6 | ||
| In Total | 213,949 | 100.0 | 157,661 | 100.0 | 303,638 | 100.0 | 200,597 | 100.0 | ||