
| European countries' export and import of goods | SITC |
Data:Eurostat

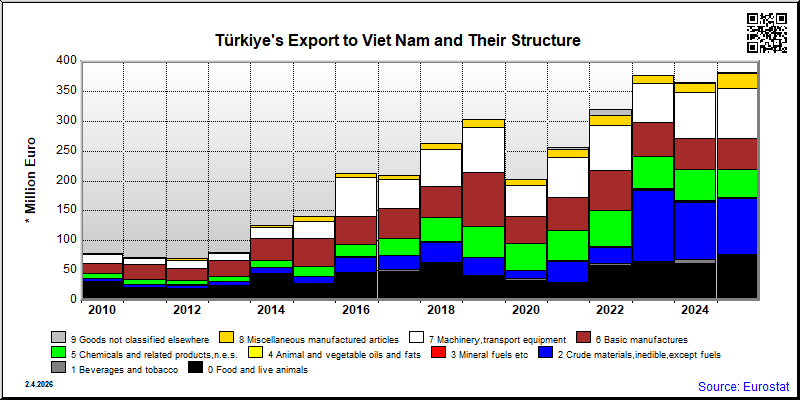
| 2021 | 2022 | 2023 | 2024 | 2025 | ||||||
|---|---|---|---|---|---|---|---|---|---|---|
| 1.000 € | % | 1.000 € | % | 1.000 € | % | 1.000 € | % | 1.000 € | % | |
| 0. Food and live animals | 29,713 | 11.6 | 58,800 | 18.4 | 63,431 | 16.8 | 61,694 | 16.9 | 76,444 | 20.0 |
| 03. Fish and fish preparations | 10,757 | 4.2 | 35,657 | 11.2 | 37,274 | 9.9 | 24,938 | 6.8 | 35,012 | 9.2 |
| 04. Cereals and cereal preparations | 2,518 | 1.0 | 1,585 | 0.5 | 1,333 | 0.4 | 2,047 | 0.6 | 3,237 | 0.8 |
| 05. Vegetables and fruit | 1,484 | 0.6 | 2,181 | 0.7 | 2,155 | 0.6 | 2,134 | 0.6 | 779 | 0.2 |
| 06. Sugars,sugar preparations and honey | 4,610 | 1.8 | 12,108 | 3.8 | 5,337 | 1.4 | 4,547 | 1.2 | 4,750 | 1.2 |
| 07. Coffee,tea,cocoa,spices | 1,436 | 0.6 | 1,762 | 0.6 | 3,173 | 0.8 | 8,535 | 2.3 | 4,479 | 1.2 |
| 08. Feeding stuff for animals | 542 | 0.2 | 961 | 0.3 | 1,651 | 0.4 | 1,754 | 0.5 | 1,440 | 0.4 |
| 09. Miscellaneous edible products and preparations | 719 | 0.3 | 973 | 0.3 | 1,684 | 0.4 | 1,390 | 0.4 | 925 | 0.2 |
| 1. Beverages and tobacco | 1,219 | 0.5 | 3,891 | 1.2 | 2,594 | 0.7 | 7,133 | 2.0 | 968 | 0.3 |
| 11. Beverages | 100 | 0.0 | 219 | 0.1 | 137 | 0.0 | 41 | 0.0 | 57 | 0.0 |
| 2. Crude materials,inedible,except fuels | 35,126 | 13.7 | 26,216 | 8.2 | 118,567 | 31.4 | 95,972 | 26.3 | 92,842 | 24.3 |
| 23. Crude rubber (incl.synthetic) | 29 | 0.0 | 13 | 0.0 | 1 | 0.0 | ||||
| 24. Cork and wood | 33 | 0.0 | 35 | 0.0 | ||||||
| 26. Textile fibres and their wastes | 4,904 | 1.9 | 4,792 | 1.5 | 94,447 | 25.0 | 42,985 | 11.8 | 50,033 | 13.1 |
| 27. Crude fertilizers and crude minerals | 8,710 | 3.4 | 10,670 | 3.3 | 6,788 | 1.8 | 9,785 | 2.7 | 9,360 | 2.5 |
| 28. Metalliferous ores and metal scrap | 6,491 | 2.5 | 6,426 | 2.0 | 3,855 | 1.0 | 17,271 | 4.7 | 9,295 | 2.4 |
| 29. Crude animal,vegetable materials n.e.s. | 14,377 | 5.6 | 4,325 | 1.4 | 12,906 | 3.4 | 25,823 | 7.1 | 24,152 | 6.3 |
| 3. Mineral fuels etc | 1,489 | 0.4 | 664 | 0.2 | ||||||
| 32. Coal,coke and briquettes | ||||||||||
| 4. Animal and vegetable oils and fats | 717 | 0.3 | 781 | 0.2 | 952 | 0.3 | 2,304 | 0.6 | 1,039 | 0.3 |
| 42. Fixed vegetable fats and oils | 711 | 0.3 | 781 | 0.2 | 952 | 0.3 | 2,303 | 0.6 | 881 | 0.2 |
| 5. Chemicals and related products,n.e.s. | 49,899 | 19.5 | 60,184 | 18.8 | 54,270 | 14.4 | 51,992 | 14.3 | 47,844 | 12.5 |
| 51. Organic chemicals | 240 | 0.1 | 303 | 0.1 | 316 | 0.1 | 369 | 0.1 | 295 | 0.1 |
| 52. Inorganic chemicals | 16,527 | 6.4 | 21,969 | 6.9 | 18,726 | 5.0 | 11,386 | 3.1 | 11,859 | 3.1 |
| 53. Dyeing,tanning and colouring material | 2,351 | 0.9 | 3,624 | 1.1 | 3,152 | 0.8 | 3,675 | 1.0 | 4,091 | 1.1 |
| 54. Medicinal and pharmaceutical products | 15,373 | 6.0 | 17,371 | 5.4 | 15,566 | 4.1 | 14,082 | 3.9 | 12,580 | 3.3 |
| 55. Perfume,cleaning etc.preparations | 778 | 0.3 | 2,306 | 0.7 | 3,130 | 0.8 | 2,975 | 0.8 | 2,427 | 0.6 |
| 56. Fertilizers,manufactured | 1,451 | 0.4 | 3,186 | 0.9 | 2,390 | 0.6 | ||||
| 57. Plastics in primary forms | 3,771 | 1.5 | 3,337 | 1.0 | 2,676 | 0.7 | 2,697 | 0.7 | 2,205 | 0.6 |
| 58. Plastics in non-primary forms | 2,901 | 1.1 | 2,856 | 0.9 | 1,982 | 0.5 | 1,188 | 0.3 | 1,199 | 0.3 |
| 59. Chemical materials and products,n.e.s. | 7,311 | 2.9 | 7,776 | 2.4 | 3,865 | 1.0 | 4,756 | 1.3 | 5,600 | 1.5 |
| 6. Basic manufactures | 54,909 | 21.4 | 67,065 | 21.0 | 55,979 | 14.8 | 50,731 | 13.9 | 51,396 | 13.5 |
| 61. Leather,dressed fur,etc. | 4,725 | 1.8 | 6,128 | 1.9 | 6,315 | 1.7 | 3,631 | 1.0 | 5,478 | 1.4 |
| 62. Rubber manufactures,n.e.s. | 1,311 | 0.5 | 973 | 0.3 | 846 | 0.2 | 760 | 0.2 | 666 | 0.2 |
| 63. Wood and cork manufactures | 1,269 | 0.5 | 1,477 | 0.5 | 647 | 0.2 | 406 | 0.1 | 288 | 0.1 |
| 64. Paper,paperboard and articles thereof | 531 | 0.2 | 89 | 0.0 | 150 | 0.0 | 225 | 0.1 | 195 | 0.1 |
| 65. Textile yarn,fabrics,made up articles,etc. | 40,002 | 15.6 | 49,163 | 15.4 | 39,950 | 10.6 | 38,957 | 10.7 | 33,830 | 8.9 |
| 66. Non-metallic mineral manufactures,n.e.s. | 4,056 | 1.6 | 5,609 | 1.8 | 3,390 | 0.9 | 3,621 | 1.0 | 3,131 | 0.8 |
| 67. Iron and steel | 605 | 0.2 | 1,262 | 0.4 | 1,995 | 0.5 | 405 | 0.1 | 1,132 | 0.3 |
| 68. Non-ferrous metals | 187 | 0.1 | 279 | 0.1 | 699 | 0.2 | 308 | 0.1 | 340 | 0.1 |
| 69. Manufactures of metals,n.e.s. | 2,223 | 0.9 | 2,084 | 0.7 | 1,987 | 0.5 | 2,411 | 0.7 | 6,336 | 1.7 |
| 7. Machinery,transport equipment | 68,068 | 26.5 | 75,240 | 23.5 | 66,636 | 17.7 | 77,027 | 21.1 | 84,688 | 22.2 |
| 71. Power generating machinery and equipment | 17,778 | 6.9 | 1,722 | 0.5 | 1,855 | 0.5 | 1,470 | 0.4 | 1,500 | 0.4 |
| 72. Machinery for specialized industries | 13,446 | 5.2 | 15,594 | 4.9 | 13,007 | 3.4 | 15,178 | 4.2 | 18,544 | 4.9 |
| 73. Metal working machinery | 2,078 | 0.8 | 1,766 | 0.6 | 2,005 | 0.5 | 981 | 0.3 | 9,206 | 2.4 |
| 74. General industrial machinery n.e.s. | 9,872 | 3.8 | 11,206 | 3.5 | 10,229 | 2.7 | 9,925 | 2.7 | 18,851 | 4.9 |
| 75. Office machines and adp machines | 301 | 0.1 | 17 | 0.0 | 294 | 0.1 | 569 | 0.2 | 594 | 0.2 |
| 76. Telecommunications and sound recording equipment | 499 | 0.2 | 3,656 | 1.1 | 1,323 | 0.4 | 1,465 | 0.4 | 557 | 0.1 |
| 77. Electric machinery,n.e.s.and parts | 17,326 | 6.8 | 26,927 | 8.4 | 17,003 | 4.5 | 24,576 | 6.7 | 20,951 | 5.5 |
| 78. Road vehicles | 6,735 | 2.6 | 14,292 | 4.5 | 20,556 | 5.5 | 22,603 | 6.2 | 13,994 | 3.7 |
| 79. Other transport equipment | 31 | 0.0 | 58 | 0.0 | 363 | 0.1 | 261 | 0.1 | 490 | 0.1 |
| 8. Miscellaneous manufactured articles | 12,292 | 4.8 | 17,400 | 5.4 | 12,110 | 3.2 | 15,798 | 4.3 | 25,011 | 6.6 |
| 81. Prefabr.buildings;sanitary,lighting etc.fixtrs | 204 | 0.1 | 136 | 0.0 | 85 | 0.0 | 152 | 0.0 | 33 | 0.0 |
| 82. Furniture and parts thereof | 342 | 0.1 | 391 | 0.1 | 268 | 0.1 | 252 | 0.1 | 259 | 0.1 |
| 83. Travel goods,handbags and sim.containers | 35 | 0.0 | 87 | 0.0 | 38 | 0.0 | 9 | 0.0 | 193 | 0.1 |
| 84. Articles of apparel and clothing accessories | 668 | 0.3 | 766 | 0.2 | 731 | 0.2 | 741 | 0.2 | 866 | 0.2 |
| 85. Footwear | 5 | 0.0 | 3 | 0.0 | 17 | 0.0 | 39 | 0.0 | 28 | 0.0 |
| 87. Instruments and apparates n.e.s. | 3,827 | 1.5 | 2,648 | 0.8 | 3,066 | 0.8 | 4,238 | 1.2 | 7,803 | 2.0 |
| 88. Photographic equipment,optical goods etc. | 59 | 0.0 | 17 | 0.0 | 21 | 0.0 | 15 | 0.0 | 43 | 0.0 |
| 89. Miscellaneous manufactured articles,n.e.s. | 7,152 | 2.8 | 13,354 | 4.2 | 7,884 | 2.1 | 7,545 | 2.1 | 6,894 | 1.8 |
| In Total | 256,468 | 100.0 | 319,721 | 100.0 | 377,092 | 100.0 | 364,355 | 100.0 | 381,496 | 100.0 |
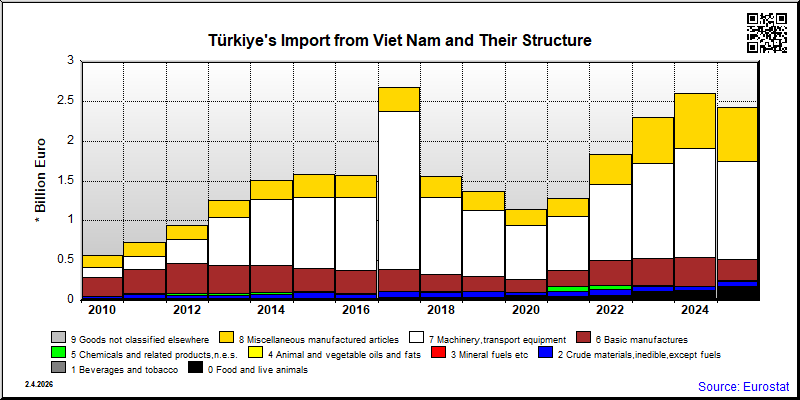
| 2021 | 2022 | 2023 | 2024 | 2025 | ||||||
|---|---|---|---|---|---|---|---|---|---|---|
| 1.000 € | % | 1.000 € | % | 1.000 € | % | 1.000 € | % | 1.000 € | % | |
| 0. Food and live animals | 45,665 | 3.6 | 57,054 | 3.1 | 117,079 | 5.1 | 123,033 | 4.7 | 181,832 | 7.5 |
| 03. Fish and fish preparations | 1,619 | 0.1 | 4,364 | 0.2 | 2,392 | 0.1 | 1,104 | 0.0 | 1,120 | 0.0 |
| 04. Cereals and cereal preparations | 1,085 | 0.1 | 380 | 0.0 | 17,953 | 0.8 | 449 | 0.0 | 420 | 0.0 |
| 05. Vegetables and fruit | 29,969 | 2.3 | 41,480 | 2.3 | 74,099 | 3.2 | 104,583 | 4.0 | 160,557 | 6.6 |
| 06. Sugars,sugar preparations and honey | 5 | 0.0 | 22 | 0.0 | 1,579 | 0.1 | 521 | 0.0 | 1,125 | 0.0 |
| 07. Coffee,tea,cocoa,spices | 11,553 | 0.9 | 9,741 | 0.5 | 18,634 | 0.8 | 16,074 | 0.6 | 18,357 | 0.8 |
| 08. Feeding stuff for animals | 1,353 | 0.1 | 878 | 0.0 | 2,167 | 0.1 | 86 | 0.0 | 166 | 0.0 |
| 09. Miscellaneous edible products and preparations | 81 | 0.0 | 189 | 0.0 | 255 | 0.0 | 216 | 0.0 | 88 | 0.0 |
| 1. Beverages and tobacco | 30 | 0.0 | 36 | 0.0 | 88 | 0.0 | 41 | 0.0 | 64 | 0.0 |
| 11. Beverages | 30 | 0.0 | 36 | 0.0 | 87 | 0.0 | 41 | 0.0 | 64 | 0.0 |
| 2. Crude materials,inedible,except fuels | 61,777 | 4.8 | 82,210 | 4.5 | 55,719 | 2.4 | 47,240 | 1.8 | 56,251 | 2.3 |
| 23. Crude rubber (incl.synthetic) | 54,961 | 4.3 | 67,309 | 3.7 | 34,251 | 1.5 | 39,525 | 1.5 | 43,574 | 1.8 |
| 24. Cork and wood | 571 | 0.0 | 486 | 0.0 | 556 | 0.0 | ||||
| 26. Textile fibres and their wastes | 4,843 | 0.4 | 11,194 | 0.6 | 7,592 | 0.3 | 5,462 | 0.2 | 6,555 | 0.3 |
| 27. Crude fertilizers and crude minerals | 444 | 0.0 | 1,965 | 0.1 | 2,761 | 0.1 | 485 | 0.0 | 53 | 0.0 |
| 28. Metalliferous ores and metal scrap | 820 | 0.0 | 9,410 | 0.4 | 390 | 0.0 | 504 | 0.0 | ||
| 29. Crude animal,vegetable materials n.e.s. | 958 | 0.1 | 436 | 0.0 | 1,207 | 0.1 | 822 | 0.0 | 3,599 | 0.1 |
| 3. Mineral fuels etc | 79 | 0.0 | 70 | 0.0 | ||||||
| 32. Coal,coke and briquettes | ||||||||||
| 4. Animal and vegetable oils and fats | 120 | 0.0 | 88 | 0.0 | 83 | 0.0 | 50 | 0.0 | 67 | 0.0 |
| 42. Fixed vegetable fats and oils | 120 | 0.0 | 88 | 0.0 | 83 | 0.0 | 50 | 0.0 | 67 | 0.0 |
| 5. Chemicals and related products,n.e.s. | 62,267 | 4.9 | 48,543 | 2.6 | 10,918 | 0.5 | 9,233 | 0.4 | 11,021 | 0.5 |
| 51. Organic chemicals | 2 | 0.0 | 776 | 0.0 | 23 | 0.0 | 33 | 0.0 | 63 | 0.0 |
| 52. Inorganic chemicals | 138 | 0.0 | 249 | 0.0 | 170 | 0.0 | 42 | 0.0 | 221 | 0.0 |
| 53. Dyeing,tanning and colouring material | 5 | 0.0 | 123 | 0.0 | 62 | 0.0 | 53 | 0.0 | 1,515 | 0.1 |
| 54. Medicinal and pharmaceutical products | 414 | 0.0 | 711 | 0.0 | 1,109 | 0.0 | 478 | 0.0 | 312 | 0.0 |
| 55. Perfume,cleaning etc.preparations | 557 | 0.0 | 730 | 0.0 | 188 | 0.0 | 63 | 0.0 | 340 | 0.0 |
| 56. Fertilizers,manufactured | 35 | 0.0 | 26 | 0.0 | ||||||
| 57. Plastics in primary forms | 56,635 | 4.4 | 38,834 | 2.1 | 3,839 | 0.2 | 2,433 | 0.1 | 1,371 | 0.1 |
| 58. Plastics in non-primary forms | 3,461 | 0.3 | 3,699 | 0.2 | 1,587 | 0.1 | 1,764 | 0.1 | 1,458 | 0.1 |
| 59. Chemical materials and products,n.e.s. | 1,055 | 0.1 | 3,421 | 0.2 | 3,906 | 0.2 | 4,367 | 0.2 | 5,714 | 0.2 |
| 6. Basic manufactures | 200,443 | 15.7 | 317,650 | 17.3 | 338,260 | 14.7 | 355,388 | 13.7 | 261,654 | 10.8 |
| 61. Leather,dressed fur,etc. | 106 | 0.0 | 648 | 0.0 | 309 | 0.0 | 168 | 0.0 | 149 | 0.0 |
| 62. Rubber manufactures,n.e.s. | 9,571 | 0.7 | 11,468 | 0.6 | 11,458 | 0.5 | 14,537 | 0.6 | 12,804 | 0.5 |
| 63. Wood and cork manufactures | 1,225 | 0.1 | 2,387 | 0.1 | 9,984 | 0.4 | 4,996 | 0.2 | 4,430 | 0.2 |
| 64. Paper,paperboard and articles thereof | 4,984 | 0.4 | 5,718 | 0.3 | 1,947 | 0.1 | 2,057 | 0.1 | 1,086 | 0.0 |
| 65. Textile yarn,fabrics,made up articles,etc. | 88,668 | 6.9 | 132,752 | 7.2 | 54,079 | 2.4 | 39,521 | 1.5 | 42,737 | 1.8 |
| 66. Non-metallic mineral manufactures,n.e.s. | 4,637 | 0.4 | 36,630 | 2.0 | 55,821 | 2.4 | 52,471 | 2.0 | 26,944 | 1.1 |
| 67. Iron and steel | 24,004 | 1.9 | 13,471 | 0.7 | 77,970 | 3.4 | 162,386 | 6.3 | 112,522 | 4.6 |
| 68. Non-ferrous metals | 50,338 | 3.9 | 89,763 | 4.9 | 99,976 | 4.4 | 53,440 | 2.1 | 37,806 | 1.6 |
| 69. Manufactures of metals,n.e.s. | 16,911 | 1.3 | 24,813 | 1.4 | 26,716 | 1.2 | 25,812 | 1.0 | 23,176 | 1.0 |
| 7. Machinery,transport equipment | 686,682 | 53.6 | 949,188 | 51.7 | 1,196,224 | 52.1 | 1,375,655 | 53.0 | 1,230,346 | 50.7 |
| 71. Power generating machinery and equipment | 9,848 | 0.8 | 8,209 | 0.4 | 19,636 | 0.9 | 20,663 | 0.8 | 9,193 | 0.4 |
| 72. Machinery for specialized industries | 19,572 | 1.5 | 24,133 | 1.3 | 20,351 | 0.9 | 22,847 | 0.9 | 21,004 | 0.9 |
| 73. Metal working machinery | 20 | 0.0 | 147 | 0.0 | 11 | 0.0 | 548 | 0.0 | 6,111 | 0.3 |
| 74. General industrial machinery n.e.s. | 13,012 | 1.0 | 15,935 | 0.9 | 17,757 | 0.8 | 24,482 | 0.9 | 24,427 | 1.0 |
| 75. Office machines and adp machines | 69,861 | 5.5 | 98,554 | 5.4 | 171,733 | 7.5 | 316,256 | 12.2 | 281,798 | 11.6 |
| 76. Telecommunications and sound recording equipment | 413,352 | 32.3 | 461,152 | 25.1 | 647,270 | 28.2 | 650,193 | 25.0 | 680,941 | 28.0 |
| 77. Electric machinery,n.e.s.and parts | 114,242 | 8.9 | 270,267 | 14.7 | 215,241 | 9.4 | 165,610 | 6.4 | 140,580 | 5.8 |
| 78. Road vehicles | 46,618 | 3.6 | 70,255 | 3.8 | 103,855 | 4.5 | 173,276 | 6.7 | 66,063 | 2.7 |
| 79. Other transport equipment | 156 | 0.0 | 537 | 0.0 | 371 | 0.0 | 1,780 | 0.1 | 228 | 0.0 |
| 8. Miscellaneous manufactured articles | 223,148 | 17.4 | 380,203 | 20.7 | 577,428 | 25.2 | 687,106 | 26.4 | 686,375 | 28.3 |
| 81. Prefabr.buildings;sanitary,lighting etc.fixtrs | 667 | 0.1 | 701 | 0.0 | 825 | 0.0 | 1,184 | 0.0 | 1,592 | 0.1 |
| 82. Furniture and parts thereof | 6,515 | 0.5 | 8,380 | 0.5 | 11,644 | 0.5 | 8,444 | 0.3 | 8,786 | 0.4 |
| 83. Travel goods,handbags and sim.containers | 5,323 | 0.4 | 10,022 | 0.5 | 15,666 | 0.7 | 18,727 | 0.7 | 19,148 | 0.8 |
| 84. Articles of apparel and clothing accessories | 58,605 | 4.6 | 108,790 | 5.9 | 149,312 | 6.5 | 166,554 | 6.4 | 188,649 | 7.8 |
| 85. Footwear | 110,638 | 8.6 | 196,954 | 10.7 | 332,913 | 14.5 | 411,557 | 15.8 | 381,639 | 15.7 |
| 87. Instruments and apparates n.e.s. | 18,402 | 1.4 | 21,689 | 1.2 | 27,851 | 1.2 | 40,512 | 1.6 | 37,815 | 1.6 |
| 88. Photographic equipment,optical goods etc. | 2,084 | 0.2 | 2,627 | 0.1 | 2,365 | 0.1 | 3,108 | 0.1 | 3,575 | 0.1 |
| 89. Miscellaneous manufactured articles,n.e.s. | 20,913 | 1.6 | 31,041 | 1.7 | 36,852 | 1.6 | 37,020 | 1.4 | 45,170 | 1.9 |
| In Total | 1,280,132 | 100.0 | 1,834,971 | 100.0 | 2,295,878 | 100.0 | 2,597,816 | 100.0 | 2,427,610 | 100.0 |