
| European countries' export and import of goods | SITC |
Data:Eurostat


| 2021 | 2022 | 2023 | 2024 | 2025 | ||||||
|---|---|---|---|---|---|---|---|---|---|---|
| 1.000 € | % | 1.000 € | % | 1.000 € | % | 1.000 € | % | 1.000 € | % | |
| 0. Food and live animals | 6,958 | 3.8 | 116,882 | 12.7 | 285,549 | 12.9 | 362,999 | 11.7 | 365,387 | 13.1 |
| 01. Meat and meat preparations | 38 | 0.0 | 26 | 0.0 | 116 | 0.0 | 1,422 | 0.0 | 1,845 | 0.1 |
| 02. Dairy products and birds' eggs | 66 | 0.0 | 2,517 | 0.3 | 15,734 | 0.7 | 21,523 | 0.7 | 24,646 | 0.9 |
| 04. Cereals and cereal preparations | 2,053 | 1.1 | 35,680 | 3.9 | 79,511 | 3.6 | 85,276 | 2.8 | 118,709 | 4.3 |
| 05. Vegetables and fruit | 1,812 | 1.0 | 52,292 | 5.7 | 101,745 | 4.6 | 122,779 | 4.0 | 89,453 | 3.2 |
| 06. Sugars,sugar preparations and honey | 164 | 0.1 | 3,454 | 0.4 | 16,211 | 0.7 | 22,331 | 0.7 | 21,467 | 0.8 |
| 07. Coffee,tea,cocoa,spices | 399 | 0.2 | 16,323 | 1.8 | 51,192 | 2.3 | 70,985 | 2.3 | 67,840 | 2.4 |
| 08. Feeding stuff for animals | 142 | 0.1 | 1,377 | 0.1 | 4,994 | 0.2 | 9,300 | 0.3 | 12,464 | 0.4 |
| 09. Miscellaneous edible products and preparations | 1,082 | 0.6 | 5,213 | 0.6 | 15,892 | 0.7 | 29,313 | 0.9 | 28,620 | 1.0 |
| 1. Beverages and tobacco | 18 | 0.0 | 344 | 0.0 | 1,579 | 0.1 | 2,012 | 0.1 | 3,534 | 0.1 |
| 11. Beverages | 17 | 0.0 | 343 | 0.0 | 1,455 | 0.1 | 1,601 | 0.1 | 2,057 | 0.1 |
| 12. Tobacco and tobacco manufactures | 1 | 0.0 | 411 | 0.0 | ||||||
| 2. Crude materials,inedible,except fuels | 3,126 | 1.7 | 10,464 | 1.1 | 15,463 | 0.7 | 17,849 | 0.6 | 19,232 | 0.7 |
| 23. Crude rubber (incl.synthetic) | 19 | 0.0 | 22 | 0.0 | 37 | 0.0 | 245 | 0.0 | 91 | 0.0 |
| 25. Pulp and waste paper | ||||||||||
| 26. Textile fibres and their wastes | 1 | 0.0 | 576 | 0.1 | 1,586 | 0.1 | 1,986 | 0.1 | 1,123 | 0.0 |
| 27. Crude fertilizers and crude minerals | 2,863 | 1.6 | 7,977 | 0.9 | 7,823 | 0.4 | 9,956 | 0.3 | 8,530 | 0.3 |
| 28. Metalliferous ores and metal scrap | 119 | 0.0 | 917 | 0.0 | 326 | 0.0 | 3,296 | 0.1 | ||
| 29. Crude animal,vegetable materials n.e.s. | 50 | 0.0 | 724 | 0.1 | 1,257 | 0.1 | 2,679 | 0.1 | ||
| 3. Mineral fuels etc | 44,682 | 24.7 | 61,868 | 6.7 | 5,417 | 0.2 | 36,640 | 1.2 | 10,534 | 0.4 |
| 33. Petroleum and products | 44,682 | 24.7 | 61,431 | 6.7 | 5,404 | 0.2 | 36,371 | 1.2 | 10,506 | 0.4 |
| 4. Animal and vegetable oils and fats | 3,892 | 2.2 | 22,962 | 2.5 | 57,457 | 2.6 | 67,661 | 2.2 | 88,704 | 3.2 |
| 42. Fixed vegetable fats and oils | 3,890 | 2.2 | 22,912 | 2.5 | 57,087 | 2.6 | 66,911 | 2.2 | 88,355 | 3.2 |
| 5. Chemicals and related products,n.e.s. | 4,453 | 2.5 | 48,914 | 5.3 | 173,742 | 7.9 | 208,290 | 6.7 | 199,102 | 7.1 |
| 51. Organic chemicals | 97 | 0.1 | 269 | 0.0 | 2,036 | 0.1 | 3,504 | 0.1 | 5,016 | 0.2 |
| 52. Inorganic chemicals | 81 | 0.0 | 10,948 | 1.2 | 47,345 | 2.1 | 45,292 | 1.5 | 35,558 | 1.3 |
| 53. Dyeing,tanning and colouring material | 231 | 0.1 | 3,729 | 0.4 | 8,477 | 0.4 | 10,429 | 0.3 | 11,239 | 0.4 |
| 54. Medicinal and pharmaceutical products | 561 | 0.3 | 1,459 | 0.2 | 2,098 | 0.1 | 4,789 | 0.2 | 5,797 | 0.2 |
| 55. Perfume,cleaning etc.preparations | 2,441 | 1.3 | 13,746 | 1.5 | 46,160 | 2.1 | 68,964 | 2.2 | 72,130 | 2.6 |
| 56. Fertilizers,manufactured | 40 | 0.0 | 21 | 0.0 | 1,605 | 0.1 | 1,776 | 0.1 | 2,017 | 0.1 |
| 57. Plastics in primary forms | 141 | 0.1 | 3,187 | 0.3 | 17,183 | 0.8 | 12,591 | 0.4 | 7,440 | 0.3 |
| 58. Plastics in non-primary forms | 493 | 0.3 | 6,543 | 0.7 | 21,874 | 1.0 | 25,923 | 0.8 | 24,934 | 0.9 |
| 59. Chemical materials and products,n.e.s. | 370 | 0.2 | 9,012 | 1.0 | 24,840 | 1.1 | 33,207 | 1.1 | 33,176 | 1.2 |
| 6. Basic manufactures | 37,895 | 21.0 | 328,129 | 35.7 | 693,048 | 31.3 | 839,028 | 27.1 | 807,729 | 29.0 |
| 61. Leather,dressed fur,etc. | 7 | 0.0 | 57 | 0.0 | 41 | 0.0 | 102 | 0.0 | 52 | 0.0 |
| 62. Rubber manufactures,n.e.s. | 1,518 | 0.8 | 8,738 | 0.9 | 24,287 | 1.1 | 22,562 | 0.7 | 21,061 | 0.8 |
| 63. Wood and cork manufactures | 770 | 0.4 | 6,800 | 0.7 | 21,415 | 1.0 | 21,202 | 0.7 | 22,317 | 0.8 |
| 64. Paper,paperboard and articles thereof | 236 | 0.1 | 2,840 | 0.3 | 20,703 | 0.9 | 36,336 | 1.2 | 27,454 | 1.0 |
| 65. Textile yarn,fabrics,made up articles,etc. | 2,466 | 1.4 | 142,647 | 15.5 | 300,702 | 13.6 | 327,553 | 10.6 | 317,756 | 11.4 |
| 66. Non-metallic mineral manufactures,n.e.s. | 3,122 | 1.7 | 90,104 | 9.8 | 133,956 | 6.1 | 154,564 | 5.0 | 129,709 | 4.7 |
| 67. Iron and steel | 14,413 | 8.0 | 25,202 | 2.7 | 59,621 | 2.7 | 69,236 | 2.2 | 81,856 | 2.9 |
| 68. Non-ferrous metals | 422 | 0.2 | 1,840 | 0.2 | 5,345 | 0.2 | 15,372 | 0.5 | 14,620 | 0.5 |
| 69. Manufactures of metals,n.e.s. | 14,941 | 8.3 | 49,901 | 5.4 | 126,978 | 5.7 | 192,101 | 6.2 | 192,904 | 6.9 |
| 7. Machinery,transport equipment | 54,040 | 29.9 | 167,043 | 18.2 | 456,808 | 20.6 | 763,891 | 24.6 | 708,196 | 25.4 |
| 71. Power generating machinery and equipment | 1,000 | 0.6 | 5,976 | 0.6 | 16,674 | 0.8 | 25,790 | 0.8 | 33,812 | 1.2 |
| 72. Machinery for specialized industries | 4,462 | 2.5 | 28,607 | 3.1 | 61,526 | 2.8 | 82,400 | 2.7 | 83,010 | 3.0 |
| 73. Metal working machinery | 1,707 | 0.9 | 13,725 | 1.5 | 34,356 | 1.6 | 28,614 | 0.9 | 55,760 | 2.0 |
| 74. General industrial machinery n.e.s. | 18,245 | 10.1 | 40,417 | 4.4 | 135,330 | 6.1 | 166,109 | 5.4 | 151,486 | 5.4 |
| 75. Office machines and adp machines | 199 | 0.1 | 406 | 0.0 | 2,596 | 0.1 | 7,685 | 0.2 | 2,309 | 0.1 |
| 76. Telecommunications and sound recording equipment | 523 | 0.3 | 5,722 | 0.6 | 10,366 | 0.5 | 30,016 | 1.0 | 6,127 | 0.2 |
| 77. Electric machinery,n.e.s.and parts | 23,444 | 13.0 | 45,985 | 5.0 | 118,172 | 5.3 | 249,656 | 8.1 | 187,657 | 6.7 |
| 78. Road vehicles | 2,716 | 1.5 | 21,964 | 2.4 | 70,507 | 3.2 | 162,134 | 5.2 | 162,783 | 5.8 |
| 79. Other transport equipment | 1,744 | 1.0 | 4,242 | 0.5 | 7,281 | 0.3 | 11,486 | 0.4 | 25,248 | 0.9 |
| 8. Miscellaneous manufactured articles | 25,028 | 13.8 | 158,408 | 17.2 | 523,159 | 23.6 | 797,798 | 25.7 | 579,574 | 20.8 |
| 81. Prefabr.buildings;sanitary,lighting etc.fixtrs | 917 | 0.5 | 2,295 | 0.2 | 61,451 | 2.8 | 27,274 | 0.9 | 27,033 | 1.0 |
| 82. Furniture and parts thereof | 4,114 | 2.3 | 38,176 | 4.1 | 95,431 | 4.3 | 98,708 | 3.2 | 82,500 | 3.0 |
| 83. Travel goods,handbags and sim.containers | 438 | 0.2 | 660 | 0.1 | 2,964 | 0.1 | 25,194 | 0.8 | 9,310 | 0.3 |
| 84. Articles of apparel and clothing accessories | 12,272 | 6.8 | 62,293 | 6.8 | 164,660 | 7.4 | 291,968 | 9.4 | 174,331 | 6.3 |
| 85. Footwear | 1,863 | 1.0 | 9,842 | 1.1 | 30,633 | 1.4 | 108,335 | 3.5 | 42,284 | 1.5 |
| 87. Instruments and apparates n.e.s. | 2,718 | 1.5 | 5,643 | 0.6 | 9,534 | 0.4 | 15,666 | 0.5 | 42,834 | 1.5 |
| 88. Photographic equipment,optical goods etc. | 57 | 0.0 | 887 | 0.1 | 1,406 | 0.1 | 10,050 | 0.3 | 4,384 | 0.2 |
| 89. Miscellaneous manufactured articles,n.e.s. | 2,649 | 1.5 | 38,613 | 4.2 | 141,829 | 6.4 | 216,242 | 7.0 | 133,015 | 4.8 |
| 9. Goods not classified elsewhere | 718 | 0.4 | 5,328 | 0.6 | 13 | 0.0 | 3,132 | 0.1 | 5,340 | 0.2 |
| 97. Gold,non-monetary | 3 | 0.0 | ||||||||
| In Total | 180,810 | 100.0 | 920,342 | 100.0 | 2,212,235 | 100.0 | 3,099,300 | 100.0 | 2,787,333 | 100.0 |
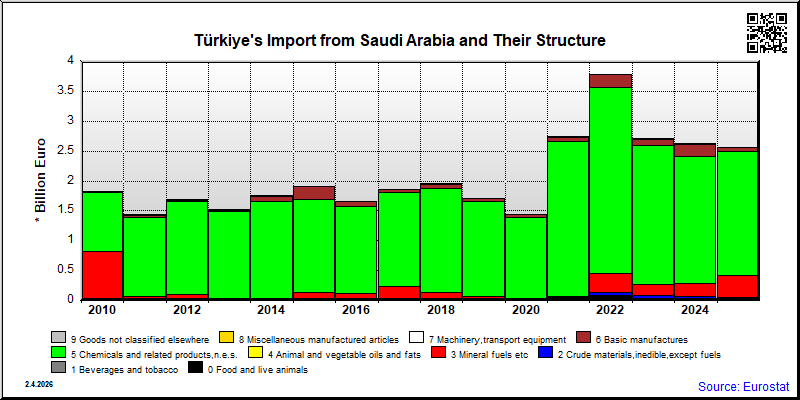
| 2021 | 2022 | 2023 | 2024 | 2025 | ||||||
|---|---|---|---|---|---|---|---|---|---|---|
| 1.000 € | % | 1.000 € | % | 1.000 € | % | 1.000 € | % | 1.000 € | % | |
| 0. Food and live animals | 13,624 | 0.5 | 80,862 | 2.1 | 18,063 | 0.7 | 14,944 | 0.6 | 17,631 | 0.7 |
| 01. Meat and meat preparations | 1,134 | 0.0 | ||||||||
| 02. Dairy products and birds' eggs | 586 | 0.0 | 490 | 0.0 | 690 | 0.0 | ||||
| 04. Cereals and cereal preparations | 186 | 0.0 | 1 | 0.0 | 1 | 0.0 | 1 | 0.0 | 1 | 0.0 |
| 05. Vegetables and fruit | 10,415 | 0.4 | 9,961 | 0.3 | 12,446 | 0.5 | 13,282 | 0.5 | 15,557 | 0.6 |
| 06. Sugars,sugar preparations and honey | 31 | 0.0 | 69,930 | 1.8 | 4,472 | 0.2 | 23 | 0.0 | ||
| 07. Coffee,tea,cocoa,spices | 977 | 0.0 | 366 | 0.0 | 980 | 0.0 | 1,412 | 0.1 | 1,196 | 0.0 |
| 08. Feeding stuff for animals | 1 | 0.0 | 1 | 0.0 | ||||||
| 09. Miscellaneous edible products and preparations | 295 | 0.0 | 112 | 0.0 | 164 | 0.0 | 226 | 0.0 | 187 | 0.0 |
| 1. Beverages and tobacco | 70 | 0.0 | 20 | 0.0 | 70 | 0.0 | 57 | 0.0 | 283 | 0.0 |
| 11. Beverages | 68 | 0.0 | 20 | 0.0 | 70 | 0.0 | 57 | 0.0 | 283 | 0.0 |
| 12. Tobacco and tobacco manufactures | 2 | 0.0 | ||||||||
| 2. Crude materials,inedible,except fuels | 30,229 | 1.1 | 54,911 | 1.5 | 65,342 | 2.4 | 49,595 | 1.9 | 40,621 | 1.6 |
| 23. Crude rubber (incl.synthetic) | 22,313 | 0.8 | 48,118 | 1.3 | 60,759 | 2.2 | 43,827 | 1.7 | 35,233 | 1.4 |
| 25. Pulp and waste paper | 176 | 0.0 | ||||||||
| 26. Textile fibres and their wastes | 914 | 0.0 | 573 | 0.0 | 334 | 0.0 | 820 | 0.0 | 1,095 | 0.0 |
| 27. Crude fertilizers and crude minerals | 37 | 0.0 | 71 | 0.0 | 1 | 0.0 | 5 | 0.0 | 1,761 | 0.1 |
| 28. Metalliferous ores and metal scrap | 6,964 | 0.3 | 6,148 | 0.2 | 4,072 | 0.2 | 4,943 | 0.2 | 2,531 | 0.1 |
| 29. Crude animal,vegetable materials n.e.s. | 1 | 0.0 | ||||||||
| 3. Mineral fuels etc | 24,106 | 0.9 | 309,678 | 8.2 | 177,375 | 6.6 | 215,934 | 8.2 | 365,858 | 14.3 |
| 33. Petroleum and products | 24,106 | 0.9 | 309,678 | 8.2 | 177,375 | 6.6 | 215,934 | 8.2 | 365,858 | 14.3 |
| 4. Animal and vegetable oils and fats | 70 | 0.0 | 75 | 0.0 | 42 | 0.0 | 194 | 0.0 | ||
| 42. Fixed vegetable fats and oils | 70 | 0.0 | 75 | 0.0 | 42 | 0.0 | 194 | 0.0 | ||
| 5. Chemicals and related products,n.e.s. | 2,585,878 | 94.3 | 3,125,609 | 82.6 | 2,325,787 | 85.9 | 2,129,020 | 81.0 | 2,068,079 | 80.7 |
| 51. Organic chemicals | 524,350 | 19.1 | 684,287 | 18.1 | 594,737 | 22.0 | 513,043 | 19.5 | 542,014 | 21.1 |
| 52. Inorganic chemicals | 22,260 | 0.8 | 96,832 | 2.6 | 24,110 | 0.9 | 4,282 | 0.2 | 18,403 | 0.7 |
| 53. Dyeing,tanning and colouring material | 14,117 | 0.5 | 20,117 | 0.5 | 14,262 | 0.5 | 8,793 | 0.3 | 12,379 | 0.5 |
| 54. Medicinal and pharmaceutical products | 177 | 0.0 | 105 | 0.0 | 8 | 0.0 | 5 | 0.0 | 1 | 0.0 |
| 55. Perfume,cleaning etc.preparations | 1,174 | 0.0 | 464 | 0.0 | 2,610 | 0.1 | 2,373 | 0.1 | 4,522 | 0.2 |
| 56. Fertilizers,manufactured | 3,351 | 0.1 | 248 | 0.0 | 22,577 | 0.8 | 14,048 | 0.5 | 3,178 | 0.1 |
| 57. Plastics in primary forms | 2,007,188 | 73.2 | 2,300,422 | 60.8 | 1,649,094 | 60.9 | 1,555,663 | 59.2 | 1,459,329 | 56.9 |
| 58. Plastics in non-primary forms | 7,307 | 0.3 | 15,648 | 0.4 | 5,412 | 0.2 | 7,084 | 0.3 | 8,098 | 0.3 |
| 59. Chemical materials and products,n.e.s. | 5,955 | 0.2 | 7,485 | 0.2 | 12,978 | 0.5 | 23,729 | 0.9 | 20,155 | 0.8 |
| 6. Basic manufactures | 81,488 | 3.0 | 208,828 | 5.5 | 110,646 | 4.1 | 203,318 | 7.7 | 65,123 | 2.5 |
| 61. Leather,dressed fur,etc. | 724 | 0.0 | 755 | 0.0 | 478 | 0.0 | 713 | 0.0 | 745 | 0.0 |
| 62. Rubber manufactures,n.e.s. | 139 | 0.0 | 3 | 0.0 | 12 | 0.0 | 2 | 0.0 | 5 | 0.0 |
| 63. Wood and cork manufactures | 24 | 0.0 | 14 | 0.0 | 6 | 0.0 | ||||
| 64. Paper,paperboard and articles thereof | 117 | 0.0 | 56 | 0.0 | 32 | 0.0 | 22 | 0.0 | 443 | 0.0 |
| 65. Textile yarn,fabrics,made up articles,etc. | 6,560 | 0.2 | 5,130 | 0.1 | 6,308 | 0.2 | 7,450 | 0.3 | 7,084 | 0.3 |
| 66. Non-metallic mineral manufactures,n.e.s. | 2,425 | 0.1 | 2,088 | 0.1 | 3,647 | 0.1 | 1,494 | 0.1 | 3,151 | 0.1 |
| 67. Iron and steel | 24,627 | 0.9 | 123,201 | 3.3 | 51,542 | 1.9 | 134,294 | 5.1 | 453 | 0.0 |
| 68. Non-ferrous metals | 42,484 | 1.6 | 73,669 | 1.9 | 41,224 | 1.5 | 52,120 | 2.0 | 43,610 | 1.7 |
| 69. Manufactures of metals,n.e.s. | 4,388 | 0.2 | 3,924 | 0.1 | 7,401 | 0.3 | 7,209 | 0.3 | 9,626 | 0.4 |
| 7. Machinery,transport equipment | 2,600 | 0.1 | 1,371 | 0.0 | 1,046 | 0.0 | 6,063 | 0.2 | 2,750 | 0.1 |
| 71. Power generating machinery and equipment | 213 | 0.0 | 357 | 0.0 | 230 | 0.0 | 4,027 | 0.2 | 34 | 0.0 |
| 72. Machinery for specialized industries | 625 | 0.0 | 72 | 0.0 | 22 | 0.0 | 334 | 0.0 | 138 | 0.0 |
| 73. Metal working machinery | 107 | 0.0 | 42 | 0.0 | 98 | 0.0 | 11 | 0.0 | 290 | 0.0 |
| 74. General industrial machinery n.e.s. | 747 | 0.0 | 751 | 0.0 | 457 | 0.0 | 732 | 0.0 | 599 | 0.0 |
| 75. Office machines and adp machines | 31 | 0.0 | 26 | 0.0 | 70 | 0.0 | 135 | 0.0 | ||
| 76. Telecommunications and sound recording equipment | 17 | 0.0 | 2 | 0.0 | 12 | 0.0 | 30 | 0.0 | 75 | 0.0 |
| 77. Electric machinery,n.e.s.and parts | 785 | 0.0 | 102 | 0.0 | 134 | 0.0 | 837 | 0.0 | 1,017 | 0.0 |
| 78. Road vehicles | 76 | 0.0 | 11 | 0.0 | 91 | 0.0 | 20 | 0.0 | 459 | 0.0 |
| 79. Other transport equipment | 7 | 0.0 | 1 | 0.0 | 1 | 0.0 | 1 | 0.0 | ||
| 8. Miscellaneous manufactured articles | 2,698 | 0.1 | 1,236 | 0.0 | 1,600 | 0.1 | 7,923 | 0.3 | 768 | 0.0 |
| 81. Prefabr.buildings;sanitary,lighting etc.fixtrs | 277 | 0.0 | 5 | 0.0 | 1 | 0.0 | 6 | 0.0 | 4 | 0.0 |
| 82. Furniture and parts thereof | 194 | 0.0 | 63 | 0.0 | 2 | 0.0 | 3 | 0.0 | 78 | 0.0 |
| 83. Travel goods,handbags and sim.containers | 45 | 0.0 | 46 | 0.0 | 18 | 0.0 | 7 | 0.0 | 7 | 0.0 |
| 84. Articles of apparel and clothing accessories | 1,448 | 0.1 | 646 | 0.0 | 555 | 0.0 | 3,136 | 0.1 | 75 | 0.0 |
| 85. Footwear | 229 | 0.0 | 96 | 0.0 | 125 | 0.0 | 23 | 0.0 | 30 | 0.0 |
| 87. Instruments and apparates n.e.s. | 120 | 0.0 | 23 | 0.0 | 38 | 0.0 | 274 | 0.0 | 35 | 0.0 |
| 88. Photographic equipment,optical goods etc. | 9 | 0.0 | 11 | 0.0 | 11 | 0.0 | 2 | 0.0 | 21 | 0.0 |
| 89. Miscellaneous manufactured articles,n.e.s. | 378 | 0.0 | 346 | 0.0 | 849 | 0.0 | 4,019 | 0.2 | 517 | 0.0 |
| 9. Goods not classified elsewhere | 1,548 | 0.0 | 6,339 | 0.2 | 2,781 | 0.1 | 2,244 | 0.1 | ||
| 97. Gold,non-monetary | 2,781 | 0.1 | 2,244 | 0.1 | ||||||
| In Total | 2,740,764 | 100.0 | 3,784,137 | 100.0 | 2,706,269 | 100.0 | 2,629,679 | 100.0 | 2,563,550 | 100.0 |