
| European countries' export and import of goods | SITC |
Data:Eurostat
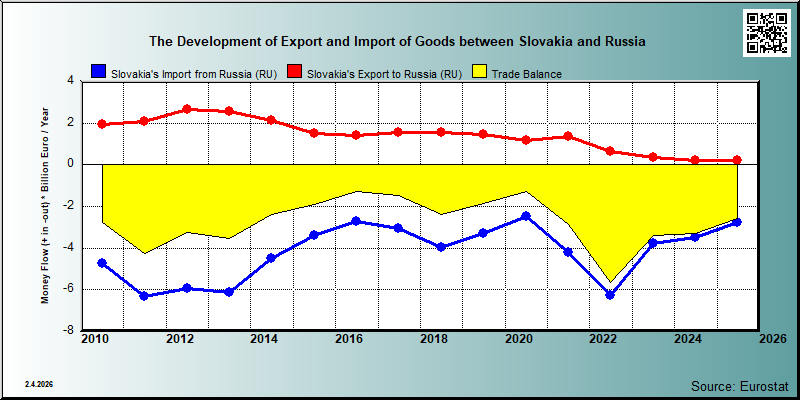

| 2021 | 2022 | 2023 | 2024 | 2025 | ||||||
|---|---|---|---|---|---|---|---|---|---|---|
| 1.000 € | % | 1.000 € | % | 1.000 € | % | 1.000 € | % | 1.000 € | % | |
| 0. Food and live animals | 27,853 | 2.1 | 34,728 | 5.6 | 28,225 | 7.7 | 35,733 | 16.3 | 49,022 | 24.7 |
| 00. Live animals | 2,401 | 0.2 | 284 | 0.1 | ||||||
| 02. Dairy products and birds' eggs | 3,767 | 0.3 | 14,648 | 4.0 | ||||||
| 03. Fish and fish preparations | ||||||||||
| 04. Cereals and cereal preparations | 2,435 | 0.2 | 2,606 | 0.4 | 1,062 | 0.3 | 682 | 0.3 | 817 | 0.4 |
| 05. Vegetables and fruit | 2 | 0.0 | 88 | 0.0 | ||||||
| 06. Sugars,sugar preparations and honey | 682 | 0.1 | 643 | 0.2 | 755 | 0.3 | 1,055 | 0.5 | ||
| 07. Coffee,tea,cocoa,spices | 15,710 | 1.2 | 20,477 | 3.3 | 10,552 | 2.9 | 29,610 | 13.5 | 41,807 | 21.0 |
| 08. Feeding stuff for animals | 2,496 | 0.2 | 449 | 0.1 | ||||||
| 09. Miscellaneous edible products and preparations | 359 | 0.0 | 475 | 0.1 | 274 | 0.1 | 375 | 0.2 | 463 | 0.2 |
| 1. Beverages and tobacco | 1,675 | 0.1 | 732 | 0.1 | 690 | 0.2 | ||||
| 11. Beverages | 1,675 | 0.1 | 732 | 0.1 | 690 | 0.2 | ||||
| 2. Crude materials,inedible,except fuels | 9,960 | 0.7 | 4,702 | 0.8 | 4,913 | 1.3 | 4,629 | 2.1 | 490 | 0.2 |
| 22. Oil seeds,oleaginous fruits | 48 | 0.0 | ||||||||
| 23. Crude rubber (incl.synthetic) | 2,017 | 0.2 | 357 | 0.1 | ||||||
| 24. Cork and wood | ||||||||||
| 25. Pulp and waste paper | 310 | 0.0 | ||||||||
| 26. Textile fibres and their wastes | 973 | 0.1 | 15 | 0.0 | 12 | 0.0 | ||||
| 27. Crude fertilizers and crude minerals | 6,660 | 0.5 | 4,232 | 0.7 | 4,765 | 1.3 | 2,513 | 1.1 | 36 | 0.0 |
| 28. Metalliferous ores and metal scrap | 18 | 0.0 | ||||||||
| 29. Crude animal,vegetable materials n.e.s. | 36 | 0.0 | 131 | 0.0 | 402 | 0.2 | ||||
| 3. Mineral fuels etc | 102 | 0.0 | 819 | 0.1 | 2,585 | 0.7 | 721 | 0.3 | 850 | 0.4 |
| 32. Coal,coke and briquettes | ||||||||||
| 33. Petroleum and products | 102 | 0.0 | 819 | 0.1 | 2,585 | 0.7 | 721 | 0.3 | 850 | 0.4 |
| 34. Gas,natural and manufactured | ||||||||||
| 4. Animal and vegetable oils and fats | ||||||||||
| 42. Fixed vegetable fats and oils | ||||||||||
| 43. Processed animal or vegetable oils,etc. | ||||||||||
| 5. Chemicals and related products,n.e.s. | 57,644 | 4.3 | 48,448 | 7.8 | 42,944 | 11.7 | 42,372 | 19.3 | 32,058 | 16.1 |
| 51. Organic chemicals | 13,311 | 1.0 | 3,532 | 0.6 | 2,419 | 0.7 | 1,779 | 0.8 | 2,508 | 1.3 |
| 52. Inorganic chemicals | 1,162 | 0.1 | 1,326 | 0.2 | 30 | 0.0 | 25 | 0.0 | ||
| 53. Dyeing,tanning and colouring material | 196 | 0.0 | 346 | 0.1 | 23 | 0.0 | 58 | 0.0 | ||
| 54. Medicinal and pharmaceutical products | 11,366 | 0.8 | 11,725 | 1.9 | 13,233 | 3.6 | 12,502 | 5.7 | 11,484 | 5.8 |
| 55. Perfume,cleaning etc.preparations | 16,852 | 1.3 | 15,148 | 2.4 | 21,428 | 5.9 | 21,909 | 10.0 | 16,584 | 8.3 |
| 56. Fertilizers,manufactured | 205 | 0.0 | 1,504 | 0.2 | 172 | 0.0 | 157 | 0.1 | 73 | 0.0 |
| 57. Plastics in primary forms | 5,475 | 0.4 | 3,543 | 0.6 | 1,002 | 0.3 | 213 | 0.1 | ||
| 58. Plastics in non-primary forms | 7,355 | 0.5 | 6,606 | 1.1 | 4,033 | 1.1 | ||||
| 59. Chemical materials and products,n.e.s. | 1,722 | 0.1 | 4,718 | 0.8 | 604 | 0.2 | 3,798 | 1.7 | 416 | 0.2 |
| 6. Basic manufactures | 116,045 | 8.6 | 53,755 | 8.7 | 21,393 | 5.9 | 18,322 | 8.3 | 20,068 | 10.1 |
| 61. Leather,dressed fur,etc. | 1,055 | 0.1 | 836 | 0.1 | ||||||
| 62. Rubber manufactures,n.e.s. | 41,050 | 3.1 | 8,851 | 1.4 | 910 | 0.2 | 992 | 0.5 | 912 | 0.5 |
| 63. Wood and cork manufactures | 919 | 0.1 | 394 | 0.1 | 538 | 0.3 | ||||
| 64. Paper,paperboard and articles thereof | 15,067 | 1.1 | 4,412 | 0.7 | 831 | 0.2 | 613 | 0.3 | 221 | 0.1 |
| 65. Textile yarn,fabrics,made up articles,etc. | 4,586 | 0.3 | 7,523 | 1.2 | 1,551 | 0.4 | 807 | 0.4 | 326 | 0.2 |
| 66. Non-metallic mineral manufactures,n.e.s. | 10,071 | 0.7 | 7,141 | 1.2 | 6,466 | 1.8 | 4,337 | 2.0 | 1,649 | 0.8 |
| 67. Iron and steel | 18,496 | 1.4 | 7,217 | 1.2 | 951 | 0.3 | ||||
| 68. Non-ferrous metals | 572 | 0.0 | 185 | 0.0 | 340 | 0.1 | 62 | 0.0 | 44 | 0.0 |
| 69. Manufactures of metals,n.e.s. | 24,229 | 1.8 | 17,197 | 2.8 | 8,638 | 2.4 | 10,821 | 4.9 | 15,913 | 8.0 |
| 7. Machinery,transport equipment | 974,100 | 72.5 | 331,564 | 53.6 | 199,682 | 54.6 | 66,636 | 30.4 | 60,219 | 30.3 |
| 71. Power generating machinery and equipment | 29,354 | 2.2 | 10,405 | 1.7 | 14,277 | 3.9 | 1,646 | 0.8 | ||
| 72. Machinery for specialized industries | 48,226 | 3.6 | 31,196 | 5.0 | 28,750 | 7.9 | 21,994 | 10.0 | 41,073 | 20.7 |
| 73. Metal working machinery | 5,044 | 0.4 | 5,072 | 0.8 | ||||||
| 74. General industrial machinery n.e.s. | 103,695 | 7.7 | 90,972 | 14.7 | 36,611 | 10.0 | 22,495 | 10.2 | 15,163 | 7.6 |
| 75. Office machines and adp machines | 3,434 | 0.3 | 4,972 | 0.8 | 1,105 | 0.3 | ||||
| 76. Telecommunications and sound recording equipment | 31,016 | 2.3 | 5,209 | 0.8 | 272 | 0.1 | ||||
| 77. Electric machinery,n.e.s.and parts | 61,651 | 4.6 | 43,631 | 7.1 | 7,662 | 2.1 | 2,134 | 1.0 | 3,653 | 1.8 |
| 78. Road vehicles | 685,832 | 51.0 | 140,029 | 22.6 | 110,604 | 30.3 | 18,366 | 8.4 | 330 | 0.2 |
| 79. Other transport equipment | 5,848 | 0.4 | 77 | 0.0 | ||||||
| 8. Miscellaneous manufactured articles | 155,931 | 11.6 | 138,452 | 22.4 | 62,648 | 17.1 | 49,788 | 22.7 | 33,696 | 17.0 |
| 81. Prefabr.buildings;sanitary,lighting etc.fixtrs | 35,924 | 2.7 | 13,510 | 2.2 | 7,139 | 2.0 | 6,660 | 3.0 | 7,934 | 4.0 |
| 82. Furniture and parts thereof | 23,208 | 1.7 | 5,785 | 0.9 | 233 | 0.1 | ||||
| 83. Travel goods,handbags and sim.containers | 148 | 0.0 | 263 | 0.0 | 33 | 0.0 | 225 | 0.1 | 58 | 0.0 |
| 84. Articles of apparel and clothing accessories | 36,904 | 2.7 | 77,564 | 12.5 | 13,573 | 3.7 | 26 | 0.0 | 933 | 0.5 |
| 85. Footwear | 12,518 | 0.9 | 9,169 | 1.5 | 8,960 | 2.5 | ||||
| 87. Instruments and apparates n.e.s. | 27,664 | 2.1 | 20,908 | 3.4 | 23,357 | 6.4 | 20,032 | 9.1 | 13,432 | 6.8 |
| 88. Photographic equipment,optical goods etc. | 2,414 | 0.2 | 128 | 0.0 | 222 | 0.1 | 139 | 0.1 | ||
| 89. Miscellaneous manufactured articles,n.e.s. | 17,150 | 1.3 | 11,125 | 1.8 | 9,353 | 2.6 | 11,159 | 5.1 | 10,998 | 5.5 |
| 9. Goods not classified elsewhere | 26 | 0.0 | 1 | 0.0 | ||||||
| 93. Special transactions and commodities not classified | 20 | 0.0 | ||||||||
| 96. Coin (not gold coin or legal) | 6 | 0.0 | 1 | 0.0 | ||||||
| In Total | 1,343,972 | 100.0 | 618,730 | 100.0 | 365,504 | 100.0 | 219,476 | 100.0 | 198,683 | 100.0 |

| 2021 | 2022 | 2023 | 2024 | 2025 | ||||||
|---|---|---|---|---|---|---|---|---|---|---|
| 1.000 € | % | 1.000 € | % | 1.000 € | % | 1.000 € | % | 1.000 € | % | |
| 0. Food and live animals | 1,709 | 0.0 | 2,472 | 0.0 | 5,035 | 0.1 | 3,366 | 0.1 | 1,422 | 0.1 |
| 00. Live animals | 8 | 0.0 | 4 | 0.0 | ||||||
| 02. Dairy products and birds' eggs | 96 | 0.0 | ||||||||
| 03. Fish and fish preparations | ||||||||||
| 04. Cereals and cereal preparations | 1 | 0.0 | 195 | 0.0 | 6 | 0.0 | 5 | 0.0 | ||
| 05. Vegetables and fruit | 56 | 0.0 | 16 | 0.0 | ||||||
| 06. Sugars,sugar preparations and honey | 709 | 0.0 | 1,799 | 0.1 | 435 | 0.0 | ||||
| 07. Coffee,tea,cocoa,spices | 4 | 0.0 | 2 | 0.0 | 1 | 0.0 | ||||
| 08. Feeding stuff for animals | 193 | 0.0 | 62 | 0.0 | ||||||
| 09. Miscellaneous edible products and preparations | 308 | 0.0 | 496 | 0.0 | 324 | 0.0 | 116 | 0.0 | 61 | 0.0 |
| 1. Beverages and tobacco | 1,620 | 0.0 | 407 | 0.0 | ||||||
| 11. Beverages | 1,620 | 0.0 | 407 | 0.0 | ||||||
| 2. Crude materials,inedible,except fuels | 438,914 | 10.4 | 134,187 | 2.1 | 36,891 | 1.0 | 2,415 | 0.1 | 259 | 0.0 |
| 22. Oil seeds,oleaginous fruits | 130 | 0.0 | ||||||||
| 23. Crude rubber (incl.synthetic) | 56,735 | 1.3 | 48,746 | 0.8 | ||||||
| 24. Cork and wood | ||||||||||
| 25. Pulp and waste paper | 1,097 | 0.0 | ||||||||
| 26. Textile fibres and their wastes | 198 | 0.0 | 143 | 0.0 | 22 | 0.0 | ||||
| 27. Crude fertilizers and crude minerals | 3,706 | 0.1 | 6,378 | 0.1 | 121 | 0.0 | 50 | 0.0 | 143 | 0.0 |
| 28. Metalliferous ores and metal scrap | 31,616 | 0.8 | ||||||||
| 29. Crude animal,vegetable materials n.e.s. | 346 | 0.0 | 968 | 0.0 | 16 | 0.0 | ||||
| 3. Mineral fuels etc | 3,512,952 | 83.4 | 5,938,550 | 95.0 | 3,500,572 | 93.0 | 3,368,861 | 96.1 | 2,614,654 | 93.7 |
| 32. Coal,coke and briquettes | ||||||||||
| 33. Petroleum and products | 2,109,827 | 50.1 | 2,669,658 | 42.7 | 1,943,175 | 51.6 | 1,967,657 | 56.1 | 2,014,779 | 72.2 |
| 34. Gas,natural and manufactured | ||||||||||
| 4. Animal and vegetable oils and fats | 1 | 0.0 | ||||||||
| 42. Fixed vegetable fats and oils | 1 | 0.0 | ||||||||
| 43. Processed animal or vegetable oils,etc. | ||||||||||
| 5. Chemicals and related products,n.e.s. | 75,154 | 1.8 | 44,602 | 0.7 | 11,378 | 0.3 | 6,522 | 0.2 | 5,479 | 0.2 |
| 51. Organic chemicals | 38,471 | 0.9 | 11,791 | 0.2 | 2,260 | 0.1 | 402 | 0.0 | 91 | 0.0 |
| 52. Inorganic chemicals | 22,760 | 0.5 | 19,970 | 0.3 | 8,580 | 0.2 | 2,319 | 0.1 | ||
| 53. Dyeing,tanning and colouring material | 156 | 0.0 | 52 | 0.0 | 4 | 0.0 | ||||
| 54. Medicinal and pharmaceutical products | 3,203 | 0.1 | 1,807 | 0.0 | 1 | 0.0 | 1,363 | 0.0 | 1,323 | 0.0 |
| 55. Perfume,cleaning etc.preparations | 549 | 0.0 | 329 | 0.0 | 175 | 0.0 | 120 | 0.0 | 76 | 0.0 |
| 56. Fertilizers,manufactured | 1,526 | 0.0 | 73 | 0.0 | 168 | 0.0 | 2,265 | 0.1 | 3,816 | 0.1 |
| 57. Plastics in primary forms | 3,087 | 0.1 | 6,994 | 0.1 | 48 | 0.0 | 1 | 0.0 | ||
| 58. Plastics in non-primary forms | 4,497 | 0.1 | 2,042 | 0.0 | 9 | 0.0 | ||||
| 59. Chemical materials and products,n.e.s. | 905 | 0.0 | 1,544 | 0.0 | 135 | 0.0 | 51 | 0.0 | 32 | 0.0 |
| 6. Basic manufactures | 97,178 | 2.3 | 53,340 | 0.9 | 8,819 | 0.2 | 2,051 | 0.1 | 3,968 | 0.1 |
| 61. Leather,dressed fur,etc. | 355 | 0.0 | 332 | 0.0 | ||||||
| 62. Rubber manufactures,n.e.s. | 11,563 | 0.3 | 4,170 | 0.1 | 874 | 0.0 | 940 | 0.0 | 1,130 | 0.0 |
| 63. Wood and cork manufactures | 9,642 | 0.2 | 4,703 | 0.1 | ||||||
| 64. Paper,paperboard and articles thereof | 2,463 | 0.1 | 2,308 | 0.0 | 5 | 0.0 | ||||
| 65. Textile yarn,fabrics,made up articles,etc. | 512 | 0.0 | 603 | 0.0 | 212 | 0.0 | 1 | 0.0 | 64 | 0.0 |
| 66. Non-metallic mineral manufactures,n.e.s. | 6,724 | 0.2 | 4,713 | 0.1 | 224 | 0.0 | 3 | 0.0 | 3 | 0.0 |
| 67. Iron and steel | 45,485 | 1.1 | 16,210 | 0.3 | 149 | 0.0 | ||||
| 68. Non-ferrous metals | 15,703 | 0.4 | 16,950 | 0.3 | 7,119 | 0.2 | 1,007 | 0.0 | 2,629 | 0.1 |
| 69. Manufactures of metals,n.e.s. | 4,732 | 0.1 | 3,353 | 0.1 | 236 | 0.0 | 99 | 0.0 | 141 | 0.0 |
| 7. Machinery,transport equipment | 77,854 | 1.8 | 68,886 | 1.1 | 200,001 | 5.3 | 118,356 | 3.4 | 161,633 | 5.8 |
| 71. Power generating machinery and equipment | 51,054 | 1.2 | 56,949 | 0.9 | 188,546 | 5.0 | 115,152 | 3.3 | ||
| 72. Machinery for specialized industries | 828 | 0.0 | 345 | 0.0 | 48 | 0.0 | 34 | 0.0 | 2 | 0.0 |
| 73. Metal working machinery | 202 | 0.0 | 366 | 0.0 | ||||||
| 74. General industrial machinery n.e.s. | 2,886 | 0.1 | 2,605 | 0.0 | 99 | 0.0 | 352 | 0.0 | 74 | 0.0 |
| 75. Office machines and adp machines | 132 | 0.0 | 61 | 0.0 | 49 | 0.0 | ||||
| 76. Telecommunications and sound recording equipment | 562 | 0.0 | 54 | 0.0 | 455 | 0.0 | ||||
| 77. Electric machinery,n.e.s.and parts | 10,759 | 0.3 | 3,788 | 0.1 | 2,878 | 0.1 | 2,541 | 0.1 | 2,403 | 0.1 |
| 78. Road vehicles | 1,640 | 0.0 | 919 | 0.0 | 3,464 | 0.1 | 222 | 0.0 | 276 | 0.0 |
| 79. Other transport equipment | 9,792 | 0.2 | 3,800 | 0.1 | ||||||
| 8. Miscellaneous manufactured articles | 8,584 | 0.2 | 6,205 | 0.1 | 2,193 | 0.1 | 3,085 | 0.1 | 3,221 | 0.1 |
| 81. Prefabr.buildings;sanitary,lighting etc.fixtrs | 678 | 0.0 | 803 | 0.0 | 1 | 0.0 | 1 | 0.0 | ||
| 82. Furniture and parts thereof | 1,416 | 0.0 | 808 | 0.0 | ||||||
| 83. Travel goods,handbags and sim.containers | 13 | 0.0 | 4 | 0.0 | 1 | 0.0 | ||||
| 84. Articles of apparel and clothing accessories | 115 | 0.0 | 54 | 0.0 | 64 | 0.0 | 3 | 0.0 | 12 | 0.0 |
| 85. Footwear | 8 | 0.0 | 3 | 0.0 | ||||||
| 87. Instruments and apparates n.e.s. | 2,611 | 0.1 | 1,100 | 0.0 | 940 | 0.0 | 2,347 | 0.1 | 2,699 | 0.1 |
| 88. Photographic equipment,optical goods etc. | 81 | 0.0 | 57 | 0.0 | 36 | 0.0 | 12 | 0.0 | 7 | 0.0 |
| 89. Miscellaneous manufactured articles,n.e.s. | 3,662 | 0.1 | 3,375 | 0.1 | 1,152 | 0.0 | 722 | 0.0 | 501 | 0.0 |
| 9. Goods not classified elsewhere | 122 | 0.0 | 3,305 | 0.1 | ||||||
| 93. Special transactions and commodities not classified | 33 | 0.0 | ||||||||
| 96. Coin (not gold coin or legal) | 89 | 0.0 | 3,305 | 0.1 | ||||||
| In Total | 4,214,583 | 100.0 | 6,251,957 | 100.0 | 3,765,228 | 100.0 | 3,505,619 | 100.0 | 2,790,639 | 100.0 |