
| European countries' export and import of goods | SITC |
Data:Eurostat
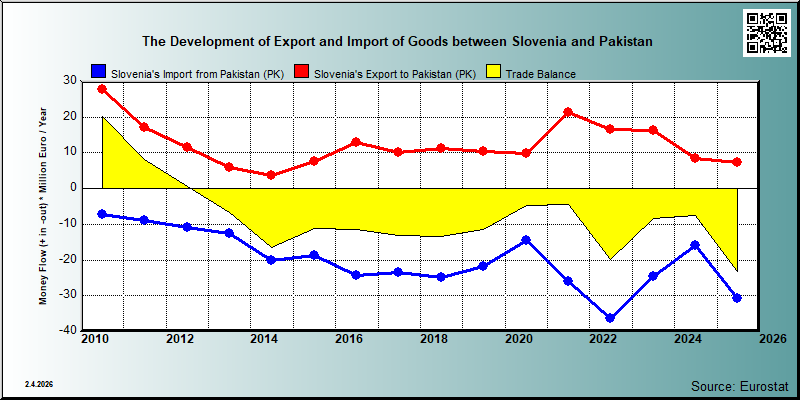

| 2021 | 2022 | 2023 | 2024 | 2025 | ||||||
|---|---|---|---|---|---|---|---|---|---|---|
| 1.000 € | % | 1.000 € | % | 1.000 € | % | 1.000 € | % | 1.000 € | % | |
| 0. Food and live animals | 263 | 1.2 | 660 | 4.0 | 628 | 3.9 | 593 | 6.9 | 1,051 | 14.3 |
| 04. Cereals and cereal preparations | ||||||||||
| 05. Vegetables and fruit | ||||||||||
| 06. Sugars,sugar preparations and honey | ||||||||||
| 1. Beverages and tobacco | ||||||||||
| 12. Tobacco and tobacco manufactures | ||||||||||
| 2. Crude materials,inedible,except fuels | 8,951 | 41.9 | 6,727 | 40.9 | 3,204 | 19.7 | 1,862 | 21.8 | 1,056 | 14.3 |
| 22. Oil seeds,oleaginous fruits | ||||||||||
| 26. Textile fibres and their wastes | 57 | 0.7 | 15 | 0.2 | ||||||
| 27. Crude fertilizers and crude minerals | 13 | 0.1 | 6 | 0.0 | ||||||
| 28. Metalliferous ores and metal scrap | 290 | 1.8 | ||||||||
| 29. Crude animal,vegetable materials n.e.s. | ||||||||||
| 5. Chemicals and related products,n.e.s. | 844 | 3.9 | 786 | 4.8 | 558 | 3.4 | 293 | 3.4 | 541 | 7.3 |
| 53. Dyeing,tanning and colouring material | 45 | 0.2 | 31 | 0.2 | ||||||
| 54. Medicinal and pharmaceutical products | 7 | 0.0 | 182 | 1.1 | 29 | 0.2 | ||||
| 55. Perfume,cleaning etc.preparations | 67 | 0.3 | 80 | 0.5 | 182 | 1.1 | 110 | 1.3 | ||
| 57. Plastics in primary forms | 318 | 1.5 | 142 | 0.9 | 19 | 0.1 | 18 | 0.2 | 47 | 0.6 |
| 59. Chemical materials and products,n.e.s. | 152 | 0.9 | ||||||||
| 6. Basic manufactures | 6,680 | 31.2 | 2,530 | 15.4 | 1,217 | 7.5 | 419 | 4.9 | 325 | 4.4 |
| 61. Leather,dressed fur,etc. | 3 | 0.0 | 21 | 0.1 | 70 | 0.8 | 71 | 1.0 | ||
| 62. Rubber manufactures,n.e.s. | 133 | 0.6 | ||||||||
| 63. Wood and cork manufactures | ||||||||||
| 64. Paper,paperboard and articles thereof | 6,299 | 29.5 | 2,086 | 12.7 | 995 | 6.1 | 15 | 0.2 | 22 | 0.3 |
| 65. Textile yarn,fabrics,made up articles,etc. | 5 | 0.0 | 71 | 0.4 | 19 | 0.1 | 41 | 0.5 | 31 | 0.4 |
| 66. Non-metallic mineral manufactures,n.e.s. | 80 | 0.4 | 49 | 0.3 | 56 | 0.3 | 86 | 1.2 | ||
| 67. Iron and steel | 34 | 0.2 | ||||||||
| 68. Non-ferrous metals | 54 | 0.3 | 25 | 0.2 | ||||||
| 69. Manufactures of metals,n.e.s. | 30 | 0.1 | 233 | 1.4 | 75 | 0.5 | 61 | 0.7 | 15 | 0.2 |
| 7. Machinery,transport equipment | 3,237 | 15.1 | 4,060 | 24.7 | 9,694 | 59.6 | 1,693 | 19.8 | 481 | 6.5 |
| 71. Power generating machinery and equipment | 5 | 0.0 | 3 | 0.0 | 1 | 0.0 | ||||
| 74. General industrial machinery n.e.s. | 607 | 2.8 | 173 | 1.0 | 177 | 1.1 | 278 | 3.3 | 66 | 0.9 |
| 76. Telecommunications and sound recording equipment | 152 | 0.7 | 32 | 0.2 | 70 | 0.4 | 61 | 0.7 | ||
| 77. Electric machinery,n.e.s.and parts | 209 | 1.0 | 2,851 | 17.3 | 8,888 | 54.6 | 204 | 2.4 | 252 | 3.4 |
| 78. Road vehicles | 12 | 0.1 | ||||||||
| 8. Miscellaneous manufactured articles | 1,405 | 6.6 | 1,698 | 10.3 | 968 | 6.0 | 3,696 | 43.2 | 3,916 | 53.1 |
| 81. Prefabr.buildings;sanitary,lighting etc.fixtrs | 3 | 0.0 | ||||||||
| 82. Furniture and parts thereof | 3 | 0.0 | 12 | 0.1 | ||||||
| 83. Travel goods,handbags and sim.containers | ||||||||||
| 84. Articles of apparel and clothing accessories | ||||||||||
| 85. Footwear | ||||||||||
| 87. Instruments and apparates n.e.s. | 1,299 | 6.1 | 1,654 | 10.0 | 942 | 5.8 | 1,330 | 15.5 | 1,463 | 19.8 |
| 88. Photographic equipment,optical goods etc. | 2 | 0.0 | ||||||||
| 89. Miscellaneous manufactured articles,n.e.s. | 103 | 0.5 | 26 | 0.2 | 26 | 0.2 | 2,366 | 27.7 | 2,453 | 33.3 |
| In Total | 21,379 | 100.0 | 16,461 | 100.0 | 16,268 | 100.0 | 8,556 | 100.0 | 7,369 | 100.0 |

| 2021 | 2022 | 2023 | 2024 | 2025 | ||||||
|---|---|---|---|---|---|---|---|---|---|---|
| 1.000 € | % | 1.000 € | % | 1.000 € | % | 1.000 € | % | 1.000 € | % | |
| 0. Food and live animals | 124 | 0.5 | 200 | 0.6 | 124 | 0.5 | 63 | 0.4 | 126 | 0.4 |
| 04. Cereals and cereal preparations | ||||||||||
| 05. Vegetables and fruit | ||||||||||
| 06. Sugars,sugar preparations and honey | ||||||||||
| 1. Beverages and tobacco | ||||||||||
| 12. Tobacco and tobacco manufactures | ||||||||||
| 2. Crude materials,inedible,except fuels | 2,678 | 10.3 | 3,043 | 8.4 | 970 | 3.9 | 911 | 5.7 | 1,465 | 4.8 |
| 22. Oil seeds,oleaginous fruits | ||||||||||
| 26. Textile fibres and their wastes | 191 | 0.7 | 238 | 1.5 | 581 | 1.9 | ||||
| 27. Crude fertilizers and crude minerals | 399 | 1.5 | 991 | 2.7 | ||||||
| 28. Metalliferous ores and metal scrap | 70 | 0.3 | ||||||||
| 29. Crude animal,vegetable materials n.e.s. | ||||||||||
| 5. Chemicals and related products,n.e.s. | 654 | 2.5 | 420 | 1.2 | 3,423 | 13.9 | 50 | 0.3 | 159 | 0.5 |
| 53. Dyeing,tanning and colouring material | 1 | 0.0 | ||||||||
| 54. Medicinal and pharmaceutical products | 1 | 0.0 | ||||||||
| 55. Perfume,cleaning etc.preparations | 1 | 0.0 | 3 | 0.0 | ||||||
| 57. Plastics in primary forms | 650 | 2.5 | 415 | 1.1 | 3,417 | 13.9 | 49 | 0.3 | 159 | 0.5 |
| 59. Chemical materials and products,n.e.s. | 4 | 0.0 | ||||||||
| 6. Basic manufactures | 17,003 | 65.7 | 22,500 | 62.1 | 13,354 | 54.3 | 10,083 | 62.9 | 12,512 | 40.9 |
| 61. Leather,dressed fur,etc. | 38 | 0.1 | 45 | 0.1 | 24 | 0.1 | 23 | 0.1 | ||
| 62. Rubber manufactures,n.e.s. | 1 | 0.0 | ||||||||
| 63. Wood and cork manufactures | 1 | 0.0 | 6 | 0.0 | 1 | 0.0 | ||||
| 64. Paper,paperboard and articles thereof | 86 | 0.3 | 183 | 0.5 | 4 | 0.0 | 4 | 0.0 | ||
| 65. Textile yarn,fabrics,made up articles,etc. | 16,818 | 65.0 | 22,179 | 61.2 | 12,754 | 51.9 | 10,008 | 62.4 | 12,445 | 40.6 |
| 66. Non-metallic mineral manufactures,n.e.s. | 20 | 0.1 | 39 | 0.1 | 19 | 0.1 | 4 | 0.0 | 11 | 0.0 |
| 67. Iron and steel | 406 | 1.6 | ||||||||
| 68. Non-ferrous metals | 118 | 0.5 | ||||||||
| 69. Manufactures of metals,n.e.s. | 39 | 0.2 | 53 | 0.1 | 30 | 0.1 | 36 | 0.2 | 31 | 0.1 |
| 7. Machinery,transport equipment | 182 | 0.7 | 685 | 1.9 | 54 | 0.2 | 150 | 0.9 | 268 | 0.9 |
| 71. Power generating machinery and equipment | 4 | 0.0 | ||||||||
| 74. General industrial machinery n.e.s. | 41 | 0.2 | 681 | 1.9 | 49 | 0.2 | 127 | 0.8 | 253 | 0.8 |
| 76. Telecommunications and sound recording equipment | 3 | 0.0 | 2 | 0.0 | ||||||
| 77. Electric machinery,n.e.s.and parts | 3 | 0.0 | 2 | 0.0 | 1 | 0.0 | ||||
| 78. Road vehicles | 141 | 0.5 | ||||||||
| 8. Miscellaneous manufactured articles | 4,916 | 19.0 | 9,392 | 25.9 | 6,670 | 27.1 | 4,780 | 29.8 | 16,092 | 52.6 |
| 81. Prefabr.buildings;sanitary,lighting etc.fixtrs | 240 | 0.7 | 56 | 0.2 | ||||||
| 82. Furniture and parts thereof | 9 | 0.0 | 5 | 0.0 | ||||||
| 83. Travel goods,handbags and sim.containers | 84 | 0.3 | ||||||||
| 84. Articles of apparel and clothing accessories | 4,105 | 15.9 | 6,843 | 18.9 | 3,838 | 15.6 | 14,975 | 48.9 | ||
| 85. Footwear | ||||||||||
| 87. Instruments and apparates n.e.s. | 7 | 0.0 | 24 | 0.1 | 43 | 0.2 | 33 | 0.2 | 24 | 0.1 |
| 88. Photographic equipment,optical goods etc. | ||||||||||
| 89. Miscellaneous manufactured articles,n.e.s. | 502 | 1.9 | 1,967 | 5.4 | 2,456 | 10.0 | 1,594 | 9.9 | 585 | 1.9 |
| In Total | 25,893 | 100.0 | 36,241 | 100.0 | 24,595 | 100.0 | 16,036 | 100.0 | 30,622 | 100.0 |