
| European countries' export and import of goods | SITC |
Data:Eurostat
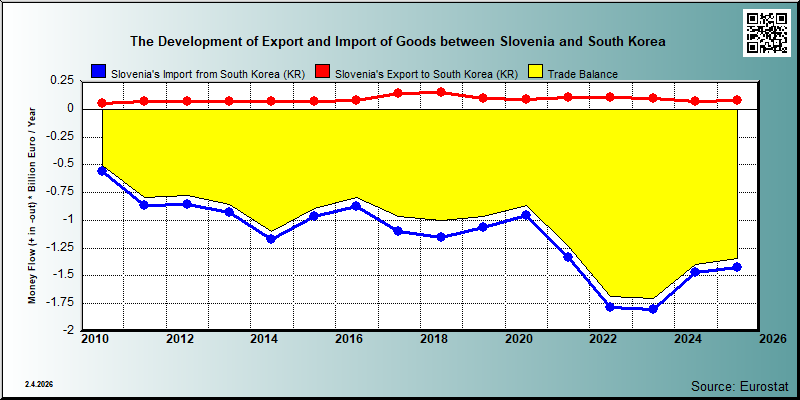
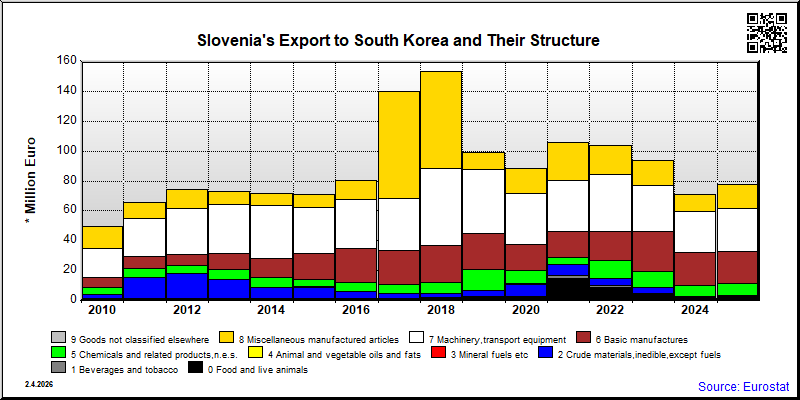
| 2021 | 2022 | 2023 | 2024 | 2025 | ||||||
|---|---|---|---|---|---|---|---|---|---|---|
| 1.000 € | % | 1.000 € | % | 1.000 € | % | 1.000 € | % | 1.000 € | % | |
| 0. Food and live animals | 15,011 | 14.2 | 8,569 | 8.3 | 4,089 | 4.4 | 2,328 | 3.3 | 2,177 | 2.8 |
| 03. Fish and fish preparations | ||||||||||
| 04. Cereals and cereal preparations | 132 | 0.1 | 81 | 0.1 | ||||||
| 05. Vegetables and fruit | 130 | 0.1 | 163 | 0.2 | 180 | 0.2 | 178 | 0.2 | 41 | 0.1 |
| 06. Sugars,sugar preparations and honey | 31 | 0.0 | 27 | 0.0 | 2 | 0.0 | ||||
| 07. Coffee,tea,cocoa,spices | 48 | 0.0 | 322 | 0.3 | ||||||
| 09. Miscellaneous edible products and preparations | 401 | 0.4 | 468 | 0.5 | 718 | 0.8 | 2,074 | 2.9 | 1,951 | 2.5 |
| 1. Beverages and tobacco | 1,685 | 1.6 | 1,549 | 1.5 | 546 | 0.6 | 94 | 0.1 | 694 | 0.9 |
| 11. Beverages | 1,685 | 1.6 | 1,549 | 1.5 | 546 | 0.6 | 94 | 0.1 | 694 | 0.9 |
| 2. Crude materials,inedible,except fuels | 7,265 | 6.9 | 4,369 | 4.2 | 3,873 | 4.1 | 568 | 0.8 | 234 | 0.3 |
| 23. Crude rubber (incl.synthetic) | 6 | 0.0 | 1 | 0.0 | ||||||
| 26. Textile fibres and their wastes | ||||||||||
| 27. Crude fertilizers and crude minerals | 2 | 0.0 | 21 | 0.0 | 22 | 0.0 | 13 | 0.0 | 22 | 0.0 |
| 28. Metalliferous ores and metal scrap | 784 | 0.7 | 98 | 0.1 | ||||||
| 29. Crude animal,vegetable materials n.e.s. | 113 | 0.1 | 78 | 0.1 | 239 | 0.3 | 350 | 0.5 | 172 | 0.2 |
| 3. Mineral fuels etc | 209 | 0.2 | 91 | 0.1 | 1 | 0.0 | ||||
| 33. Petroleum and products | 209 | 0.2 | 91 | 0.1 | 1 | 0.0 | ||||
| 34. Gas,natural and manufactured | ||||||||||
| 4. Animal and vegetable oils and fats | 25 | 0.0 | 49 | 0.0 | 5 | 0.0 | 12 | 0.0 | 19 | 0.0 |
| 42. Fixed vegetable fats and oils | 23 | 0.0 | 47 | 0.0 | 3 | 0.0 | 12 | 0.0 | 19 | 0.0 |
| 5. Chemicals and related products,n.e.s. | 4,898 | 4.6 | 11,914 | 11.5 | 11,144 | 11.9 | 7,243 | 10.2 | 8,003 | 10.3 |
| 51. Organic chemicals | 94 | 0.1 | 231 | 0.2 | 379 | 0.4 | 2,166 | 3.0 | 5,295 | 6.8 |
| 52. Inorganic chemicals | 599 | 0.6 | 647 | 0.6 | 61 | 0.1 | 105 | 0.1 | 160 | 0.2 |
| 53. Dyeing,tanning and colouring material | 76 | 0.1 | 47 | 0.0 | 163 | 0.2 | 172 | 0.2 | 244 | 0.3 |
| 54. Medicinal and pharmaceutical products | 586 | 0.6 | 397 | 0.4 | 545 | 0.6 | 741 | 1.0 | 653 | 0.8 |
| 55. Perfume,cleaning etc.preparations | 136 | 0.1 | 113 | 0.1 | 223 | 0.2 | 306 | 0.4 | 231 | 0.3 |
| 57. Plastics in primary forms | 283 | 0.3 | 1,215 | 1.2 | 361 | 0.4 | 515 | 0.7 | 485 | 0.6 |
| 58. Plastics in non-primary forms | 29 | 0.0 | 43 | 0.0 | 573 | 0.6 | 118 | 0.2 | 80 | 0.1 |
| 59. Chemical materials and products,n.e.s. | 3,095 | 2.9 | 9,222 | 8.9 | 8,839 | 9.4 | 3,119 | 4.4 | 856 | 1.1 |
| 6. Basic manufactures | 17,202 | 16.3 | 19,416 | 18.7 | 26,453 | 28.2 | 22,068 | 31.0 | 21,442 | 27.6 |
| 61. Leather,dressed fur,etc. | 23 | 0.0 | 1 | 0.0 | ||||||
| 62. Rubber manufactures,n.e.s. | 1,161 | 1.1 | 1,845 | 1.8 | 2,101 | 2.2 | 2,301 | 3.2 | 2,556 | 3.3 |
| 63. Wood and cork manufactures | 209 | 0.2 | 90 | 0.1 | 60 | 0.1 | 20 | 0.0 | ||
| 64. Paper,paperboard and articles thereof | 3,914 | 3.7 | 5,085 | 4.9 | 4,319 | 4.6 | 86 | 0.1 | 8 | 0.0 |
| 65. Textile yarn,fabrics,made up articles,etc. | 296 | 0.3 | 391 | 0.4 | 473 | 0.5 | 469 | 0.7 | 773 | 1.0 |
| 66. Non-metallic mineral manufactures,n.e.s. | 175 | 0.2 | 323 | 0.3 | 1,951 | 2.1 | 1,317 | 1.8 | 485 | 0.6 |
| 67. Iron and steel | 5,724 | 5.4 | 7,292 | 7.0 | 12,325 | 13.1 | 15,387 | 21.6 | 15,288 | 19.7 |
| 68. Non-ferrous metals | 1,114 | 1.1 | 699 | 0.7 | 400 | 0.4 | 83 | 0.1 | 259 | 0.3 |
| 69. Manufactures of metals,n.e.s. | 4,586 | 4.3 | 3,488 | 3.4 | 4,793 | 5.1 | 2,364 | 3.3 | 2,053 | 2.6 |
| 7. Machinery,transport equipment | 34,172 | 32.3 | 38,408 | 37.1 | 30,565 | 32.6 | 27,562 | 38.7 | 29,189 | 37.6 |
| 71. Power generating machinery and equipment | 10,942 | 10.4 | 10,281 | 9.9 | 10,189 | 10.9 | 9,629 | 13.5 | 13,367 | 17.2 |
| 72. Machinery for specialized industries | 2,387 | 2.3 | 1,023 | 1.0 | 499 | 0.5 | 1,627 | 2.3 | 1,092 | 1.4 |
| 73. Metal working machinery | 3,620 | 3.4 | 1,582 | 1.5 | 3,161 | 3.4 | 5,411 | 7.6 | 5,658 | 7.3 |
| 74. General industrial machinery n.e.s. | 2,987 | 2.8 | 3,515 | 3.4 | 7,550 | 8.1 | 3,529 | 5.0 | 2,774 | 3.6 |
| 75. Office machines and adp machines | 780 | 0.7 | 943 | 0.9 | 319 | 0.3 | 192 | 0.3 | 54 | 0.1 |
| 76. Telecommunications and sound recording equipment | 700 | 0.7 | 1,145 | 1.1 | 294 | 0.3 | 377 | 0.5 | 148 | 0.2 |
| 77. Electric machinery,n.e.s.and parts | 4,379 | 4.1 | 6,245 | 6.0 | 3,867 | 4.1 | 3,564 | 5.0 | 2,767 | 3.6 |
| 78. Road vehicles | 8,341 | 7.9 | 13,585 | 13.1 | 4,458 | 4.8 | 3,159 | 4.4 | 3,275 | 4.2 |
| 79. Other transport equipment | 36 | 0.0 | 89 | 0.1 | 74 | 0.1 | ||||
| 8. Miscellaneous manufactured articles | 24,994 | 23.7 | 19,208 | 18.5 | 17,078 | 18.2 | 11,393 | 16.0 | 15,942 | 20.5 |
| 81. Prefabr.buildings;sanitary,lighting etc.fixtrs | 52 | 0.0 | 37 | 0.0 | 16 | 0.0 | 57 | 0.1 | 10 | 0.0 |
| 82. Furniture and parts thereof | 1,030 | 1.0 | 1,980 | 1.9 | 1,123 | 1.2 | 594 | 0.8 | 616 | 0.8 |
| 83. Travel goods,handbags and sim.containers | 13 | 0.0 | 52 | 0.1 | 62 | 0.1 | 65 | 0.1 | 158 | 0.2 |
| 84. Articles of apparel and clothing accessories | 612 | 0.6 | 1,185 | 1.1 | 982 | 1.0 | 653 | 0.9 | 662 | 0.9 |
| 85. Footwear | 91 | 0.1 | 92 | 0.1 | 262 | 0.3 | 185 | 0.3 | 188 | 0.2 |
| 87. Instruments and apparates n.e.s. | 9,614 | 9.1 | 10,120 | 9.8 | 6,610 | 7.1 | 7,739 | 10.9 | 9,871 | 12.7 |
| 88. Photographic equipment,optical goods etc. | 24 | 0.0 | 60 | 0.1 | 190 | 0.2 | 55 | 0.1 | 54 | 0.1 |
| 89. Miscellaneous manufactured articles,n.e.s. | 13,559 | 12.8 | 5,680 | 5.5 | 7,834 | 8.4 | 2,046 | 2.9 | 4,382 | 5.6 |
| 9. Goods not classified elsewhere | 22 | 0.0 | ||||||||
| 93. Special transactions and commodities not classified | 19 | 0.0 | ||||||||
| In Total | 105,658 | 100.0 | 103,573 | 100.0 | 93,752 | 100.0 | 71,269 | 100.0 | 77,700 | 100.0 |
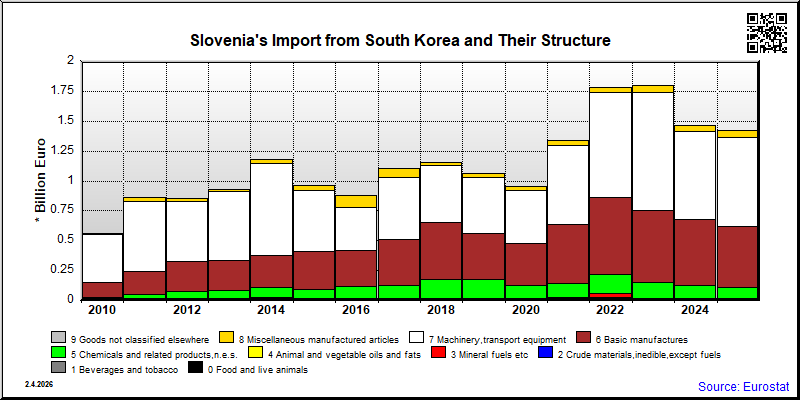
| 2021 | 2022 | 2023 | 2024 | 2025 | ||||||
|---|---|---|---|---|---|---|---|---|---|---|
| 1.000 € | % | 1.000 € | % | 1.000 € | % | 1.000 € | % | 1.000 € | % | |
| 0. Food and live animals | 12,094 | 0.9 | 10,180 | 0.6 | 2,235 | 0.1 | 2,257 | 0.2 | 3,319 | 0.2 |
| 03. Fish and fish preparations | ||||||||||
| 04. Cereals and cereal preparations | 15 | 0.0 | 74 | 0.0 | 42 | 0.0 | ||||
| 05. Vegetables and fruit | 15 | 0.0 | 10 | 0.0 | 249 | 0.0 | 153 | 0.0 | 46 | 0.0 |
| 06. Sugars,sugar preparations and honey | 3 | 0.0 | 4 | 0.0 | 1 | 0.0 | ||||
| 07. Coffee,tea,cocoa,spices | 3 | 0.0 | 7 | 0.0 | ||||||
| 09. Miscellaneous edible products and preparations | 217 | 0.0 | 262 | 0.0 | 448 | 0.0 | 289 | 0.0 | 1,580 | 0.1 |
| 1. Beverages and tobacco | 3,920 | 0.3 | 4,645 | 0.3 | 4,494 | 0.2 | 6,015 | 0.4 | 6,021 | 0.4 |
| 11. Beverages | 3,920 | 0.3 | 4,645 | 0.3 | 4,494 | 0.2 | 6,015 | 0.4 | 6,021 | 0.4 |
| 2. Crude materials,inedible,except fuels | 6,733 | 0.5 | 10,269 | 0.6 | 7,740 | 0.4 | 4,534 | 0.3 | 4,264 | 0.3 |
| 23. Crude rubber (incl.synthetic) | 5,360 | 0.4 | 9,335 | 0.5 | 6,222 | 0.3 | ||||
| 26. Textile fibres and their wastes | ||||||||||
| 27. Crude fertilizers and crude minerals | 3 | 0.0 | 44 | 0.0 | 84 | 0.0 | 17 | 0.0 | ||
| 28. Metalliferous ores and metal scrap | 1 | 0.0 | 4 | 0.0 | ||||||
| 29. Crude animal,vegetable materials n.e.s. | 9 | 0.0 | 6 | 0.0 | 1 | 0.0 | 1 | 0.0 | ||
| 3. Mineral fuels etc | 391 | 0.0 | 34,070 | 1.9 | 880 | 0.0 | 1,053 | 0.1 | ||
| 33. Petroleum and products | 391 | 0.0 | 34,070 | 1.9 | 842 | 0.0 | 1,053 | 0.1 | ||
| 34. Gas,natural and manufactured | ||||||||||
| 4. Animal and vegetable oils and fats | 1 | 0.0 | 5 | 0.0 | 34 | 0.0 | 6 | 0.0 | 4 | 0.0 |
| 42. Fixed vegetable fats and oils | 1 | 0.0 | 5 | 0.0 | 34 | 0.0 | 6 | 0.0 | 4 | 0.0 |
| 5. Chemicals and related products,n.e.s. | 122,038 | 9.1 | 160,005 | 9.0 | 131,245 | 7.3 | 111,844 | 7.6 | 98,256 | 6.9 |
| 51. Organic chemicals | 12,452 | 0.9 | 29,147 | 1.6 | 10,769 | 0.6 | 6,970 | 0.5 | 5,871 | 0.4 |
| 52. Inorganic chemicals | 400 | 0.0 | 465 | 0.0 | 554 | 0.0 | 528 | 0.0 | 614 | 0.0 |
| 53. Dyeing,tanning and colouring material | 2,158 | 0.2 | 1,577 | 0.1 | 2,843 | 0.2 | 1,906 | 0.1 | 3,001 | 0.2 |
| 54. Medicinal and pharmaceutical products | 5,741 | 0.4 | 4,736 | 0.3 | 6,264 | 0.3 | 7,764 | 0.5 | 4,845 | 0.3 |
| 55. Perfume,cleaning etc.preparations | 1,276 | 0.1 | 999 | 0.1 | 3,770 | 0.2 | 1,602 | 0.1 | 2,511 | 0.2 |
| 57. Plastics in primary forms | 71,082 | 5.3 | 90,874 | 5.1 | 76,408 | 4.2 | 68,154 | 4.7 | 63,317 | 4.4 |
| 58. Plastics in non-primary forms | 9,466 | 0.7 | 13,327 | 0.7 | 19,897 | 1.1 | 14,026 | 1.0 | 10,412 | 0.7 |
| 59. Chemical materials and products,n.e.s. | 19,464 | 1.5 | 18,881 | 1.1 | 10,741 | 0.6 | 10,896 | 0.7 | 7,684 | 0.5 |
| 6. Basic manufactures | 490,652 | 36.7 | 644,834 | 36.1 | 604,602 | 33.6 | 554,479 | 37.8 | 506,267 | 35.6 |
| 61. Leather,dressed fur,etc. | 1,083 | 0.1 | 2,749 | 0.2 | 441 | 0.0 | ||||
| 62. Rubber manufactures,n.e.s. | 22,961 | 1.7 | 21,031 | 1.2 | 20,218 | 1.1 | 24,236 | 1.7 | 22,195 | 1.6 |
| 63. Wood and cork manufactures | 4 | 0.0 | 1 | 0.0 | 4 | 0.0 | 4 | 0.0 | ||
| 64. Paper,paperboard and articles thereof | 1,151 | 0.1 | 656 | 0.0 | 747 | 0.0 | 1,540 | 0.1 | 1,617 | 0.1 |
| 65. Textile yarn,fabrics,made up articles,etc. | 15,229 | 1.1 | 14,111 | 0.8 | 9,653 | 0.5 | 8,278 | 0.6 | 6,064 | 0.4 |
| 66. Non-metallic mineral manufactures,n.e.s. | 3,057 | 0.2 | 8,803 | 0.5 | 3,241 | 0.2 | 2,710 | 0.2 | 2,079 | 0.1 |
| 67. Iron and steel | 398,652 | 29.8 | 561,654 | 31.5 | 526,529 | 29.3 | 469,808 | 32.1 | 424,408 | 29.8 |
| 68. Non-ferrous metals | 13,233 | 1.0 | 14,913 | 0.8 | 8,810 | 0.5 | 10,823 | 0.7 | 4,146 | 0.3 |
| 69. Manufactures of metals,n.e.s. | 35,281 | 2.6 | 23,441 | 1.3 | 32,653 | 1.8 | 36,638 | 2.5 | 44,917 | 3.2 |
| 7. Machinery,transport equipment | 662,600 | 49.6 | 879,515 | 49.3 | 989,889 | 55.0 | 732,468 | 50.0 | 742,720 | 52.2 |
| 71. Power generating machinery and equipment | 66,058 | 4.9 | 50,471 | 2.8 | 43,552 | 2.4 | 31,780 | 2.2 | 13,010 | 0.9 |
| 72. Machinery for specialized industries | 21,129 | 1.6 | 29,704 | 1.7 | 56,828 | 3.2 | 83,286 | 5.7 | 72,683 | 5.1 |
| 73. Metal working machinery | 24,485 | 1.8 | 30,424 | 1.7 | 23,312 | 1.3 | 19,893 | 1.4 | 15,543 | 1.1 |
| 74. General industrial machinery n.e.s. | 61,678 | 4.6 | 72,812 | 4.1 | 102,187 | 5.7 | 153,587 | 10.5 | 72,594 | 5.1 |
| 75. Office machines and adp machines | 506 | 0.0 | 937 | 0.1 | 529 | 0.0 | 582 | 0.0 | 699 | 0.0 |
| 76. Telecommunications and sound recording equipment | 5,116 | 0.4 | 6,056 | 0.3 | 5,388 | 0.3 | 4,804 | 0.3 | 5,380 | 0.4 |
| 77. Electric machinery,n.e.s.and parts | 130,058 | 9.7 | 138,149 | 7.7 | 153,989 | 8.6 | 83,869 | 5.7 | 96,095 | 6.8 |
| 78. Road vehicles | 353,568 | 26.5 | 550,960 | 30.9 | 604,103 | 33.6 | 354,666 | 24.2 | 466,715 | 32.8 |
| 79. Other transport equipment | 1 | 0.0 | 2 | 0.0 | ||||||
| 8. Miscellaneous manufactured articles | 37,738 | 2.8 | 40,950 | 2.3 | 58,628 | 3.3 | 52,615 | 3.6 | 61,586 | 4.3 |
| 81. Prefabr.buildings;sanitary,lighting etc.fixtrs | 14 | 0.0 | 12 | 0.0 | 424 | 0.0 | 47 | 0.0 | 19 | 0.0 |
| 82. Furniture and parts thereof | 604 | 0.0 | 2,647 | 0.1 | 4,240 | 0.2 | 2,889 | 0.2 | 539 | 0.0 |
| 83. Travel goods,handbags and sim.containers | 8 | 0.0 | 7 | 0.0 | 16 | 0.0 | 11 | 0.0 | 13 | 0.0 |
| 84. Articles of apparel and clothing accessories | 125 | 0.0 | 233 | 0.0 | 98 | 0.0 | 213 | 0.0 | 160 | 0.0 |
| 85. Footwear | 14 | 0.0 | 18 | 0.0 | 1 | 0.0 | 10 | 0.0 | 23 | 0.0 |
| 87. Instruments and apparates n.e.s. | 13,768 | 1.0 | 7,790 | 0.4 | 16,658 | 0.9 | 15,900 | 1.1 | 27,897 | 2.0 |
| 88. Photographic equipment,optical goods etc. | 254 | 0.0 | 225 | 0.0 | 3,205 | 0.2 | 1,475 | 0.1 | 4,369 | 0.3 |
| 89. Miscellaneous manufactured articles,n.e.s. | 22,950 | 1.7 | 30,017 | 1.7 | 33,986 | 1.9 | 32,070 | 2.2 | 28,566 | 2.0 |
| 9. Goods not classified elsewhere | 9 | 0.0 | ||||||||
| 93. Special transactions and commodities not classified | 9 | 0.0 | ||||||||
| In Total | 1,336,176 | 100.0 | 1,784,473 | 100.0 | 1,799,747 | 100.0 | 1,465,271 | 100.0 | 1,423,359 | 100.0 |