
| European countries' export and import of goods | SITC |
Data:Eurostat
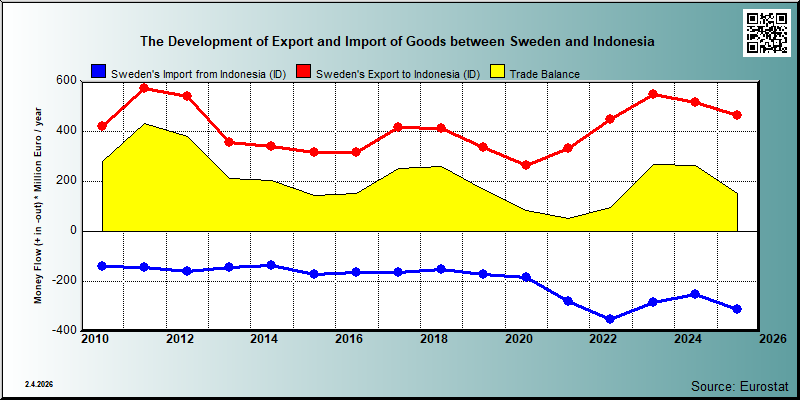
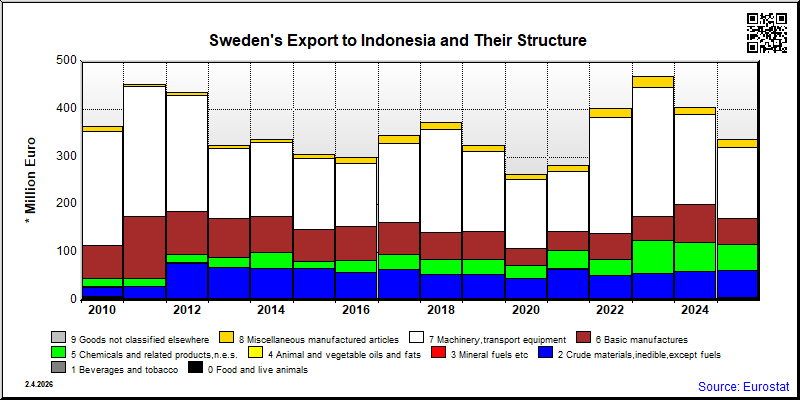
| 2021 | 2022 | 2023 | 2024 | 2025 | ||||||
|---|---|---|---|---|---|---|---|---|---|---|
| 1.000 € | % | 1.000 € | % | 1.000 € | % | 1.000 € | % | 1.000 € | % | |
| 0. Food and live animals | 2,622 | 0.8 | 3,521 | 0.8 | 2,403 | 0.4 | 2,942 | 0.6 | 6,823 | 1.5 |
| 03. Fish and fish preparations | 16 | 0.0 | 26 | 0.0 | 27 | 0.0 | ||||
| 04. Cereals and cereal preparations | 150 | 0.0 | 246 | 0.1 | 341 | 0.1 | 78 | 0.0 | 1,157 | 0.2 |
| 05. Vegetables and fruit | 118 | 0.0 | 126 | 0.0 | 161 | 0.0 | 73 | 0.0 | 71 | 0.0 |
| 06. Sugars,sugar preparations and honey | 5 | 0.0 | 4 | 0.0 | ||||||
| 07. Coffee,tea,cocoa,spices | 210 | 0.1 | 59 | 0.0 | 48 | 0.0 | 23 | 0.0 | 18 | 0.0 |
| 08. Feeding stuff for animals | 123 | 0.0 | 44 | 0.0 | 18 | 0.0 | 34 | 0.0 | 433 | 0.1 |
| 09. Miscellaneous edible products and preparations | 247 | 0.1 | 400 | 0.1 | 344 | 0.1 | 674 | 0.1 | 1,070 | 0.2 |
| 1. Beverages and tobacco | 80 | 0.0 | 1 | 0.0 | 77 | 0.0 | 147 | 0.0 | ||
| 11. Beverages | 79 | 0.0 | 38 | 0.0 | ||||||
| 12. Tobacco and tobacco manufactures | 1 | 0.0 | 1 | 0.0 | 40 | 0.0 | 146 | 0.0 | ||
| 2. Crude materials,inedible,except fuels | 63,166 | 19.1 | 49,251 | 11.0 | 54,921 | 10.0 | 56,967 | 11.0 | 55,698 | 12.0 |
| 22. Oil seeds,oleaginous fruits | ||||||||||
| 24. Cork and wood | 28 | 0.0 | 452 | 0.1 | 205 | 0.0 | 64 | 0.0 | ||
| 25. Pulp and waste paper | 62,944 | 19.0 | 48,674 | 10.9 | 54,565 | 9.9 | 56,930 | 11.0 | 55,278 | 11.9 |
| 26. Textile fibres and their wastes | 8 | 0.0 | 1 | 0.0 | 1 | 0.0 | 3 | 0.0 | ||
| 27. Crude fertilizers and crude minerals | 180 | 0.1 | 83 | 0.0 | 124 | 0.0 | 29 | 0.0 | 47 | 0.0 |
| 28. Metalliferous ores and metal scrap | 5 | 0.0 | 25 | 0.0 | 9 | 0.0 | 4 | 0.0 | 305 | 0.1 |
| 29. Crude animal,vegetable materials n.e.s. | 1 | 0.0 | 16 | 0.0 | ||||||
| 3. Mineral fuels etc | 132 | 0.0 | 121 | 0.0 | 52 | 0.0 | 1 | 0.0 | 5 | 0.0 |
| 33. Petroleum and products | 131 | 0.0 | 121 | 0.0 | 52 | 0.0 | 1 | 0.0 | 5 | 0.0 |
| 4. Animal and vegetable oils and fats | 270 | 0.1 | 90 | 0.0 | 89 | 0.0 | 558 | 0.1 | 853 | 0.2 |
| 42. Fixed vegetable fats and oils | 18 | 0.0 | 19 | 0.0 | 28 | 0.0 | 20 | 0.0 | 13 | 0.0 |
| 43. Processed animal or vegetable oils,etc. | 72 | 0.0 | 61 | 0.0 | 839 | 0.2 | ||||
| 5. Chemicals and related products,n.e.s. | 38,033 | 11.5 | 33,121 | 7.4 | 68,217 | 12.4 | 60,052 | 11.6 | 53,271 | 11.5 |
| 51. Organic chemicals | 721 | 0.2 | 3,867 | 0.9 | 2,465 | 0.4 | 393 | 0.1 | 41 | 0.0 |
| 52. Inorganic chemicals | 660 | 0.2 | 784 | 0.2 | 18 | 0.0 | 227 | 0.0 | 184 | 0.0 |
| 53. Dyeing,tanning and colouring material | 1,293 | 0.4 | 1,246 | 0.3 | 1,273 | 0.2 | 1,162 | 0.2 | 1,129 | 0.2 |
| 54. Medicinal and pharmaceutical products | 9,878 | 3.0 | 13,431 | 3.0 | 17,422 | 3.2 | 21,675 | 4.2 | 15,500 | 3.3 |
| 55. Perfume,cleaning etc.preparations | 1,157 | 0.3 | 429 | 0.1 | 117 | 0.0 | 250 | 0.0 | 162 | 0.0 |
| 57. Plastics in primary forms | 2,352 | 0.7 | 2,819 | 0.6 | 5,311 | 1.0 | 4,037 | 0.8 | 3,347 | 0.7 |
| 58. Plastics in non-primary forms | 117 | 0.0 | 206 | 0.0 | 181 | 0.0 | 354 | 0.1 | 334 | 0.1 |
| 59. Chemical materials and products,n.e.s. | 21,856 | 6.6 | 10,340 | 2.3 | 41,430 | 7.5 | 31,954 | 6.2 | 32,574 | 7.0 |
| 6. Basic manufactures | 40,428 | 12.2 | 54,007 | 12.1 | 50,688 | 9.2 | 81,135 | 15.7 | 54,201 | 11.7 |
| 61. Leather,dressed fur,etc. | 10 | 0.0 | 11 | 0.0 | 3 | 0.0 | 1 | 0.0 | 10 | 0.0 |
| 62. Rubber manufactures,n.e.s. | 1,241 | 0.4 | 3,073 | 0.7 | 1,661 | 0.3 | 1,556 | 0.3 | 1,995 | 0.4 |
| 63. Wood and cork manufactures | 120 | 0.0 | 71 | 0.0 | 55 | 0.0 | 94 | 0.0 | 43 | 0.0 |
| 64. Paper,paperboard and articles thereof | 14,905 | 4.5 | 23,794 | 5.3 | 17,278 | 3.1 | 19,399 | 3.8 | 19,588 | 4.2 |
| 65. Textile yarn,fabrics,made up articles,etc. | 585 | 0.2 | 584 | 0.1 | 307 | 0.1 | 242 | 0.0 | 234 | 0.1 |
| 66. Non-metallic mineral manufactures,n.e.s. | 4,049 | 1.2 | 3,387 | 0.8 | 3,946 | 0.7 | 3,450 | 0.7 | 3,300 | 0.7 |
| 67. Iron and steel | 6,174 | 1.9 | 9,972 | 2.2 | 17,923 | 3.3 | 11,231 | 2.2 | 8,731 | 1.9 |
| 68. Non-ferrous metals | 6,185 | 1.9 | 274 | 0.1 | 216 | 0.0 | 35,208 | 6.8 | 7,172 | 1.5 |
| 69. Manufactures of metals,n.e.s. | 7,159 | 2.2 | 12,843 | 2.9 | 9,298 | 1.7 | 9,954 | 1.9 | 13,128 | 2.8 |
| 7. Machinery,transport equipment | 125,596 | 37.9 | 241,745 | 54.0 | 270,253 | 49.1 | 187,811 | 36.3 | 149,256 | 32.2 |
| 71. Power generating machinery and equipment | 8,457 | 2.6 | 10,978 | 2.5 | 46,365 | 8.4 | 33,266 | 6.4 | 14,361 | 3.1 |
| 72. Machinery for specialized industries | 29,177 | 8.8 | 52,870 | 11.8 | 43,347 | 7.9 | 38,566 | 7.5 | 26,716 | 5.8 |
| 73. Metal working machinery | 863 | 0.3 | 460 | 0.1 | 263 | 0.0 | 675 | 0.1 | 266 | 0.1 |
| 74. General industrial machinery n.e.s. | 32,756 | 9.9 | 37,758 | 8.4 | 55,521 | 10.1 | 38,250 | 7.4 | 25,808 | 5.6 |
| 75. Office machines and adp machines | 1,728 | 0.5 | 1,093 | 0.2 | 5,922 | 1.1 | 1,314 | 0.3 | 6,985 | 1.5 |
| 76. Telecommunications and sound recording equipment | 8,412 | 2.5 | 5,454 | 1.2 | 4,335 | 0.8 | 2,783 | 0.5 | 2,801 | 0.6 |
| 77. Electric machinery,n.e.s.and parts | 13,563 | 4.1 | 33,024 | 7.4 | 27,811 | 5.1 | 26,516 | 5.1 | 18,274 | 3.9 |
| 78. Road vehicles | 30,401 | 9.2 | 100,011 | 22.3 | 86,668 | 15.8 | 45,257 | 8.8 | 53,460 | 11.5 |
| 79. Other transport equipment | 239 | 0.1 | 97 | 0.0 | 21 | 0.0 | 1,184 | 0.2 | 586 | 0.1 |
| 8. Miscellaneous manufactured articles | 11,637 | 3.5 | 19,033 | 4.2 | 21,490 | 3.9 | 14,646 | 2.8 | 16,199 | 3.5 |
| 81. Prefabr.buildings;sanitary,lighting etc.fixtrs | 57 | 0.0 | 58 | 0.0 | 31 | 0.0 | 55 | 0.0 | 25 | 0.0 |
| 82. Furniture and parts thereof | 833 | 0.3 | 158 | 0.0 | 3,514 | 0.6 | 142 | 0.0 | 105 | 0.0 |
| 83. Travel goods,handbags and sim.containers | 103 | 0.0 | 14 | 0.0 | 16 | 0.0 | 20 | 0.0 | 7 | 0.0 |
| 84. Articles of apparel and clothing accessories | 807 | 0.2 | 309 | 0.1 | 971 | 0.2 | 1,252 | 0.2 | 1,167 | 0.3 |
| 85. Footwear | 6 | 0.0 | 17 | 0.0 | 13 | 0.0 | 12 | 0.0 | 30 | 0.0 |
| 87. Instruments and apparates n.e.s. | 5,967 | 1.8 | 13,936 | 3.1 | 12,975 | 2.4 | 10,191 | 2.0 | 11,797 | 2.5 |
| 88. Photographic equipment,optical goods etc. | 219 | 0.1 | 951 | 0.2 | 247 | 0.0 | 215 | 0.0 | 129 | 0.0 |
| 89. Miscellaneous manufactured articles,n.e.s. | 3,645 | 1.1 | 3,591 | 0.8 | 3,722 | 0.7 | 2,760 | 0.5 | 2,939 | 0.6 |
| 9. Goods not classified elsewhere | 17 | 0.0 | 72 | 0.0 | ||||||
| 93. Special transactions and commodities not classified | 17 | 0.0 | ||||||||
| 97. Gold,non-monetary | 72 | 0.0 | ||||||||
| In Total | 331,577 | 100.0 | 448,031 | 100.0 | 549,855 | 100.0 | 517,034 | 100.0 | 463,947 | 100.0 |

| 2021 | 2022 | 2023 | 2024 | 2025 | ||||||
|---|---|---|---|---|---|---|---|---|---|---|
| 1.000 € | % | 1.000 € | % | 1.000 € | % | 1.000 € | % | 1.000 € | % | |
| 0. Food and live animals | 9,767 | 3.5 | 9,824 | 2.8 | 6,801 | 2.4 | 9,188 | 3.6 | 9,847 | 3.2 |
| 03. Fish and fish preparations | 830 | 0.3 | 1,199 | 0.3 | 645 | 0.2 | 1,126 | 0.4 | ||
| 04. Cereals and cereal preparations | 56 | 0.0 | 137 | 0.0 | 40 | 0.0 | 3 | 0.0 | 5 | 0.0 |
| 05. Vegetables and fruit | 1,218 | 0.4 | 1,523 | 0.4 | 916 | 0.3 | 915 | 0.4 | 1,032 | 0.3 |
| 06. Sugars,sugar preparations and honey | 349 | 0.1 | 417 | 0.1 | 141 | 0.0 | 268 | 0.1 | 461 | 0.1 |
| 07. Coffee,tea,cocoa,spices | 2,887 | 1.0 | 3,785 | 1.1 | 2,546 | 0.9 | 3,903 | 1.5 | 3,158 | 1.0 |
| 08. Feeding stuff for animals | 2,839 | 1.0 | ||||||||
| 09. Miscellaneous edible products and preparations | 1,589 | 0.6 | 2,763 | 0.8 | 2,513 | 0.9 | 2,973 | 1.2 | 4,448 | 1.4 |
| 1. Beverages and tobacco | 103 | 0.0 | 1 | 0.0 | 148 | 0.1 | 1 | 0.0 | 144 | 0.0 |
| 11. Beverages | 1 | 0.0 | 1 | 0.0 | ||||||
| 12. Tobacco and tobacco manufactures | 103 | 0.0 | 1 | 0.0 | 148 | 0.1 | 144 | 0.0 | ||
| 2. Crude materials,inedible,except fuels | 2,214 | 0.8 | 3,477 | 1.0 | 1,660 | 0.6 | 5,282 | 2.1 | 11,768 | 3.8 |
| 22. Oil seeds,oleaginous fruits | ||||||||||
| 24. Cork and wood | 1,943 | 0.7 | 3,180 | 0.9 | 1,020 | 0.4 | 1,096 | 0.4 | 1,086 | 0.3 |
| 25. Pulp and waste paper | 4 | 0.0 | 2 | 0.0 | ||||||
| 26. Textile fibres and their wastes | 10 | 0.0 | 4 | 0.0 | 10 | 0.0 | 55 | 0.0 | 12 | 0.0 |
| 27. Crude fertilizers and crude minerals | 21 | 0.0 | ||||||||
| 28. Metalliferous ores and metal scrap | 5 | 0.0 | 148 | 0.0 | 2 | 0.0 | 3,255 | 1.3 | 10,280 | 3.3 |
| 29. Crude animal,vegetable materials n.e.s. | 250 | 0.1 | 121 | 0.0 | 389 | 0.1 | ||||
| 3. Mineral fuels etc | ||||||||||
| 33. Petroleum and products | ||||||||||
| 4. Animal and vegetable oils and fats | 113,996 | 40.8 | 130,245 | 36.8 | 147,252 | 51.9 | 79,197 | 31.3 | 32,841 | 10.5 |
| 42. Fixed vegetable fats and oils | 113,996 | 40.8 | 130,214 | 36.8 | 147,252 | 51.9 | 79,197 | 31.3 | 32,794 | 10.5 |
| 43. Processed animal or vegetable oils,etc. | 31 | 0.0 | 47 | 0.0 | ||||||
| 5. Chemicals and related products,n.e.s. | 6,322 | 2.3 | 19,220 | 5.4 | 7,726 | 2.7 | 3,509 | 1.4 | 2,054 | 0.7 |
| 51. Organic chemicals | 4,756 | 1.7 | 11,008 | 3.1 | 6,172 | 2.2 | 1,660 | 0.7 | 87 | 0.0 |
| 52. Inorganic chemicals | 779 | 0.3 | 6,842 | 1.9 | 573 | 0.2 | 605 | 0.2 | 567 | 0.2 |
| 53. Dyeing,tanning and colouring material | 1 | 0.0 | 525 | 0.1 | 719 | 0.3 | 997 | 0.4 | 1,005 | 0.3 |
| 54. Medicinal and pharmaceutical products | 18 | 0.0 | 16 | 0.0 | 12 | 0.0 | 95 | 0.0 | 4 | 0.0 |
| 55. Perfume,cleaning etc.preparations | 92 | 0.0 | 121 | 0.0 | 49 | 0.0 | 15 | 0.0 | 103 | 0.0 |
| 57. Plastics in primary forms | 51 | 0.0 | 35 | 0.0 | 6 | 0.0 | 10 | 0.0 | 144 | 0.0 |
| 58. Plastics in non-primary forms | 585 | 0.2 | 447 | 0.1 | 148 | 0.1 | 45 | 0.0 | 62 | 0.0 |
| 59. Chemical materials and products,n.e.s. | 42 | 0.0 | 226 | 0.1 | 47 | 0.0 | 81 | 0.0 | 82 | 0.0 |
| 6. Basic manufactures | 24,676 | 8.8 | 25,414 | 7.2 | 16,209 | 5.7 | 15,999 | 6.3 | 146,837 | 47.0 |
| 61. Leather,dressed fur,etc. | 360 | 0.1 | 313 | 0.1 | 266 | 0.1 | 282 | 0.1 | 313 | 0.1 |
| 62. Rubber manufactures,n.e.s. | 7,295 | 2.6 | 7,690 | 2.2 | 4,356 | 1.5 | 6,520 | 2.6 | 5,579 | 1.8 |
| 63. Wood and cork manufactures | 3,804 | 1.4 | 4,284 | 1.2 | 2,323 | 0.8 | 2,299 | 0.9 | 3,321 | 1.1 |
| 64. Paper,paperboard and articles thereof | 176 | 0.1 | 310 | 0.1 | 256 | 0.1 | 414 | 0.2 | 804 | 0.3 |
| 65. Textile yarn,fabrics,made up articles,etc. | 2,030 | 0.7 | 2,235 | 0.6 | 932 | 0.3 | 1,046 | 0.4 | 1,698 | 0.5 |
| 66. Non-metallic mineral manufactures,n.e.s. | 536 | 0.2 | 1,333 | 0.4 | 1,899 | 0.7 | 1,423 | 0.6 | 2,634 | 0.8 |
| 67. Iron and steel | 2,235 | 0.8 | 4,365 | 1.2 | 2,066 | 0.7 | 1,851 | 0.7 | 2,376 | 0.8 |
| 68. Non-ferrous metals | 82 | 0.0 | 561 | 0.2 | 865 | 0.3 | 163 | 0.1 | 7,621 | 2.4 |
| 69. Manufactures of metals,n.e.s. | 8,158 | 2.9 | 4,322 | 1.2 | 3,246 | 1.1 | 2,002 | 0.8 | 122,491 | 39.2 |
| 7. Machinery,transport equipment | 21,719 | 7.8 | 25,009 | 7.1 | 20,246 | 7.1 | 44,889 | 17.7 | 19,889 | 6.4 |
| 71. Power generating machinery and equipment | 24 | 0.0 | 38 | 0.0 | 289 | 0.1 | 681 | 0.3 | 868 | 0.3 |
| 72. Machinery for specialized industries | 129 | 0.0 | 169 | 0.0 | 2,121 | 0.7 | 392 | 0.2 | 1,481 | 0.5 |
| 73. Metal working machinery | 7 | 0.0 | 4 | 0.0 | 5 | 0.0 | 10 | 0.0 | ||
| 74. General industrial machinery n.e.s. | 182 | 0.1 | 774 | 0.2 | 1,686 | 0.6 | 634 | 0.3 | 821 | 0.3 |
| 75. Office machines and adp machines | 539 | 0.2 | 1,016 | 0.3 | 163 | 0.1 | 166 | 0.1 | 174 | 0.1 |
| 76. Telecommunications and sound recording equipment | 2,484 | 0.9 | 2,566 | 0.7 | 4,296 | 1.5 | 6,586 | 2.6 | 4,260 | 1.4 |
| 77. Electric machinery,n.e.s.and parts | 4,441 | 1.6 | 5,919 | 1.7 | 5,253 | 1.9 | 5,767 | 2.3 | 5,566 | 1.8 |
| 78. Road vehicles | 13,894 | 5.0 | 14,520 | 4.1 | 6,400 | 2.3 | 6,536 | 2.6 | 6,632 | 2.1 |
| 79. Other transport equipment | 18 | 0.0 | 4 | 0.0 | 32 | 0.0 | 24,118 | 9.5 | 88 | 0.0 |
| 8. Miscellaneous manufactured articles | 100,248 | 35.9 | 140,743 | 39.8 | 83,564 | 29.5 | 95,057 | 37.6 | 89,105 | 28.5 |
| 81. Prefabr.buildings;sanitary,lighting etc.fixtrs | 519 | 0.2 | 584 | 0.2 | 253 | 0.1 | 225 | 0.1 | 319 | 0.1 |
| 82. Furniture and parts thereof | 19,784 | 7.1 | 26,056 | 7.4 | 8,419 | 3.0 | 8,521 | 3.4 | 10,835 | 3.5 |
| 83. Travel goods,handbags and sim.containers | 657 | 0.2 | 651 | 0.2 | 474 | 0.2 | 1,049 | 0.4 | 794 | 0.3 |
| 84. Articles of apparel and clothing accessories | 51,312 | 18.4 | 76,110 | 21.5 | 45,900 | 16.2 | 53,552 | 21.2 | 43,040 | 13.8 |
| 85. Footwear | 14,899 | 5.3 | 21,574 | 6.1 | 16,998 | 6.0 | 20,294 | 8.0 | 22,234 | 7.1 |
| 87. Instruments and apparates n.e.s. | 1,426 | 0.5 | 1,217 | 0.3 | 1,476 | 0.5 | 1,641 | 0.6 | 1,807 | 0.6 |
| 88. Photographic equipment,optical goods etc. | 33 | 0.0 | 33 | 0.0 | 74 | 0.0 | 26 | 0.0 | 28 | 0.0 |
| 89. Miscellaneous manufactured articles,n.e.s. | 11,619 | 4.2 | 14,519 | 4.1 | 9,970 | 3.5 | 9,748 | 3.9 | 10,048 | 3.2 |
| 9. Goods not classified elsewhere | 25 | 0.0 | 2 | 0.0 | 2 | 0.0 | ||||
| 93. Special transactions and commodities not classified | 25 | 0.0 | ||||||||
| 97. Gold,non-monetary | 2 | 0.0 | 2 | 0.0 | ||||||
| In Total | 279,069 | 100.0 | 353,933 | 100.0 | 283,606 | 100.0 | 253,125 | 100.0 | 312,487 | 100.0 |