
| European countries' export and import of goods | SITC |
Data:Eurostat
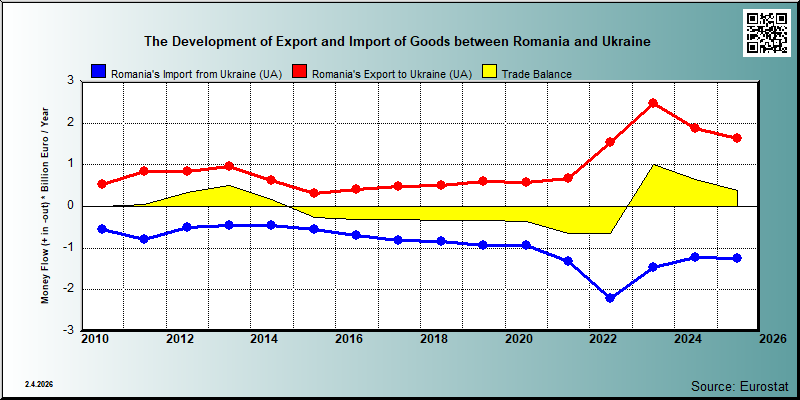

| 2021 | 2022 | 2023 | 2024 | 2025 | ||||||
|---|---|---|---|---|---|---|---|---|---|---|
| 1.000 € | % | 1.000 € | % | 1.000 € | % | 1.000 € | % | 1.000 € | % | |
| 0. Food and live animals | 17,389 | 2.5 | 34,198 | 2.2 | 27,817 | 1.1 | 22,209 | 1.2 | 29,433 | 1.8 |
| 00. Live animals | ||||||||||
| 01. Meat and meat preparations | 53 | 0.0 | 2,387 | 0.2 | 6,263 | 0.3 | 776 | 0.0 | 518 | 0.0 |
| 02. Dairy products and birds' eggs | 1,820 | 0.3 | 359 | 0.0 | 587 | 0.0 | 615 | 0.0 | 498 | 0.0 |
| 03. Fish and fish preparations | 93 | 0.0 | 189 | 0.0 | 608 | 0.0 | ||||
| 04. Cereals and cereal preparations | 11,369 | 1.7 | 10,152 | 0.7 | 8,270 | 0.3 | 12,012 | 0.6 | 18,084 | 1.1 |
| 05. Vegetables and fruit | 1,197 | 0.2 | 18,581 | 1.2 | 8,739 | 0.4 | 2,244 | 0.1 | 1,389 | 0.1 |
| 06. Sugars,sugar preparations and honey | 296 | 0.0 | 169 | 0.0 | 210 | 0.0 | 573 | 0.0 | 1,251 | 0.1 |
| 07. Coffee,tea,cocoa,spices | 877 | 0.1 | 246 | 0.0 | 353 | 0.0 | 1,088 | 0.1 | 968 | 0.1 |
| 08. Feeding stuff for animals | 40 | 0.0 | 349 | 0.0 | 1,437 | 0.1 | 2,863 | 0.2 | 3,957 | 0.2 |
| 09. Miscellaneous edible products and preparations | 1,737 | 0.3 | 1,861 | 0.1 | 1,721 | 0.1 | 1,849 | 0.1 | 2,160 | 0.1 |
| 1. Beverages and tobacco | 25,024 | 3.7 | 11,043 | 0.7 | 6,269 | 0.3 | 23,981 | 1.3 | 86,685 | 5.3 |
| 11. Beverages | 440 | 0.1 | 5,607 | 0.4 | 5,822 | 0.2 | 2,958 | 0.2 | 5,674 | 0.3 |
| 12. Tobacco and tobacco manufactures | 24,584 | 3.6 | 5,436 | 0.4 | 447 | 0.0 | 21,023 | 1.1 | 81,011 | 5.0 |
| 2. Crude materials,inedible,except fuels | 28,770 | 4.2 | 38,062 | 2.5 | 37,585 | 1.5 | 28,875 | 1.5 | 24,652 | 1.5 |
| 21. Hides,skins,furskins,raw | 1,375 | 0.1 | 2,089 | 0.1 | 1,198 | 0.1 | ||||
| 22. Oil seeds,oleaginous fruits | 15,344 | 2.2 | 10,667 | 0.7 | 16,453 | 0.7 | 10,258 | 0.5 | 10,242 | 0.6 |
| 23. Crude rubber (incl.synthetic) | 2 | 0.0 | ||||||||
| 24. Cork and wood | 887 | 0.1 | 2,382 | 0.2 | 432 | 0.0 | 500 | 0.0 | 1,206 | 0.1 |
| 25. Pulp and waste paper | 7,521 | 1.1 | 4,628 | 0.3 | 2,905 | 0.1 | 5,140 | 0.3 | 5,497 | 0.3 |
| 26. Textile fibres and their wastes | 92 | 0.0 | 200 | 0.0 | 533 | 0.0 | 73 | 0.0 | 19 | 0.0 |
| 27. Crude fertilizers and crude minerals | 1,077 | 0.2 | 18,418 | 1.2 | 14,882 | 0.6 | 9,784 | 0.5 | 6,285 | 0.4 |
| 28. Metalliferous ores and metal scrap | 7 | 0.0 | 257 | 0.0 | ||||||
| 29. Crude animal,vegetable materials n.e.s. | 404 | 0.1 | 391 | 0.0 | 585 | 0.0 | 627 | 0.0 | 204 | 0.0 |
| 3. Mineral fuels etc | 23,527 | 3.4 | 446,147 | 28.8 | 624,214 | 25.2 | 508,589 | 27.2 | 480,577 | 29.6 |
| 32. Coal,coke and briquettes | 4,707 | 0.3 | 6 | 0.0 | 5 | 0.0 | ||||
| 33. Petroleum and products | 19,738 | 2.9 | 297,284 | 19.2 | 366,817 | 14.8 | 358,962 | 19.2 | 313,555 | 19.3 |
| 34. Gas,natural and manufactured | 127,169 | 8.2 | ||||||||
| 35. Electric current | 514 | 0.1 | 16,986 | 1.1 | 13,354 | 0.5 | 110,633 | 5.9 | 77,324 | 4.8 |
| 4. Animal and vegetable oils and fats | 10 | 0.0 | 55 | 0.0 | 37 | 0.0 | ||||
| 42. Fixed vegetable fats and oils | 10 | 0.0 | 55 | 0.0 | 37 | 0.0 | ||||
| 43. Processed animal or vegetable oils,etc. | ||||||||||
| 5. Chemicals and related products,n.e.s. | 106,292 | 15.5 | 121,377 | 7.8 | 199,210 | 8.1 | 150,882 | 8.1 | 146,030 | 9.0 |
| 51. Organic chemicals | 3,489 | 0.5 | 1,827 | 0.1 | 6,483 | 0.3 | 2,477 | 0.1 | 1,420 | 0.1 |
| 52. Inorganic chemicals | 2,463 | 0.4 | 13,285 | 0.9 | 13,526 | 0.5 | 13,531 | 0.7 | 10,323 | 0.6 |
| 53. Dyeing,tanning and colouring material | 4,267 | 0.6 | 4,317 | 0.3 | 6,204 | 0.3 | 6,550 | 0.3 | 6,700 | 0.4 |
| 54. Medicinal and pharmaceutical products | 35,248 | 5.2 | 45,861 | 3.0 | 31,305 | 1.3 | 44,944 | 2.4 | 63,600 | 3.9 |
| 55. Perfume,cleaning etc.preparations | 14,391 | 2.1 | 6,056 | 0.4 | 17,947 | 0.7 | 26,146 | 1.4 | 16,484 | 1.0 |
| 56. Fertilizers,manufactured | 4,971 | 0.7 | 13,358 | 0.9 | 74,006 | 3.0 | 11,385 | 0.6 | 3,873 | 0.2 |
| 57. Plastics in primary forms | 15,859 | 2.3 | 15,067 | 1.0 | 18,128 | 0.7 | 19,066 | 1.0 | 15,929 | 1.0 |
| 58. Plastics in non-primary forms | 19,739 | 2.9 | 16,036 | 1.0 | 20,980 | 0.8 | 13,525 | 0.7 | 13,696 | 0.8 |
| 59. Chemical materials and products,n.e.s. | 5,865 | 0.9 | 5,570 | 0.4 | 10,630 | 0.4 | 13,256 | 0.7 | 14,005 | 0.9 |
| 6. Basic manufactures | 132,818 | 19.4 | 172,274 | 11.1 | 194,804 | 7.9 | 172,507 | 9.2 | 171,539 | 10.6 |
| 61. Leather,dressed fur,etc. | 12,963 | 1.9 | 12,120 | 0.8 | 9,910 | 0.4 | 9,481 | 0.5 | 8,905 | 0.5 |
| 62. Rubber manufactures,n.e.s. | 11,141 | 1.6 | 11,630 | 0.8 | 9,868 | 0.4 | 9,694 | 0.5 | 8,725 | 0.5 |
| 63. Wood and cork manufactures | 18,213 | 2.7 | 25,646 | 1.7 | 27,123 | 1.1 | 29,451 | 1.6 | 30,481 | 1.9 |
| 64. Paper,paperboard and articles thereof | 7,825 | 1.1 | 18,414 | 1.2 | 21,248 | 0.9 | 25,003 | 1.3 | 23,898 | 1.5 |
| 65. Textile yarn,fabrics,made up articles,etc. | 53,854 | 7.9 | 54,233 | 3.5 | 42,555 | 1.7 | 38,081 | 2.0 | 41,426 | 2.5 |
| 66. Non-metallic mineral manufactures,n.e.s. | 3,866 | 0.6 | 11,204 | 0.7 | 10,629 | 0.4 | 13,727 | 0.7 | 14,360 | 0.9 |
| 67. Iron and steel | 14,469 | 2.1 | 33,133 | 2.1 | 59,113 | 2.4 | 28,937 | 1.5 | 27,650 | 1.7 |
| 68. Non-ferrous metals | 849 | 0.1 | 609 | 0.0 | 6,444 | 0.3 | 10,149 | 0.5 | 6,293 | 0.4 |
| 69. Manufactures of metals,n.e.s. | 9,638 | 1.4 | 5,286 | 0.3 | 7,915 | 0.3 | 7,986 | 0.4 | 9,802 | 0.6 |
| 7. Machinery,transport equipment | 296,942 | 43.4 | 322,027 | 20.8 | 239,400 | 9.7 | 262,921 | 14.0 | 284,662 | 17.5 |
| 71. Power generating machinery and equipment | 3,164 | 0.5 | 24,851 | 1.6 | 14,639 | 0.6 | 17,122 | 0.9 | 19,651 | 1.2 |
| 72. Machinery for specialized industries | 10,162 | 1.5 | 4,254 | 0.3 | 8,144 | 0.3 | 11,979 | 0.6 | 16,257 | 1.0 |
| 73. Metal working machinery | 2,074 | 0.3 | 225 | 0.0 | 785 | 0.0 | 521 | 0.0 | 1,066 | 0.1 |
| 74. General industrial machinery n.e.s. | 15,571 | 2.3 | 23,225 | 1.5 | 19,414 | 0.8 | 20,030 | 1.1 | 21,775 | 1.3 |
| 75. Office machines and adp machines | 1,411 | 0.2 | 2,021 | 0.1 | 2,637 | 0.1 | 1,716 | 0.1 | 1,151 | 0.1 |
| 76. Telecommunications and sound recording equipment | 1,382 | 0.2 | 14,293 | 0.9 | 17,397 | 0.7 | 31,509 | 1.7 | 7,596 | 0.5 |
| 77. Electric machinery,n.e.s.and parts | 131,393 | 19.2 | 96,238 | 6.2 | 74,313 | 3.0 | 84,863 | 4.5 | 95,757 | 5.9 |
| 78. Road vehicles | 92,805 | 13.6 | 39,565 | 2.6 | 83,321 | 3.4 | 95,045 | 5.1 | 107,772 | 6.6 |
| 79. Other transport equipment | 38,981 | 5.7 | 117,354 | 7.6 | 18,751 | 0.8 | 137 | 0.0 | 13,638 | 0.8 |
| 8. Miscellaneous manufactured articles | 52,941 | 7.7 | 72,958 | 4.7 | 46,573 | 1.9 | 701,368 | 37.5 | 401,099 | 24.7 |
| 81. Prefabr.buildings;sanitary,lighting etc.fixtrs | 509 | 0.1 | 511 | 0.0 | 425 | 0.0 | 470 | 0.0 | 656 | 0.0 |
| 82. Furniture and parts thereof | 3,261 | 0.5 | 2,136 | 0.1 | 1,840 | 0.1 | 4,005 | 0.2 | 1,883 | 0.1 |
| 83. Travel goods,handbags and sim.containers | 386 | 0.1 | 120 | 0.0 | 99 | 0.0 | 121 | 0.0 | 145 | 0.0 |
| 84. Articles of apparel and clothing accessories | 1,974 | 0.3 | 9,805 | 0.6 | 1,420 | 0.1 | 3,532 | 0.2 | 5,606 | 0.3 |
| 85. Footwear | 9,093 | 1.3 | 9,776 | 0.6 | 7,285 | 0.3 | 5,919 | 0.3 | 5,643 | 0.3 |
| 87. Instruments and apparates n.e.s. | 6,534 | 1.0 | 7,687 | 0.5 | 4,175 | 0.2 | 4,560 | 0.2 | 4,120 | 0.3 |
| 88. Photographic equipment,optical goods etc. | 111 | 0.0 | 117 | 0.0 | 292 | 0.0 | 184 | 0.0 | 241 | 0.0 |
| 89. Miscellaneous manufactured articles,n.e.s. | 31,074 | 4.5 | 42,805 | 2.8 | 31,035 | 1.3 | 682,576 | 36.5 | 382,806 | 23.5 |
| 9. Goods not classified elsewhere | 1,189 | 0.1 | ||||||||
| 97. Gold,non-monetary | ||||||||||
| In Total | 683,974 | 100.0 | 1,546,720 | 100.0 | 2,473,255 | 100.0 | 1,872,361 | 100.0 | 1,625,903 | 100.0 |

| 2021 | 2022 | 2023 | 2024 | 2025 | ||||||
|---|---|---|---|---|---|---|---|---|---|---|
| 1.000 € | % | 1.000 € | % | 1.000 € | % | 1.000 € | % | 1.000 € | % | |
| 0. Food and live animals | 108,482 | 8.2 | 523,922 | 23.8 | 495,733 | 33.8 | 237,705 | 19.4 | 232,872 | 18.8 |
| 00. Live animals | ||||||||||
| 01. Meat and meat preparations | 3,652 | 0.3 | 6,241 | 0.3 | 9,536 | 0.6 | 18,738 | 1.5 | 3,778 | 0.3 |
| 02. Dairy products and birds' eggs | 80 | 0.0 | 1,838 | 0.1 | 4,382 | 0.3 | 9,482 | 0.8 | 11,677 | 0.9 |
| 03. Fish and fish preparations | 41 | 0.0 | 25 | 0.0 | 948 | 0.1 | ||||
| 04. Cereals and cereal preparations | 30,257 | 2.3 | 398,022 | 18.1 | 263,048 | 17.9 | 78,074 | 6.4 | 69,953 | 5.6 |
| 05. Vegetables and fruit | 13,431 | 1.0 | 9,396 | 0.4 | 9,901 | 0.7 | 22,394 | 1.8 | 21,187 | 1.7 |
| 06. Sugars,sugar preparations and honey | 18,188 | 1.4 | 61,960 | 2.8 | 130,729 | 8.9 | 26,012 | 2.1 | 26,939 | 2.2 |
| 07. Coffee,tea,cocoa,spices | 21,831 | 1.7 | 18,367 | 0.8 | 23,963 | 1.6 | 28,077 | 2.3 | 33,221 | 2.7 |
| 08. Feeding stuff for animals | 4,873 | 0.4 | 19,279 | 0.9 | 44,266 | 3.0 | 46,197 | 3.8 | 55,395 | 4.5 |
| 09. Miscellaneous edible products and preparations | 15,994 | 1.2 | 8,777 | 0.4 | 9,908 | 0.7 | 8,694 | 0.7 | 9,434 | 0.8 |
| 1. Beverages and tobacco | 10,464 | 0.8 | 4,340 | 0.2 | 17,864 | 1.2 | 11,576 | 0.9 | 5,053 | 0.4 |
| 11. Beverages | 10,459 | 0.8 | 4,251 | 0.2 | 17,864 | 1.2 | 11,575 | 0.9 | 5,052 | 0.4 |
| 12. Tobacco and tobacco manufactures | 5 | 0.0 | 89 | 0.0 | 1 | 0.0 | 1 | 0.0 | ||
| 2. Crude materials,inedible,except fuels | 294,886 | 22.3 | 667,712 | 30.3 | 254,263 | 17.3 | 180,006 | 14.7 | 149,420 | 12.0 |
| 21. Hides,skins,furskins,raw | 15 | 0.0 | 112 | 0.0 | 227 | 0.0 | ||||
| 22. Oil seeds,oleaginous fruits | 3,823 | 0.3 | 480,227 | 21.8 | 119,371 | 8.1 | 49,429 | 4.0 | 52,100 | 4.2 |
| 23. Crude rubber (incl.synthetic) | 5 | 0.0 | ||||||||
| 24. Cork and wood | 79,170 | 6.0 | 105,681 | 4.8 | 98,495 | 6.7 | 93,625 | 7.6 | 88,842 | 7.2 |
| 25. Pulp and waste paper | 45 | 0.0 | 12 | 0.0 | 22 | 0.0 | 30 | 0.0 | 86 | 0.0 |
| 26. Textile fibres and their wastes | 498 | 0.0 | 226 | 0.0 | 55 | 0.0 | 42 | 0.0 | 99 | 0.0 |
| 27. Crude fertilizers and crude minerals | 2,365 | 0.2 | 693 | 0.0 | 416 | 0.0 | 8,746 | 0.7 | 6,530 | 0.5 |
| 28. Metalliferous ores and metal scrap | 208,564 | 15.8 | 79,541 | 3.6 | 24,481 | 2.0 | 141 | 0.0 | ||
| 29. Crude animal,vegetable materials n.e.s. | 420 | 0.0 | 1,288 | 0.1 | 1,555 | 0.1 | 3,530 | 0.3 | 1,386 | 0.1 |
| 3. Mineral fuels etc | 45,736 | 3.5 | 138,221 | 6.3 | 3,266 | 0.2 | 6,441 | 0.5 | 38,652 | 3.1 |
| 32. Coal,coke and briquettes | 339 | 0.0 | 178 | 0.0 | 229 | 0.0 | ||||
| 33. Petroleum and products | 38,509 | 2.9 | 1,059 | 0.0 | 1,871 | 0.1 | 395 | 0.0 | 10,247 | 0.8 |
| 34. Gas,natural and manufactured | 25,000 | 1.1 | ||||||||
| 35. Electric current | 6,987 | 0.5 | 111,823 | 5.1 | 1,217 | 0.1 | 5,972 | 0.5 | 28,175 | 2.3 |
| 4. Animal and vegetable oils and fats | 4,336 | 0.3 | 88,973 | 4.0 | 12,242 | 0.8 | 61,365 | 4.9 | ||
| 42. Fixed vegetable fats and oils | 3,614 | 0.3 | 88,769 | 4.0 | 12,203 | 0.8 | 60,656 | 4.9 | ||
| 43. Processed animal or vegetable oils,etc. | 39 | 0.0 | ||||||||
| 5. Chemicals and related products,n.e.s. | 95,199 | 7.2 | 109,819 | 5.0 | 39,452 | 2.7 | 30,566 | 2.5 | 40,475 | 3.3 |
| 51. Organic chemicals | 906 | 0.1 | 392 | 0.0 | 719 | 0.0 | 2,009 | 0.2 | 9,082 | 0.7 |
| 52. Inorganic chemicals | 3,782 | 0.3 | 3,005 | 0.1 | 3,386 | 0.2 | 1,859 | 0.2 | 372 | 0.0 |
| 53. Dyeing,tanning and colouring material | 576 | 0.0 | 635 | 0.0 | 747 | 0.1 | 912 | 0.1 | 809 | 0.1 |
| 54. Medicinal and pharmaceutical products | 236 | 0.0 | 275 | 0.0 | 130 | 0.0 | 40 | 0.0 | 40 | 0.0 |
| 55. Perfume,cleaning etc.preparations | 983 | 0.1 | 1,070 | 0.0 | 3,115 | 0.2 | 9,935 | 0.8 | 13,128 | 1.1 |
| 56. Fertilizers,manufactured | 64,121 | 4.8 | 92,114 | 4.2 | 24,565 | 1.7 | 9,198 | 0.8 | 6,597 | 0.5 |
| 57. Plastics in primary forms | 17,534 | 1.3 | 4,217 | 0.2 | 656 | 0.0 | 571 | 0.0 | 1,047 | 0.1 |
| 58. Plastics in non-primary forms | 6,249 | 0.5 | 6,836 | 0.3 | 4,968 | 0.3 | 4,811 | 0.4 | 7,698 | 0.6 |
| 59. Chemical materials and products,n.e.s. | 812 | 0.1 | 1,276 | 0.1 | 1,167 | 0.1 | 1,163 | 0.1 | 1,573 | 0.1 |
| 6. Basic manufactures | 405,768 | 30.7 | 383,918 | 17.4 | 327,295 | 22.3 | 389,233 | 31.7 | 454,957 | 36.7 |
| 61. Leather,dressed fur,etc. | 729 | 0.1 | 601 | 0.0 | 309 | 0.0 | 239 | 0.0 | 178 | 0.0 |
| 62. Rubber manufactures,n.e.s. | 2,958 | 0.2 | 1,994 | 0.1 | 1,262 | 0.1 | 2,385 | 0.2 | 1,862 | 0.2 |
| 63. Wood and cork manufactures | 43,178 | 3.3 | 59,293 | 2.7 | 40,588 | 2.8 | 42,224 | 3.4 | 55,555 | 4.5 |
| 64. Paper,paperboard and articles thereof | 33,442 | 2.5 | 17,135 | 0.8 | 16,002 | 1.1 | 16,397 | 1.3 | 18,163 | 1.5 |
| 65. Textile yarn,fabrics,made up articles,etc. | 11,910 | 0.9 | 11,287 | 0.5 | 8,606 | 0.6 | 11,179 | 0.9 | 11,238 | 0.9 |
| 66. Non-metallic mineral manufactures,n.e.s. | 61,162 | 4.6 | 59,189 | 2.7 | 74,775 | 5.1 | 94,861 | 7.7 | 110,672 | 8.9 |
| 67. Iron and steel | 219,989 | 16.6 | 205,646 | 9.3 | 161,536 | 11.0 | 198,354 | 16.2 | 232,603 | 18.8 |
| 68. Non-ferrous metals | 6,464 | 0.5 | 2,403 | 0.1 | 305 | 0.0 | 146 | 0.0 | 341 | 0.0 |
| 69. Manufactures of metals,n.e.s. | 25,936 | 2.0 | 26,369 | 1.2 | 23,912 | 1.6 | 23,216 | 1.9 | 24,056 | 1.9 |
| 7. Machinery,transport equipment | 232,027 | 17.5 | 154,357 | 7.0 | 107,197 | 7.3 | 110,796 | 9.0 | 91,321 | 7.4 |
| 71. Power generating machinery and equipment | 156 | 0.0 | 868 | 0.0 | 8,220 | 0.6 | 451 | 0.0 | 1,001 | 0.1 |
| 72. Machinery for specialized industries | 12,664 | 1.0 | 12,619 | 0.6 | 11,623 | 0.8 | 13,508 | 1.1 | 9,595 | 0.8 |
| 73. Metal working machinery | 4,942 | 0.4 | 3,541 | 0.2 | 1,039 | 0.1 | 612 | 0.0 | 895 | 0.1 |
| 74. General industrial machinery n.e.s. | 12,297 | 0.9 | 11,735 | 0.5 | 21,366 | 1.5 | 11,757 | 1.0 | 12,410 | 1.0 |
| 75. Office machines and adp machines | 1,018 | 0.1 | 1,379 | 0.1 | 971 | 0.1 | 715 | 0.1 | 1,159 | 0.1 |
| 76. Telecommunications and sound recording equipment | 214 | 0.0 | 158 | 0.0 | 358 | 0.0 | 252 | 0.0 | 345 | 0.0 |
| 77. Electric machinery,n.e.s.and parts | 191,216 | 14.5 | 114,787 | 5.2 | 55,708 | 3.8 | 59,729 | 4.9 | 45,575 | 3.7 |
| 78. Road vehicles | 6,167 | 0.5 | 5,957 | 0.3 | 5,270 | 0.4 | 4,345 | 0.4 | 8,042 | 0.6 |
| 79. Other transport equipment | 3,352 | 0.3 | 3,312 | 0.2 | 2,642 | 0.2 | 19,330 | 1.6 | 12,182 | 1.0 |
| 8. Miscellaneous manufactured articles | 125,202 | 9.5 | 130,967 | 5.9 | 131,137 | 8.9 | 221,413 | 18.1 | 165,954 | 13.4 |
| 81. Prefabr.buildings;sanitary,lighting etc.fixtrs | 7,187 | 0.5 | 5,172 | 0.2 | 8,485 | 0.6 | 10,752 | 0.9 | 11,853 | 1.0 |
| 82. Furniture and parts thereof | 25,468 | 1.9 | 22,595 | 1.0 | 22,578 | 1.5 | 25,917 | 2.1 | 23,823 | 1.9 |
| 83. Travel goods,handbags and sim.containers | 5 | 0.0 | 22 | 0.0 | 19 | 0.0 | 17 | 0.0 | 76 | 0.0 |
| 84. Articles of apparel and clothing accessories | 20,869 | 1.6 | 28,936 | 1.3 | 28,084 | 1.9 | 23,470 | 1.9 | 24,481 | 2.0 |
| 85. Footwear | 58,213 | 4.4 | 55,596 | 2.5 | 52,204 | 3.6 | 46,785 | 3.8 | 48,827 | 3.9 |
| 87. Instruments and apparates n.e.s. | 1,571 | 0.1 | 3,070 | 0.1 | 2,517 | 0.2 | 364 | 0.0 | 823 | 0.1 |
| 88. Photographic equipment,optical goods etc. | 8 | 0.0 | 8 | 0.0 | 20 | 0.0 | 38 | 0.0 | 8 | 0.0 |
| 89. Miscellaneous manufactured articles,n.e.s. | 11,883 | 0.9 | 15,567 | 0.7 | 17,231 | 1.2 | 113,878 | 9.3 | 55,854 | 4.5 |
| 9. Goods not classified elsewhere | 1 | 0.0 | ||||||||
| 97. Gold,non-monetary | ||||||||||
| In Total | 1,322,468 | 100.0 | 2,203,145 | 100.0 | 1,467,940 | 100.0 | 1,226,025 | 100.0 | 1,240,070 | 100.0 |