
| European countries' export and import of goods | SITC |
Data:Eurostat

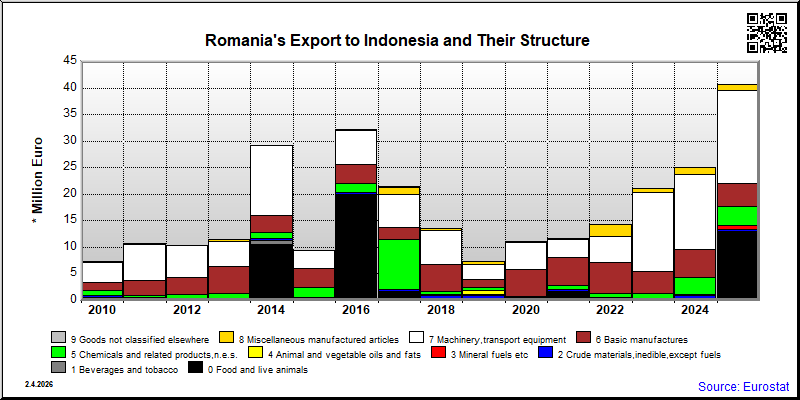
| 2021 | 2022 | 2023 | 2024 | 2025 | ||||||
|---|---|---|---|---|---|---|---|---|---|---|
| 1.000 € | % | 1.000 € | % | 1.000 € | % | 1.000 € | % | 1.000 € | % | |
| 0. Food and live animals | 1,601 | 13.7 | 31 | 0.2 | 107 | 0.5 | 9 | 0.0 | 12,950 | 31.9 |
| 01. Meat and meat preparations | ||||||||||
| 03. Fish and fish preparations | ||||||||||
| 04. Cereals and cereal preparations | 1,496 | 12.8 | 12,904 | 31.8 | ||||||
| 05. Vegetables and fruit | ||||||||||
| 06. Sugars,sugar preparations and honey | ||||||||||
| 07. Coffee,tea,cocoa,spices | 48 | 0.4 | 31 | 0.2 | 107 | 0.5 | 1 | 0.0 | 1 | 0.0 |
| 08. Feeding stuff for animals | ||||||||||
| 09. Miscellaneous edible products and preparations | 8 | 0.0 | 45 | 0.1 | ||||||
| 1. Beverages and tobacco | 6 | 0.0 | 261 | 1.0 | 15 | 0.0 | ||||
| 12. Tobacco and tobacco manufactures | 6 | 0.0 | 261 | 1.0 | 15 | 0.0 | ||||
| 2. Crude materials,inedible,except fuels | 558 | 4.8 | 604 | 4.2 | 329 | 1.6 | 611 | 2.4 | 464 | 1.1 |
| 23. Crude rubber (incl.synthetic) | 1 | 0.0 | ||||||||
| 24. Cork and wood | 556 | 4.7 | 604 | 4.2 | 329 | 1.6 | 237 | 0.9 | 235 | 0.6 |
| 25. Pulp and waste paper | ||||||||||
| 26. Textile fibres and their wastes | ||||||||||
| 29. Crude animal,vegetable materials n.e.s. | ||||||||||
| 3. Mineral fuels etc | 1 | 0.0 | 3 | 0.0 | 255 | 1.0 | 758 | 1.9 | ||
| 32. Coal,coke and briquettes | ||||||||||
| 33. Petroleum and products | 1 | 0.0 | 3 | 0.0 | 255 | 1.0 | 758 | 1.9 | ||
| 4. Animal and vegetable oils and fats | ||||||||||
| 42. Fixed vegetable fats and oils | ||||||||||
| 43. Processed animal or vegetable oils,etc. | ||||||||||
| 5. Chemicals and related products,n.e.s. | 737 | 6.3 | 686 | 4.8 | 806 | 3.8 | 3,277 | 13.1 | 3,452 | 8.5 |
| 51. Organic chemicals | 3 | 0.0 | 3 | 0.0 | 2 | 0.0 | 3 | 0.0 | ||
| 52. Inorganic chemicals | ||||||||||
| 53. Dyeing,tanning and colouring material | 151 | 1.3 | 353 | 2.5 | 337 | 1.6 | 545 | 2.2 | ||
| 55. Perfume,cleaning etc.preparations | 2 | 0.0 | 31 | 0.2 | 7 | 0.0 | 2 | 0.0 | ||
| 56. Fertilizers,manufactured | ||||||||||
| 57. Plastics in primary forms | 67 | 0.6 | 160 | 1.1 | 70 | 0.3 | 29 | 0.1 | 10 | 0.0 |
| 58. Plastics in non-primary forms | 4 | 0.0 | 12 | 0.1 | 16 | 0.1 | 13 | 0.1 | 77 | 0.2 |
| 59. Chemical materials and products,n.e.s. | 3 | 0.0 | 1 | 0.0 | 2,548 | 10.2 | 2,800 | 6.9 | ||
| 6. Basic manufactures | 5,253 | 44.8 | 5,761 | 40.5 | 4,200 | 19.9 | 5,182 | 20.7 | 4,451 | 11.0 |
| 61. Leather,dressed fur,etc. | 6 | 0.0 | ||||||||
| 62. Rubber manufactures,n.e.s. | 541 | 4.6 | 894 | 6.3 | 606 | 2.9 | 320 | 1.3 | 464 | 1.1 |
| 63. Wood and cork manufactures | 152 | 1.3 | 64 | 0.5 | 150 | 0.7 | 167 | 0.7 | 180 | 0.4 |
| 64. Paper,paperboard and articles thereof | 386 | 3.3 | 1 | 0.0 | 243 | 1.0 | 800 | 2.0 | ||
| 65. Textile yarn,fabrics,made up articles,etc. | 89 | 0.8 | 328 | 2.3 | 231 | 1.1 | 1,535 | 6.1 | 705 | 1.7 |
| 66. Non-metallic mineral manufactures,n.e.s. | 4 | 0.0 | 2 | 0.0 | 42 | 0.2 | 70 | 0.3 | 290 | 0.7 |
| 67. Iron and steel | 3,693 | 31.5 | 3,847 | 27.1 | 2,205 | 10.4 | 2,183 | 8.7 | 645 | 1.6 |
| 68. Non-ferrous metals | 251 | 1.2 | 253 | 1.0 | ||||||
| 69. Manufactures of metals,n.e.s. | 162 | 1.4 | 627 | 4.4 | 716 | 3.4 | 410 | 1.6 | 1,288 | 3.2 |
| 7. Machinery,transport equipment | 3,359 | 28.7 | 5,029 | 35.4 | 14,972 | 70.8 | 14,142 | 56.4 | 17,407 | 42.9 |
| 71. Power generating machinery and equipment | 618 | 5.3 | 211 | 1.5 | 344 | 1.6 | 806 | 3.2 | 704 | 1.7 |
| 72. Machinery for specialized industries | 1,139 | 9.7 | 1,979 | 13.9 | 269 | 1.3 | 3,537 | 14.1 | 793 | 2.0 |
| 73. Metal working machinery | 1,872 | 4.6 | ||||||||
| 74. General industrial machinery n.e.s. | 1,145 | 9.8 | 2,074 | 14.6 | 12,899 | 61.0 | 4,202 | 16.8 | 7,435 | 18.3 |
| 75. Office machines and adp machines | 55 | 0.5 | 143 | 1.0 | 190 | 0.9 | 78 | 0.3 | 125 | 0.3 |
| 76. Telecommunications and sound recording equipment | 55 | 0.5 | 216 | 1.5 | 623 | 2.9 | 81 | 0.3 | 496 | 1.2 |
| 77. Electric machinery,n.e.s.and parts | 344 | 2.9 | 401 | 2.8 | 642 | 3.0 | 2,721 | 10.9 | 2,154 | 5.3 |
| 78. Road vehicles | 4 | 0.0 | 5 | 0.0 | 4 | 0.0 | 2,717 | 10.8 | 3,827 | 9.4 |
| 79. Other transport equipment | ||||||||||
| 8. Miscellaneous manufactured articles | 206 | 1.8 | 2,098 | 14.8 | 737 | 3.5 | 1,321 | 5.3 | 1,084 | 2.7 |
| 81. Prefabr.buildings;sanitary,lighting etc.fixtrs | 38 | 0.3 | 113 | 0.5 | 10 | 0.0 | 24 | 0.1 | ||
| 82. Furniture and parts thereof | 38 | 0.3 | 13 | 0.1 | 1 | 0.0 | ||||
| 83. Travel goods,handbags and sim.containers | 2 | 0.0 | ||||||||
| 84. Articles of apparel and clothing accessories | 25 | 0.2 | 14 | 0.1 | 38 | 0.2 | 24 | 0.1 | 6 | 0.0 |
| 85. Footwear | 1 | 0.0 | 33 | 0.2 | 1 | 0.0 | 3 | 0.0 | 89 | 0.2 |
| 87. Instruments and apparates n.e.s. | 140 | 1.2 | 1,925 | 13.5 | 509 | 2.4 | 1,238 | 4.9 | 798 | 2.0 |
| 88. Photographic equipment,optical goods etc. | 1 | 0.0 | 1 | 0.0 | 1 | 0.0 | ||||
| 89. Miscellaneous manufactured articles,n.e.s. | 39 | 0.3 | 50 | 0.3 | 63 | 0.3 | 45 | 0.2 | 164 | 0.4 |
| In Total | 11,715 | 100.0 | 14,217 | 100.0 | 21,156 | 100.0 | 25,058 | 100.0 | 40,581 | 100.0 |

| 2021 | 2022 | 2023 | 2024 | 2025 | ||||||
|---|---|---|---|---|---|---|---|---|---|---|
| 1.000 € | % | 1.000 € | % | 1.000 € | % | 1.000 € | % | 1.000 € | % | |
| 0. Food and live animals | 2,185 | 1.8 | 4,772 | 2.8 | 9,172 | 6.4 | 10,065 | 6.7 | 10,859 | 6.1 |
| 01. Meat and meat preparations | ||||||||||
| 03. Fish and fish preparations | ||||||||||
| 04. Cereals and cereal preparations | 22 | 0.0 | ||||||||
| 05. Vegetables and fruit | ||||||||||
| 06. Sugars,sugar preparations and honey | 147 | 0.1 | ||||||||
| 07. Coffee,tea,cocoa,spices | 804 | 0.6 | 1,716 | 1.0 | 1,123 | 0.8 | 1,717 | 1.1 | 2,621 | 1.5 |
| 08. Feeding stuff for animals | ||||||||||
| 09. Miscellaneous edible products and preparations | 6,389 | 4.3 | 5,956 | 3.3 | ||||||
| 1. Beverages and tobacco | 293 | 0.2 | 207 | 0.1 | 323 | 0.2 | 1,109 | 0.7 | 614 | 0.3 |
| 12. Tobacco and tobacco manufactures | 293 | 0.2 | 206 | 0.1 | 323 | 0.2 | 1,109 | 0.7 | 614 | 0.3 |
| 2. Crude materials,inedible,except fuels | 60,790 | 48.9 | 60,758 | 35.9 | 30,177 | 21.1 | 31,617 | 21.1 | 33,202 | 18.6 |
| 23. Crude rubber (incl.synthetic) | 60,280 | 48.5 | ||||||||
| 24. Cork and wood | 441 | 0.4 | 312 | 0.2 | 233 | 0.2 | 175 | 0.1 | 179 | 0.1 |
| 25. Pulp and waste paper | ||||||||||
| 26. Textile fibres and their wastes | ||||||||||
| 29. Crude animal,vegetable materials n.e.s. | ||||||||||
| 3. Mineral fuels etc | 1 | 0.0 | 18,795 | 12.5 | ||||||
| 32. Coal,coke and briquettes | ||||||||||
| 33. Petroleum and products | 1 | 0.0 | ||||||||
| 4. Animal and vegetable oils and fats | ||||||||||
| 42. Fixed vegetable fats and oils | ||||||||||
| 43. Processed animal or vegetable oils,etc. | ||||||||||
| 5. Chemicals and related products,n.e.s. | 2,363 | 1.9 | 7,855 | 4.6 | 3,749 | 2.6 | 1,094 | 0.7 | 3,901 | 2.2 |
| 51. Organic chemicals | 967 | 0.6 | 811 | 0.6 | 456 | 0.3 | 1,107 | 0.6 | ||
| 52. Inorganic chemicals | ||||||||||
| 53. Dyeing,tanning and colouring material | 12 | 0.0 | 12 | 0.0 | 7 | 0.0 | ||||
| 55. Perfume,cleaning etc.preparations | 69 | 0.1 | 127 | 0.1 | 483 | 0.3 | 509 | 0.3 | 474 | 0.3 |
| 56. Fertilizers,manufactured | ||||||||||
| 57. Plastics in primary forms | 1,046 | 0.8 | 2,956 | 1.7 | 134 | 0.1 | 2 | 0.0 | 1,788 | 1.0 |
| 58. Plastics in non-primary forms | 225 | 0.2 | 93 | 0.1 | 26 | 0.0 | 48 | 0.0 | 113 | 0.1 |
| 59. Chemical materials and products,n.e.s. | 153 | 0.1 | 74 | 0.1 | 75 | 0.0 | 397 | 0.2 | ||
| 6. Basic manufactures | 36,345 | 29.2 | 56,103 | 33.2 | 60,422 | 42.3 | 45,223 | 30.2 | 92,029 | 51.5 |
| 61. Leather,dressed fur,etc. | 1 | 0.0 | ||||||||
| 62. Rubber manufactures,n.e.s. | 25,907 | 20.8 | 35,049 | 20.7 | 42,972 | 30.1 | 30,683 | 20.5 | 35,362 | 19.8 |
| 63. Wood and cork manufactures | 665 | 0.5 | 1,820 | 1.1 | 754 | 0.5 | 891 | 0.6 | 999 | 0.6 |
| 64. Paper,paperboard and articles thereof | 2,905 | 2.3 | 10,877 | 7.6 | 8,542 | 5.7 | 15,709 | 8.8 | ||
| 65. Textile yarn,fabrics,made up articles,etc. | 5,588 | 4.5 | 4,284 | 2.5 | 3,504 | 2.5 | 3,702 | 2.5 | 2,084 | 1.2 |
| 66. Non-metallic mineral manufactures,n.e.s. | 703 | 0.6 | 884 | 0.5 | 937 | 0.7 | 620 | 0.4 | 889 | 0.5 |
| 67. Iron and steel | 263 | 0.2 | 755 | 0.4 | 449 | 0.3 | 259 | 0.2 | 28,737 | 16.1 |
| 68. Non-ferrous metals | 402 | 0.3 | 61 | 0.0 | ||||||
| 69. Manufactures of metals,n.e.s. | 314 | 0.3 | 552 | 0.3 | 526 | 0.4 | 453 | 0.3 | 8,239 | 4.6 |
| 7. Machinery,transport equipment | 13,548 | 10.9 | 27,426 | 16.2 | 25,992 | 18.2 | 29,575 | 19.7 | 26,688 | 14.9 |
| 71. Power generating machinery and equipment | 10 | 0.0 | 2 | 0.0 | 3 | 0.0 | 1 | 0.0 | ||
| 72. Machinery for specialized industries | 293 | 0.2 | 70 | 0.0 | 16 | 0.0 | 13 | 0.0 | 23 | 0.0 |
| 73. Metal working machinery | 12 | 0.0 | ||||||||
| 74. General industrial machinery n.e.s. | 283 | 0.2 | 703 | 0.4 | 538 | 0.4 | 816 | 0.5 | 1,751 | 1.0 |
| 75. Office machines and adp machines | 13 | 0.0 | 5 | 0.0 | 14 | 0.0 | 51 | 0.0 | 67 | 0.0 |
| 76. Telecommunications and sound recording equipment | 2,139 | 1.7 | 1,313 | 0.8 | 2,626 | 1.8 | 2,359 | 1.6 | 881 | 0.5 |
| 77. Electric machinery,n.e.s.and parts | 9,683 | 7.8 | 22,551 | 13.3 | 22,062 | 15.4 | 24,465 | 16.3 | 22,296 | 12.5 |
| 78. Road vehicles | 1,121 | 0.9 | 2,683 | 1.6 | 734 | 0.5 | 800 | 0.5 | 1,638 | 0.9 |
| 79. Other transport equipment | ||||||||||
| 8. Miscellaneous manufactured articles | 8,419 | 6.8 | 11,452 | 6.8 | 9,936 | 7.0 | 10,112 | 6.7 | 8,513 | 4.8 |
| 81. Prefabr.buildings;sanitary,lighting etc.fixtrs | 4 | 0.0 | 11 | 0.0 | 54 | 0.0 | 53 | 0.0 | ||
| 82. Furniture and parts thereof | 1,896 | 1.5 | 2,895 | 1.7 | 1,463 | 1.0 | 1,831 | 1.0 | ||
| 83. Travel goods,handbags and sim.containers | 174 | 0.1 | 104 | 0.1 | 169 | 0.1 | 278 | 0.2 | 176 | 0.1 |
| 84. Articles of apparel and clothing accessories | 2,685 | 2.2 | 2,347 | 1.4 | 2,234 | 1.6 | 2,938 | 2.0 | 2,131 | 1.2 |
| 85. Footwear | 891 | 0.7 | 1,229 | 0.7 | 1,652 | 1.2 | 1,138 | 0.8 | 567 | 0.3 |
| 87. Instruments and apparates n.e.s. | 24 | 0.0 | 205 | 0.1 | 1,088 | 0.8 | 210 | 0.1 | 575 | 0.3 |
| 88. Photographic equipment,optical goods etc. | 1 | 0.0 | 3 | 0.0 | 25 | 0.0 | 2 | 0.0 | ||
| 89. Miscellaneous manufactured articles,n.e.s. | 2,744 | 2.2 | 4,666 | 2.8 | 3,295 | 2.3 | 4,272 | 2.8 | 3,147 | 1.8 |
| In Total | 124,297 | 100.0 | 169,168 | 100.0 | 142,927 | 100.0 | 149,902 | 100.0 | 178,633 | 100.0 |