
| European countries' export and import of goods | SITC |
Data:Eurostat
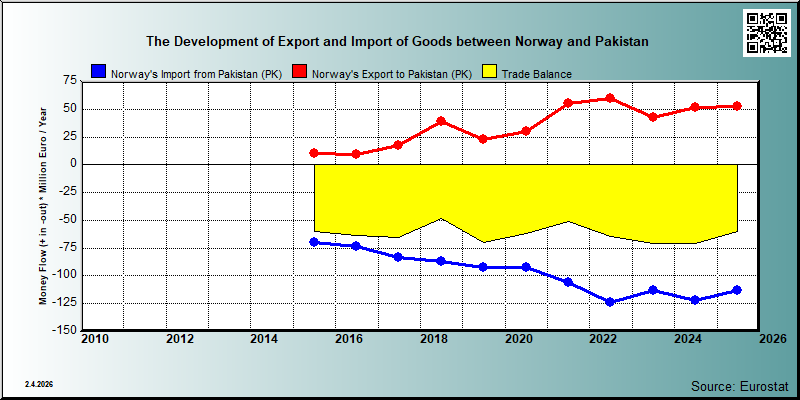
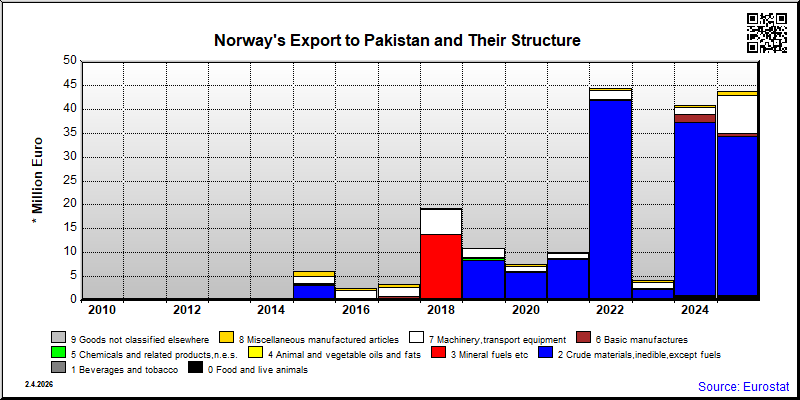
| 2021 | 2022 | 2023 | 2024 | 2025 | ||||||
|---|---|---|---|---|---|---|---|---|---|---|
| 1.000 € | % | 1.000 € | % | 1.000 € | % | 1.000 € | % | 1.000 € | % | |
| 0. Food and live animals | 24 | 0.0 | 10 | 0.0 | 960 | 1.9 | 1,106 | 2.1 | ||
| 03. Fish and fish preparations | 24 | 0.0 | 10 | 0.0 | 303 | 0.6 | 260 | 0.5 | ||
| 04. Cereals and cereal preparations | 53 | 0.1 | ||||||||
| 05. Vegetables and fruit | ||||||||||
| 06. Sugars,sugar preparations and honey | 1 | 0.0 | ||||||||
| 07. Coffee,tea,cocoa,spices | ||||||||||
| 08. Feeding stuff for animals | ||||||||||
| 09. Miscellaneous edible products and preparations | 2 | 0.0 | ||||||||
| 1. Beverages and tobacco | ||||||||||
| 11. Beverages | ||||||||||
| 2. Crude materials,inedible,except fuels | 8,580 | 15.5 | 41,800 | 70.5 | 2,354 | 5.6 | 36,347 | 70.8 | 33,115 | 63.0 |
| 21. Hides,skins,furskins,raw | ||||||||||
| 22. Oil seeds,oleaginous fruits | ||||||||||
| 23. Crude rubber (incl.synthetic) | ||||||||||
| 24. Cork and wood | ||||||||||
| 26. Textile fibres and their wastes | 81 | 0.1 | 47 | 0.1 | 29 | 0.1 | 265 | 0.5 | 173 | 0.3 |
| 27. Crude fertilizers and crude minerals | 221 | 0.4 | 607 | 1.0 | 173 | 0.4 | 923 | 1.8 | ||
| 28. Metalliferous ores and metal scrap | 7,966 | 14.4 | 41,084 | 69.3 | 1,736 | 4.1 | 36,082 | 70.3 | 31,452 | 59.8 |
| 29. Crude animal,vegetable materials n.e.s. | 24 | 0.0 | ||||||||
| 4. Animal and vegetable oils and fats | 13 | 0.0 | ||||||||
| 42. Fixed vegetable fats and oils | ||||||||||
| 5. Chemicals and related products,n.e.s. | 53 | 0.1 | 40 | 0.1 | 142 | 0.3 | 84 | 0.2 | ||
| 51. Organic chemicals | ||||||||||
| 52. Inorganic chemicals | ||||||||||
| 53. Dyeing,tanning and colouring material | 3 | 0.0 | 1 | 0.0 | 4 | 0.0 | ||||
| 54. Medicinal and pharmaceutical products | 12 | 0.0 | ||||||||
| 55. Perfume,cleaning etc.preparations | 5 | 0.0 | 10 | 0.0 | 2 | 0.0 | ||||
| 57. Plastics in primary forms | 22 | 0.0 | 6 | 0.0 | 23 | 0.1 | ||||
| 58. Plastics in non-primary forms | 2 | 0.0 | 30 | 0.1 | 21 | 0.0 | ||||
| 59. Chemical materials and products,n.e.s. | 26 | 0.0 | 19 | 0.0 | 75 | 0.2 | 48 | 0.1 | ||
| 6. Basic manufactures | 41 | 0.1 | 201 | 0.3 | 50 | 0.1 | 1,614 | 3.1 | 708 | 1.3 |
| 61. Leather,dressed fur,etc. | ||||||||||
| 62. Rubber manufactures,n.e.s. | 6 | 0.0 | 12 | 0.0 | 39 | 0.1 | 26 | 0.1 | 4 | 0.0 |
| 63. Wood and cork manufactures | ||||||||||
| 64. Paper,paperboard and articles thereof | ||||||||||
| 65. Textile yarn,fabrics,made up articles,etc. | 25 | 0.0 | 1 | 0.0 | 1 | 0.0 | 19 | 0.0 | 38 | 0.1 |
| 66. Non-metallic mineral manufactures,n.e.s. | 1 | 0.0 | 1 | 0.0 | ||||||
| 67. Iron and steel | 1 | 0.0 | ||||||||
| 68. Non-ferrous metals | 1 | 0.0 | ||||||||
| 69. Manufactures of metals,n.e.s. | 11 | 0.0 | 185 | 0.3 | 8 | 0.0 | 1,568 | 3.1 | 57 | 0.1 |
| 7. Machinery,transport equipment | 1,192 | 2.2 | 1,900 | 3.2 | 1,230 | 2.9 | 1,467 | 2.9 | 7,772 | 14.8 |
| 71. Power generating machinery and equipment | 40 | 0.1 | 152 | 0.3 | 6 | 0.0 | 58 | 0.1 | ||
| 72. Machinery for specialized industries | 321 | 0.6 | 114 | 0.2 | 96 | 0.2 | 497 | 1.0 | 141 | 0.3 |
| 73. Metal working machinery | ||||||||||
| 74. General industrial machinery n.e.s. | 71 | 0.1 | 817 | 1.4 | 124 | 0.3 | 64 | 0.1 | 70 | 0.1 |
| 75. Office machines and adp machines | 480 | 0.9 | 26 | 0.0 | 116 | 0.3 | 22 | 0.0 | 326 | 0.6 |
| 76. Telecommunications and sound recording equipment | 210 | 0.4 | 573 | 1.0 | 602 | 1.4 | 882 | 1.7 | 758 | 1.4 |
| 77. Electric machinery,n.e.s.and parts | 71 | 0.1 | 217 | 0.4 | 282 | 0.7 | 2 | 0.0 | 6,337 | 12.1 |
| 78. Road vehicles | 3 | 0.0 | 32 | 0.1 | ||||||
| 79. Other transport equipment | 49 | 0.1 | ||||||||
| 8. Miscellaneous manufactured articles | 149 | 0.3 | 454 | 0.8 | 470 | 1.1 | 455 | 0.9 | 924 | 1.8 |
| 81. Prefabr.buildings;sanitary,lighting etc.fixtrs | 8 | 0.0 | 1 | 0.0 | ||||||
| 82. Furniture and parts thereof | 1 | 0.0 | 59 | 0.1 | 38 | 0.1 | 56 | 0.1 | ||
| 83. Travel goods,handbags and sim.containers | 1 | 0.0 | ||||||||
| 84. Articles of apparel and clothing accessories | 1 | 0.0 | 4 | 0.0 | 4 | 0.0 | 4 | 0.0 | 6 | 0.0 |
| 85. Footwear | ||||||||||
| 87. Instruments and apparates n.e.s. | 122 | 0.2 | 404 | 0.7 | 309 | 0.7 | 194 | 0.4 | 712 | 1.4 |
| 88. Photographic equipment,optical goods etc. | 1 | 0.0 | ||||||||
| 89. Miscellaneous manufactured articles,n.e.s. | 25 | 0.0 | 37 | 0.1 | 96 | 0.2 | 219 | 0.4 | 149 | 0.3 |
| 9. Goods not classified elsewhere | ||||||||||
| 93. Special transactions and commodities not classified | ||||||||||
| 97. Gold,non-monetary | ||||||||||
| In Total | 55,203 | 100.0 | 59,315 | 100.0 | 42,387 | 100.0 | 51,342 | 100.0 | 52,580 | 100.0 |
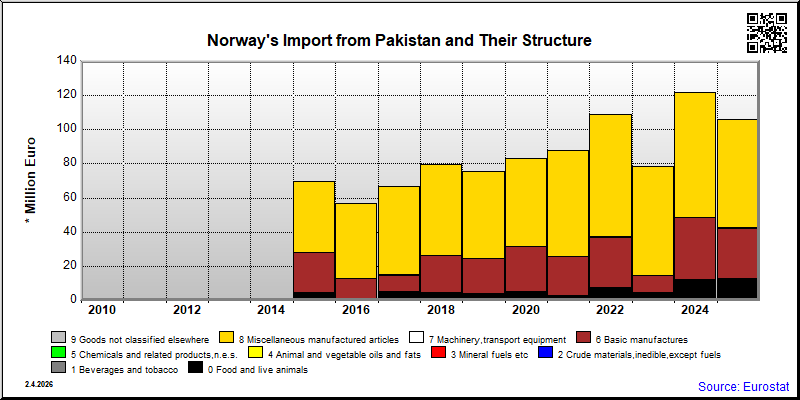
| 2021 | 2022 | 2023 | 2024 | 2025 | ||||||
|---|---|---|---|---|---|---|---|---|---|---|
| 1.000 € | % | 1.000 € | % | 1.000 € | % | 1.000 € | % | 1.000 € | % | |
| 0. Food and live animals | 1,971 | 1.9 | 6,681 | 5.4 | 3,799 | 3.4 | 11,309 | 9.3 | 11,435 | 10.1 |
| 03. Fish and fish preparations | 4 | 0.0 | 13 | 0.0 | 16 | 0.0 | 13 | 0.0 | ||
| 04. Cereals and cereal preparations | 5,429 | 4.8 | ||||||||
| 05. Vegetables and fruit | ||||||||||
| 06. Sugars,sugar preparations and honey | 356 | 0.3 | ||||||||
| 07. Coffee,tea,cocoa,spices | ||||||||||
| 08. Feeding stuff for animals | ||||||||||
| 09. Miscellaneous edible products and preparations | 700 | 0.6 | ||||||||
| 1. Beverages and tobacco | ||||||||||
| 11. Beverages | ||||||||||
| 2. Crude materials,inedible,except fuels | 492 | 0.5 | 783 | 0.6 | 538 | 0.5 | 723 | 0.6 | 759 | 0.7 |
| 21. Hides,skins,furskins,raw | ||||||||||
| 22. Oil seeds,oleaginous fruits | ||||||||||
| 23. Crude rubber (incl.synthetic) | ||||||||||
| 24. Cork and wood | ||||||||||
| 26. Textile fibres and their wastes | 5 | 0.0 | 5 | 0.0 | 4 | 0.0 | 78 | 0.1 | 134 | 0.1 |
| 27. Crude fertilizers and crude minerals | 159 | 0.1 | 200 | 0.2 | 165 | 0.1 | 161 | 0.1 | ||
| 28. Metalliferous ores and metal scrap | 103 | 0.1 | 203 | 0.2 | 4 | 0.0 | 6 | 0.0 | 1 | 0.0 |
| 29. Crude animal,vegetable materials n.e.s. | 40 | 0.0 | ||||||||
| 4. Animal and vegetable oils and fats | 4 | 0.0 | ||||||||
| 42. Fixed vegetable fats and oils | ||||||||||
| 5. Chemicals and related products,n.e.s. | 135 | 0.1 | 178 | 0.1 | 391 | 0.3 | 647 | 0.6 | ||
| 51. Organic chemicals | 599 | 0.5 | ||||||||
| 52. Inorganic chemicals | ||||||||||
| 53. Dyeing,tanning and colouring material | 2 | 0.0 | 19 | 0.0 | 6 | 0.0 | ||||
| 54. Medicinal and pharmaceutical products | 11 | 0.0 | ||||||||
| 55. Perfume,cleaning etc.preparations | 15 | 0.0 | 30 | 0.0 | 19 | 0.0 | ||||
| 57. Plastics in primary forms | ||||||||||
| 58. Plastics in non-primary forms | 11 | 0.0 | 30 | 0.0 | 4 | 0.0 | ||||
| 59. Chemical materials and products,n.e.s. | 1 | 0.0 | 2 | 0.0 | 1 | 0.0 | 3 | 0.0 | ||
| 6. Basic manufactures | 22,826 | 21.5 | 29,310 | 23.7 | 9,854 | 8.7 | 36,116 | 29.6 | 29,265 | 25.9 |
| 61. Leather,dressed fur,etc. | ||||||||||
| 62. Rubber manufactures,n.e.s. | 9 | 0.0 | 91 | 0.1 | 8 | 0.0 | 29 | 0.0 | 20 | 0.0 |
| 63. Wood and cork manufactures | ||||||||||
| 64. Paper,paperboard and articles thereof | 142 | 0.1 | ||||||||
| 65. Textile yarn,fabrics,made up articles,etc. | 22,448 | 21.1 | 28,706 | 23.3 | 9,305 | 8.2 | 35,632 | 29.2 | 28,758 | 25.5 |
| 66. Non-metallic mineral manufactures,n.e.s. | 24 | 0.0 | 78 | 0.1 | ||||||
| 67. Iron and steel | 25 | 0.0 | 13 | 0.0 | ||||||
| 68. Non-ferrous metals | 1 | 0.0 | ||||||||
| 69. Manufactures of metals,n.e.s. | 225 | 0.2 | 231 | 0.2 | 280 | 0.2 | 252 | 0.2 | 243 | 0.2 |
| 7. Machinery,transport equipment | 149 | 0.1 | 161 | 0.1 | 119 | 0.1 | 387 | 0.3 | 701 | 0.6 |
| 71. Power generating machinery and equipment | 2 | 0.0 | 6 | 0.0 | 6 | 0.0 | 6 | 0.0 | 2 | 0.0 |
| 72. Machinery for specialized industries | 6 | 0.0 | 11 | 0.0 | 5 | 0.0 | 5 | 0.0 | ||
| 73. Metal working machinery | 2 | 0.0 | ||||||||
| 74. General industrial machinery n.e.s. | 50 | 0.0 | 42 | 0.0 | 7 | 0.0 | 21 | 0.0 | 306 | 0.3 |
| 75. Office machines and adp machines | 1 | 0.0 | 17 | 0.0 | ||||||
| 76. Telecommunications and sound recording equipment | 3 | 0.0 | 1 | 0.0 | 18 | 0.0 | 7 | 0.0 | ||
| 77. Electric machinery,n.e.s.and parts | 38 | 0.0 | 35 | 0.0 | 14 | 0.0 | 288 | 0.2 | 288 | 0.3 |
| 78. Road vehicles | 31 | 0.0 | 40 | 0.0 | ||||||
| 79. Other transport equipment | 48 | 0.0 | 34 | 0.0 | ||||||
| 8. Miscellaneous manufactured articles | 62,398 | 58.7 | 71,819 | 58.2 | 63,878 | 56.5 | 72,696 | 59.7 | 62,963 | 55.8 |
| 81. Prefabr.buildings;sanitary,lighting etc.fixtrs | 105 | 0.1 | 19 | 0.0 | ||||||
| 82. Furniture and parts thereof | 69 | 0.1 | 98 | 0.1 | 103 | 0.1 | 106 | 0.1 | ||
| 83. Travel goods,handbags and sim.containers | 706 | 0.6 | 734 | 0.6 | 470 | 0.4 | ||||
| 84. Articles of apparel and clothing accessories | 56,411 | 53.1 | 67,091 | 54.3 | 56,064 | 49.6 | 65,148 | 53.5 | 55,333 | 49.1 |
| 85. Footwear | 1,245 | 1.0 | 1,184 | 1.0 | ||||||
| 87. Instruments and apparates n.e.s. | 369 | 0.3 | 543 | 0.4 | 649 | 0.6 | 529 | 0.4 | 606 | 0.5 |
| 88. Photographic equipment,optical goods etc. | 2 | 0.0 | 2 | 0.0 | ||||||
| 89. Miscellaneous manufactured articles,n.e.s. | 4,014 | 3.8 | 2,057 | 1.7 | 5,291 | 4.7 | 5,184 | 4.3 | 5,210 | 4.6 |
| 9. Goods not classified elsewhere | ||||||||||
| 93. Special transactions and commodities not classified | ||||||||||
| 97. Gold,non-monetary | ||||||||||
| In Total | 106,222 | 100.0 | 123,451 | 100.0 | 112,992 | 100.0 | 121,853 | 100.0 | 112,798 | 100.0 |