
| European countries' export and import of goods | SITC |
Data:Eurostat
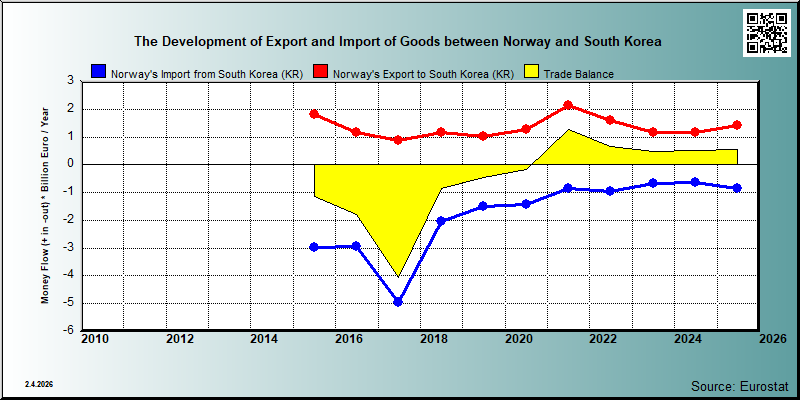
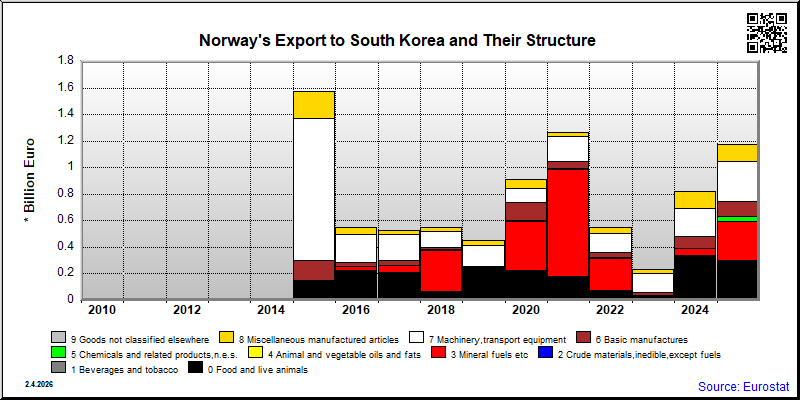
| 2021 | 2022 | 2023 | 2024 | 2025 | ||||||
|---|---|---|---|---|---|---|---|---|---|---|
| 1.000 € | % | 1.000 € | % | 1.000 € | % | 1.000 € | % | 1.000 € | % | |
| 0. Food and live animals | 180,698 | 8.5 | 74,851 | 4.7 | 27,855 | 2.4 | 334,870 | 28.7 | 291,687 | 20.4 |
| 00. Live animals | ||||||||||
| 01. Meat and meat preparations | 9 | 0.0 | 18 | 0.0 | 62 | 0.0 | 34 | 0.0 | ||
| 02. Dairy products and birds' eggs | 878 | 0.0 | 625 | 0.0 | 219 | 0.0 | 529 | 0.0 | 623 | 0.0 |
| 03. Fish and fish preparations | 179,065 | 8.4 | 70,884 | 4.5 | 26,716 | 2.3 | 322,367 | 27.6 | 283,602 | 19.8 |
| 04. Cereals and cereal preparations | 1 | 0.0 | 93 | 0.0 | 236 | 0.0 | ||||
| 05. Vegetables and fruit | 10 | 0.0 | 17 | 0.0 | 1 | 0.0 | ||||
| 06. Sugars,sugar preparations and honey | ||||||||||
| 07. Coffee,tea,cocoa,spices | 1 | 0.0 | 66 | 0.0 | 120 | 0.0 | ||||
| 08. Feeding stuff for animals | 691 | 0.0 | 232 | 0.0 | 895 | 0.1 | 3,032 | 0.3 | ||
| 09. Miscellaneous edible products and preparations | 44 | 0.0 | 3,093 | 0.2 | 7 | 0.0 | 8,720 | 0.7 | 6,741 | 0.5 |
| 1. Beverages and tobacco | 37 | 0.0 | 3 | 0.0 | 130 | 0.0 | 132 | 0.0 | 202 | 0.0 |
| 11. Beverages | 37 | 0.0 | 3 | 0.0 | 130 | 0.0 | 132 | 0.0 | 202 | 0.0 |
| 2. Crude materials,inedible,except fuels | 446 | 0.0 | 309 | 0.0 | 904 | 0.1 | 1,527 | 0.1 | 9,706 | 0.7 |
| 22. Oil seeds,oleaginous fruits | ||||||||||
| 23. Crude rubber (incl.synthetic) | 2 | 0.0 | 98 | 0.0 | 4 | 0.0 | 8 | 0.0 | ||
| 24. Cork and wood | 70 | 0.0 | ||||||||
| 26. Textile fibres and their wastes | 5 | 0.0 | 3 | 0.0 | ||||||
| 27. Crude fertilizers and crude minerals | 87 | 0.0 | 44 | 0.0 | 115 | 0.0 | 76 | 0.0 | 172 | 0.0 |
| 28. Metalliferous ores and metal scrap | 73 | 0.0 | ||||||||
| 29. Crude animal,vegetable materials n.e.s. | 108 | 0.0 | 151 | 0.0 | 381 | 0.0 | 291 | 0.0 | 215 | 0.0 |
| 3. Mineral fuels etc | 808,432 | 37.8 | 243,679 | 15.3 | 8 | 0.0 | 53,344 | 4.6 | 293,735 | 20.5 |
| 33. Petroleum and products | 808,432 | 37.8 | 243,679 | 15.3 | 8 | 0.0 | 53,344 | 4.6 | 293,735 | 20.5 |
| 34. Gas,natural and manufactured | ||||||||||
| 4. Animal and vegetable oils and fats | 20 | 0.0 | 29 | 0.0 | 156 | 0.0 | 21 | 0.0 | 839 | 0.1 |
| 41. Animal oils and fats | 20 | 0.0 | 29 | 0.0 | 156 | 0.0 | 21 | 0.0 | 499 | 0.0 |
| 42. Fixed vegetable fats and oils | ||||||||||
| 5. Chemicals and related products,n.e.s. | 4,296 | 0.2 | 8,464 | 0.5 | 5,350 | 0.5 | 33,070 | 2.3 | ||
| 51. Organic chemicals | 3 | 0.0 | 6 | 0.0 | 85 | 0.0 | 1,608 | 0.1 | ||
| 52. Inorganic chemicals | 830 | 0.0 | 78 | 0.0 | 1,320 | 0.1 | 10,020 | 0.7 | ||
| 53. Dyeing,tanning and colouring material | 42 | 0.0 | 4 | 0.0 | 2 | 0.0 | 862 | 0.1 | ||
| 54. Medicinal and pharmaceutical products | 142 | 0.0 | 5,332 | 0.3 | 1,283 | 0.1 | 9,621 | 0.7 | ||
| 55. Perfume,cleaning etc.preparations | 298 | 0.0 | 157 | 0.0 | 373 | 0.0 | 5,220 | 0.4 | ||
| 57. Plastics in primary forms | 918 | 0.0 | 12 | 0.0 | 99 | 0.0 | 1,543 | 0.1 | ||
| 58. Plastics in non-primary forms | 92 | 0.0 | 266 | 0.0 | 1,346 | 0.1 | 217 | 0.0 | ||
| 59. Chemical materials and products,n.e.s. | 1,970 | 0.1 | 2,608 | 0.2 | 798 | 0.1 | 3,884 | 0.3 | ||
| 6. Basic manufactures | 49,490 | 2.3 | 36,402 | 2.3 | 28,901 | 2.5 | 88,454 | 7.6 | 114,600 | 8.0 |
| 61. Leather,dressed fur,etc. | 1 | 0.0 | 73 | 0.0 | 67 | 0.0 | 164 | 0.0 | 54 | 0.0 |
| 62. Rubber manufactures,n.e.s. | 757 | 0.0 | 1,695 | 0.1 | 1,625 | 0.1 | 803 | 0.1 | 861 | 0.1 |
| 63. Wood and cork manufactures | 5 | 0.0 | 164 | 0.0 | 190 | 0.0 | 155 | 0.0 | 133 | 0.0 |
| 64. Paper,paperboard and articles thereof | 39 | 0.0 | 371 | 0.0 | 581 | 0.0 | 475 | 0.0 | ||
| 65. Textile yarn,fabrics,made up articles,etc. | 733 | 0.0 | 1,363 | 0.1 | 1,565 | 0.1 | 1,640 | 0.1 | 898 | 0.1 |
| 66. Non-metallic mineral manufactures,n.e.s. | 48 | 0.0 | 68 | 0.0 | 408 | 0.0 | 43 | 0.0 | 141 | 0.0 |
| 67. Iron and steel | 3,138 | 0.1 | 1,633 | 0.1 | 1,262 | 0.1 | 14,583 | 1.0 | ||
| 68. Non-ferrous metals | 36,894 | 1.7 | 29,291 | 1.8 | 19,029 | 1.6 | 81,935 | 7.0 | 93,783 | 6.6 |
| 69. Manufactures of metals,n.e.s. | 7,875 | 0.4 | 1,745 | 0.1 | 4,176 | 0.4 | 3,714 | 0.3 | 3,671 | 0.3 |
| 7. Machinery,transport equipment | 191,457 | 9.0 | 140,183 | 8.8 | 138,375 | 11.9 | 213,233 | 18.3 | 306,393 | 21.4 |
| 71. Power generating machinery and equipment | 1,070 | 0.1 | 4,070 | 0.3 | 1,584 | 0.1 | 18,074 | 1.5 | 16,874 | 1.2 |
| 72. Machinery for specialized industries | 82,710 | 3.9 | 12,993 | 0.8 | 5,658 | 0.5 | 11,334 | 1.0 | 10,352 | 0.7 |
| 73. Metal working machinery | 4 | 0.0 | 24 | 0.0 | 129 | 0.0 | 95 | 0.0 | 156 | 0.0 |
| 74. General industrial machinery n.e.s. | 66,810 | 3.1 | 89,435 | 5.6 | 85,291 | 7.3 | 161,231 | 13.8 | 227,971 | 15.9 |
| 75. Office machines and adp machines | 4,456 | 0.2 | 4,407 | 0.3 | 5,068 | 0.4 | 3,964 | 0.3 | 3,681 | 0.3 |
| 76. Telecommunications and sound recording equipment | 7,588 | 0.4 | 9,162 | 0.6 | 8,643 | 0.7 | 5,574 | 0.5 | 6,964 | 0.5 |
| 77. Electric machinery,n.e.s.and parts | 21,270 | 1.0 | 15,966 | 1.0 | 13,576 | 1.2 | 6,136 | 0.5 | 35,961 | 2.5 |
| 78. Road vehicles | 3,789 | 0.2 | 4,060 | 0.3 | 4,815 | 0.4 | 6,538 | 0.6 | 4,401 | 0.3 |
| 79. Other transport equipment | 3,759 | 0.2 | 67 | 0.0 | 13,611 | 1.2 | 287 | 0.0 | 33 | 0.0 |
| 8. Miscellaneous manufactured articles | 28,832 | 1.3 | 42,404 | 2.7 | 32,129 | 2.8 | 126,075 | 10.8 | 126,855 | 8.9 |
| 81. Prefabr.buildings;sanitary,lighting etc.fixtrs | 1,014 | 0.0 | 807 | 0.1 | 1,584 | 0.1 | 2,199 | 0.2 | 1,156 | 0.1 |
| 82. Furniture and parts thereof | 1,019 | 0.0 | 2,687 | 0.2 | 2,790 | 0.2 | 946 | 0.1 | 967 | 0.1 |
| 83. Travel goods,handbags and sim.containers | 28 | 0.0 | 32 | 0.0 | 7 | 0.0 | 81 | 0.0 | 43 | 0.0 |
| 84. Articles of apparel and clothing accessories | 566 | 0.0 | 346 | 0.0 | 1,629 | 0.1 | 1,261 | 0.1 | 534 | 0.0 |
| 85. Footwear | 13 | 0.0 | 21 | 0.0 | 41 | 0.0 | 42 | 0.0 | 36 | 0.0 |
| 87. Instruments and apparates n.e.s. | 25,332 | 1.2 | 38,006 | 2.4 | 24,669 | 2.1 | 116,976 | 10.0 | 122,057 | 8.5 |
| 88. Photographic equipment,optical goods etc. | 15 | 0.0 | 39 | 0.0 | 47 | 0.0 | 40 | 0.0 | 114 | 0.0 |
| 89. Miscellaneous manufactured articles,n.e.s. | 844 | 0.0 | 468 | 0.0 | 1,361 | 0.1 | 4,530 | 0.4 | 1,947 | 0.1 |
| 9. Goods not classified elsewhere | 1 | 0.0 | ||||||||
| 93. Special transactions and commodities not classified | ||||||||||
| In Total | 2,137,703 | 100.0 | 1,592,695 | 100.0 | 1,162,299 | 100.0 | 1,166,702 | 100.0 | 1,430,246 | 100.0 |
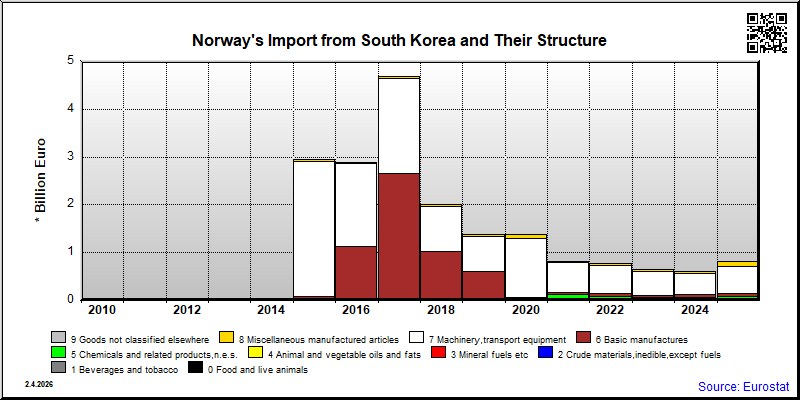
| 2021 | 2022 | 2023 | 2024 | 2025 | ||||||
|---|---|---|---|---|---|---|---|---|---|---|
| 1.000 € | % | 1.000 € | % | 1.000 € | % | 1.000 € | % | 1.000 € | % | |
| 0. Food and live animals | 3,437 | 0.4 | 7,421 | 0.8 | 8,513 | 1.2 | 8,819 | 1.4 | 9,689 | 1.1 |
| 00. Live animals | ||||||||||
| 01. Meat and meat preparations | 1 | 0.0 | 14 | 0.0 | ||||||
| 02. Dairy products and birds' eggs | 1 | 0.0 | 2 | 0.0 | 11 | 0.0 | 16 | 0.0 | 83 | 0.0 |
| 03. Fish and fish preparations | 141 | 0.0 | 176 | 0.0 | 103 | 0.0 | 949 | 0.1 | 466 | 0.1 |
| 04. Cereals and cereal preparations | 82 | 0.0 | 620 | 0.1 | 1,016 | 0.1 | ||||
| 05. Vegetables and fruit | 638 | 0.1 | 1,080 | 0.1 | 1,528 | 0.2 | ||||
| 06. Sugars,sugar preparations and honey | ||||||||||
| 07. Coffee,tea,cocoa,spices | 35 | 0.0 | 40 | 0.0 | 72 | 0.0 | 126 | 0.0 | 114 | 0.0 |
| 08. Feeding stuff for animals | 3 | 0.0 | 1 | 0.0 | ||||||
| 09. Miscellaneous edible products and preparations | 2,529 | 0.3 | 5,761 | 0.6 | 7,175 | 1.0 | 5,723 | 0.9 | 6,416 | 0.7 |
| 1. Beverages and tobacco | 225 | 0.0 | 447 | 0.0 | 444 | 0.1 | 423 | 0.1 | 356 | 0.0 |
| 11. Beverages | 225 | 0.0 | 447 | 0.0 | 444 | 0.1 | 423 | 0.1 | 356 | 0.0 |
| 2. Crude materials,inedible,except fuels | 932 | 0.1 | 4,855 | 0.5 | 3,473 | 0.5 | 2,730 | 0.4 | 3,033 | 0.4 |
| 22. Oil seeds,oleaginous fruits | ||||||||||
| 23. Crude rubber (incl.synthetic) | 2,631 | 0.3 | 2,302 | 0.3 | 1,144 | 0.2 | 1,679 | 0.2 | ||
| 24. Cork and wood | ||||||||||
| 26. Textile fibres and their wastes | 212 | 0.0 | 1,872 | 0.2 | 1,254 | 0.1 | ||||
| 27. Crude fertilizers and crude minerals | 1 | 0.0 | 1 | 0.0 | 1 | 0.0 | 1 | 0.0 | 3 | 0.0 |
| 28. Metalliferous ores and metal scrap | 56 | 0.0 | ||||||||
| 29. Crude animal,vegetable materials n.e.s. | 193 | 0.0 | 291 | 0.0 | 40 | 0.0 | 105 | 0.0 | 92 | 0.0 |
| 3. Mineral fuels etc | 74 | 0.0 | 47 | 0.0 | 48 | 0.0 | 1,315 | 0.2 | 8,962 | 1.0 |
| 33. Petroleum and products | 73 | 0.0 | 37 | 0.0 | 48 | 0.0 | 1,315 | 0.2 | 8,906 | 1.0 |
| 34. Gas,natural and manufactured | ||||||||||
| 4. Animal and vegetable oils and fats | 706 | 0.1 | 1,613 | 0.2 | 292 | 0.0 | 4,370 | 0.7 | 707 | 0.1 |
| 41. Animal oils and fats | 705 | 0.1 | 1,575 | 0.2 | 263 | 0.0 | 4,334 | 0.7 | 639 | 0.1 |
| 42. Fixed vegetable fats and oils | ||||||||||
| 5. Chemicals and related products,n.e.s. | 123,425 | 14.3 | 75,146 | 8.0 | 43,598 | 6.3 | 69,775 | 8.1 | ||
| 51. Organic chemicals | 543 | 0.1 | 868 | 0.1 | 994 | 0.1 | 4,610 | 0.5 | ||
| 52. Inorganic chemicals | 391 | 0.0 | 4,721 | 0.5 | 8,882 | 1.3 | 3,601 | 0.4 | ||
| 53. Dyeing,tanning and colouring material | 1,053 | 0.1 | 1,702 | 0.2 | 2,587 | 0.4 | 2,526 | 0.3 | ||
| 54. Medicinal and pharmaceutical products | 89,198 | 10.3 | 44,676 | 4.7 | 701 | 0.1 | 9,185 | 1.1 | ||
| 55. Perfume,cleaning etc.preparations | 13,281 | 1.5 | 16,907 | 1.8 | 24,562 | 3.6 | 43,475 | 5.0 | ||
| 57. Plastics in primary forms | 2,493 | 0.3 | 2,825 | 0.3 | 2,059 | 0.3 | 2,060 | 0.2 | ||
| 58. Plastics in non-primary forms | 3,778 | 0.4 | 3,201 | 0.3 | 3,730 | 0.5 | 4,082 | 0.5 | ||
| 59. Chemical materials and products,n.e.s. | 12,688 | 1.5 | 245 | 0.0 | 83 | 0.0 | 236 | 0.0 | ||
| 6. Basic manufactures | 42,919 | 5.0 | 49,395 | 5.2 | 54,234 | 7.9 | 60,533 | 9.5 | 45,162 | 5.2 |
| 61. Leather,dressed fur,etc. | 443 | 0.1 | 42 | 0.0 | 30 | 0.0 | 188 | 0.0 | 88 | 0.0 |
| 62. Rubber manufactures,n.e.s. | 15,246 | 1.8 | 19,596 | 2.1 | 14,637 | 2.1 | 16,928 | 2.6 | 16,974 | 2.0 |
| 63. Wood and cork manufactures | 66 | 0.0 | 312 | 0.0 | 135 | 0.0 | 103 | 0.0 | 11 | 0.0 |
| 64. Paper,paperboard and articles thereof | 132 | 0.0 | 182 | 0.0 | 150 | 0.0 | 356 | 0.0 | ||
| 65. Textile yarn,fabrics,made up articles,etc. | 3,495 | 0.4 | 5,771 | 0.6 | 5,135 | 0.7 | 6,293 | 1.0 | 4,357 | 0.5 |
| 66. Non-metallic mineral manufactures,n.e.s. | 3,392 | 0.4 | 4,975 | 0.5 | 1,496 | 0.2 | 4,099 | 0.6 | 2,263 | 0.3 |
| 67. Iron and steel | 4,615 | 0.5 | 4,167 | 0.4 | 1,932 | 0.3 | 9,022 | 1.0 | ||
| 68. Non-ferrous metals | 5,573 | 0.6 | 1,764 | 0.2 | 342 | 0.0 | 372 | 0.1 | 546 | 0.1 |
| 69. Manufactures of metals,n.e.s. | 9,958 | 1.2 | 12,586 | 1.3 | 30,379 | 4.4 | 21,480 | 3.4 | 11,544 | 1.3 |
| 7. Machinery,transport equipment | 626,267 | 72.5 | 593,504 | 63.0 | 496,372 | 72.1 | 446,243 | 69.7 | 571,212 | 66.0 |
| 71. Power generating machinery and equipment | 5,267 | 0.6 | 6,709 | 0.7 | 6,307 | 0.9 | 6,957 | 1.1 | 8,076 | 0.9 |
| 72. Machinery for specialized industries | 46,054 | 5.3 | 64,977 | 6.9 | 89,786 | 13.1 | 89,428 | 14.0 | 81,904 | 9.5 |
| 73. Metal working machinery | 2,690 | 0.3 | 2,572 | 0.3 | 3,531 | 0.5 | 6,942 | 1.1 | 3,402 | 0.4 |
| 74. General industrial machinery n.e.s. | 19,092 | 2.2 | 17,045 | 1.8 | 33,139 | 4.8 | 37,189 | 5.8 | 23,335 | 2.7 |
| 75. Office machines and adp machines | 11,684 | 1.4 | 14,086 | 1.5 | 12,755 | 1.9 | 8,432 | 1.3 | 8,690 | 1.0 |
| 76. Telecommunications and sound recording equipment | 26,749 | 3.1 | 29,671 | 3.1 | 28,581 | 4.2 | 32,159 | 5.0 | 28,247 | 3.3 |
| 77. Electric machinery,n.e.s.and parts | 73,483 | 8.5 | 85,208 | 9.0 | 63,937 | 9.3 | 99,919 | 15.6 | 128,420 | 14.8 |
| 78. Road vehicles | 372,905 | 43.2 | 373,119 | 39.6 | 258,267 | 37.5 | 164,605 | 25.7 | 288,961 | 33.4 |
| 79. Other transport equipment | 68,344 | 7.9 | 117 | 0.0 | 70 | 0.0 | 610 | 0.1 | 179 | 0.0 |
| 8. Miscellaneous manufactured articles | 25,633 | 3.0 | 34,571 | 3.7 | 33,905 | 4.9 | 36,428 | 5.7 | 108,944 | 12.6 |
| 81. Prefabr.buildings;sanitary,lighting etc.fixtrs | 1,828 | 0.2 | 2,037 | 0.2 | 1,935 | 0.3 | 1,449 | 0.2 | 1,325 | 0.2 |
| 82. Furniture and parts thereof | 234 | 0.0 | 672 | 0.1 | 355 | 0.1 | 412 | 0.1 | 455 | 0.1 |
| 83. Travel goods,handbags and sim.containers | 394 | 0.0 | 372 | 0.0 | 305 | 0.0 | 323 | 0.1 | 344 | 0.0 |
| 84. Articles of apparel and clothing accessories | 2,505 | 0.3 | 2,917 | 0.3 | 2,731 | 0.4 | 2,019 | 0.3 | 1,574 | 0.2 |
| 85. Footwear | 2,573 | 0.3 | 3,240 | 0.3 | 1,434 | 0.2 | 1,094 | 0.2 | 1,598 | 0.2 |
| 87. Instruments and apparates n.e.s. | 7,100 | 0.8 | 13,575 | 1.4 | 16,356 | 2.4 | 15,851 | 2.5 | 12,115 | 1.4 |
| 88. Photographic equipment,optical goods etc. | 1,206 | 0.1 | 818 | 0.1 | 821 | 0.1 | 1,482 | 0.2 | 493 | 0.1 |
| 89. Miscellaneous manufactured articles,n.e.s. | 9,793 | 1.1 | 10,941 | 1.2 | 9,969 | 1.4 | 13,798 | 2.2 | 91,040 | 10.5 |
| 9. Goods not classified elsewhere | 1 | 0.0 | ||||||||
| 93. Special transactions and commodities not classified | ||||||||||
| In Total | 863,384 | 100.0 | 942,139 | 100.0 | 688,004 | 100.0 | 640,409 | 100.0 | 866,047 | 100.0 |