
| European countries' export and import of goods | SITC |
Data:Eurostat
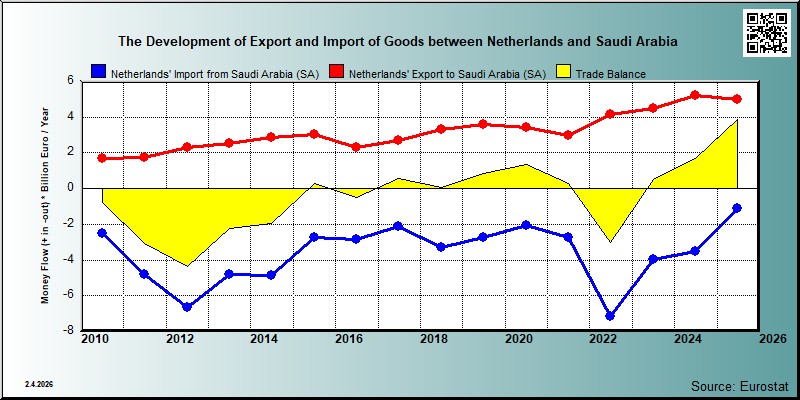

| 2021 | 2022 | 2023 | 2024 | 2025 | ||||||
|---|---|---|---|---|---|---|---|---|---|---|
| 1.000 € | % | 1.000 € | % | 1.000 € | % | 1.000 € | % | 1.000 € | % | |
| 0. Food and live animals | 482,779 | 16.1 | 648,959 | 15.6 | 674,585 | 15.0 | 693,630 | 13.3 | 647,339 | 13.0 |
| 00. Live animals | 4,422 | 0.1 | 9,820 | 0.2 | 17,281 | 0.4 | 6,691 | 0.1 | 18,017 | 0.4 |
| 02. Dairy products and birds' eggs | 171,835 | 5.7 | 195,286 | 4.7 | 188,141 | 4.2 | 195,843 | 3.8 | 167,959 | 3.4 |
| 03. Fish and fish preparations | 1,374 | 0.0 | 2,485 | 0.1 | 890 | 0.0 | 1,088 | 0.0 | 730 | 0.0 |
| 04. Cereals and cereal preparations | 21,471 | 0.7 | 22,954 | 0.6 | 22,062 | 0.5 | 21,812 | 0.4 | 19,610 | 0.4 |
| 05. Vegetables and fruit | 140,079 | 4.7 | 198,526 | 4.8 | 216,028 | 4.8 | 230,715 | 4.4 | 190,826 | 3.8 |
| 06. Sugars,sugar preparations and honey | 6,684 | 0.2 | 6,258 | 0.2 | 3,673 | 0.1 | 2,506 | 0.0 | 3,339 | 0.1 |
| 07. Coffee,tea,cocoa,spices | 59,381 | 2.0 | 114,028 | 2.7 | 111,838 | 2.5 | 111,321 | 2.1 | 114,312 | 2.3 |
| 08. Feeding stuff for animals | 10,624 | 0.4 | 15,393 | 0.4 | 14,873 | 0.3 | 16,836 | 0.3 | 28,383 | 0.6 |
| 09. Miscellaneous edible products and preparations | 59,407 | 2.0 | 77,186 | 1.9 | 95,130 | 2.1 | 103,230 | 2.0 | 104,041 | 2.1 |
| 1. Beverages and tobacco | 17,300 | 0.6 | 24,255 | 0.6 | 84,623 | 1.9 | 151,574 | 2.9 | 125,246 | 2.5 |
| 11. Beverages | 16,585 | 0.6 | 23,478 | 0.6 | 18,732 | 0.4 | 20,881 | 0.4 | 25,740 | 0.5 |
| 12. Tobacco and tobacco manufactures | 715 | 0.0 | 777 | 0.0 | 99,506 | 2.0 | ||||
| 2. Crude materials,inedible,except fuels | 50,743 | 1.7 | 62,491 | 1.5 | 61,016 | 1.4 | 80,237 | 1.5 | 81,026 | 1.6 |
| 21. Hides,skins,furskins,raw | ||||||||||
| 22. Oil seeds,oleaginous fruits | 1,438 | 0.0 | 1,877 | 0.0 | 1,611 | 0.0 | 1,861 | 0.0 | 1,522 | 0.0 |
| 23. Crude rubber (incl.synthetic) | 1,240 | 0.0 | 3,224 | 0.1 | 1,709 | 0.0 | 1,207 | 0.0 | 2,005 | 0.0 |
| 24. Cork and wood | 285 | 0.0 | 413 | 0.0 | 672 | 0.0 | 168 | 0.0 | ||
| 26. Textile fibres and their wastes | 42 | 0.0 | 79 | 0.0 | 122 | 0.0 | 262 | 0.0 | 210 | 0.0 |
| 27. Crude fertilizers and crude minerals | 1,245 | 0.0 | 1,819 | 0.0 | 2,178 | 0.0 | 4,163 | 0.1 | 4,134 | 0.1 |
| 28. Metalliferous ores and metal scrap | 1,585 | 0.1 | 50 | 0.0 | 1,308 | 0.0 | 2,278 | 0.0 | 1,292 | 0.0 |
| 29. Crude animal,vegetable materials n.e.s. | 42,231 | 1.4 | 41,927 | 1.0 | 46,979 | 1.0 | 54,343 | 1.0 | 64,515 | 1.3 |
| 3. Mineral fuels etc | 273,855 | 9.1 | 756,544 | 18.2 | 576,648 | 12.8 | 682,818 | 13.1 | 584,426 | 11.7 |
| 32. Coal,coke and briquettes | 704 | 0.0 | 279 | 0.0 | 324 | 0.0 | 160 | 0.0 | ||
| 33. Petroleum and products | 273,660 | 9.1 | 755,819 | 18.2 | 576,361 | 12.8 | 682,473 | 13.1 | 584,206 | 11.7 |
| 4. Animal and vegetable oils and fats | 1,161 | 0.0 | 2,488 | 0.1 | 1,698 | 0.0 | 2,228 | 0.0 | 3,248 | 0.1 |
| 42. Fixed vegetable fats and oils | 525 | 0.0 | 828 | 0.0 | 771 | 0.0 | 1,133 | 0.0 | 1,043 | 0.0 |
| 43. Processed animal or vegetable oils,etc. | 636 | 0.0 | 1,660 | 0.0 | 925 | 0.0 | 1,052 | 0.0 | 2,205 | 0.0 |
| 5. Chemicals and related products,n.e.s. | 706,882 | 23.6 | 912,290 | 21.9 | 983,822 | 21.8 | 1,151,684 | 22.1 | 1,243,060 | 24.9 |
| 51. Organic chemicals | 25,458 | 0.9 | 35,995 | 0.9 | 36,948 | 0.8 | 47,141 | 0.9 | 26,478 | 0.5 |
| 52. Inorganic chemicals | 16,465 | 0.5 | 11,599 | 0.3 | 9,033 | 0.2 | 15,148 | 0.3 | 9,029 | 0.2 |
| 53. Dyeing,tanning and colouring material | 14,513 | 0.5 | 17,486 | 0.4 | 19,798 | 0.4 | 32,455 | 0.6 | 24,433 | 0.5 |
| 54. Medicinal and pharmaceutical products | 429,189 | 14.3 | 589,527 | 14.2 | 646,563 | 14.3 | 771,406 | 14.8 | 915,194 | 18.3 |
| 55. Perfume,cleaning etc.preparations | 30,723 | 1.0 | 46,697 | 1.1 | 94,858 | 2.1 | 99,239 | 1.9 | 90,383 | 1.8 |
| 56. Fertilizers,manufactured | 8,317 | 0.2 | 4,537 | 0.1 | 6,109 | 0.1 | ||||
| 57. Plastics in primary forms | 99,746 | 3.3 | 76,252 | 1.8 | 48,009 | 1.1 | 51,691 | 1.0 | 49,069 | 1.0 |
| 58. Plastics in non-primary forms | 11,480 | 0.4 | 21,381 | 0.5 | 18,919 | 0.4 | 22,585 | 0.4 | 29,656 | 0.6 |
| 59. Chemical materials and products,n.e.s. | 75,201 | 2.5 | 105,037 | 2.5 | 105,156 | 2.3 | 105,911 | 2.0 | 92,166 | 1.8 |
| 6. Basic manufactures | 97,791 | 3.3 | 126,743 | 3.0 | 118,552 | 2.6 | 133,344 | 2.6 | 147,374 | 3.0 |
| 61. Leather,dressed fur,etc. | 31 | 0.0 | 35 | 0.0 | 130 | 0.0 | 219 | 0.0 | 46 | 0.0 |
| 62. Rubber manufactures,n.e.s. | 8,272 | 0.3 | 9,316 | 0.2 | 11,906 | 0.3 | 15,605 | 0.3 | 15,512 | 0.3 |
| 63. Wood and cork manufactures | 628 | 0.0 | 907 | 0.0 | 1,217 | 0.0 | 1,874 | 0.0 | 2,071 | 0.0 |
| 64. Paper,paperboard and articles thereof | 9,157 | 0.3 | 17,674 | 0.4 | 8,798 | 0.2 | 8,714 | 0.2 | 7,276 | 0.1 |
| 65. Textile yarn,fabrics,made up articles,etc. | 7,647 | 0.3 | 9,732 | 0.2 | 12,754 | 0.3 | 15,148 | 0.3 | 11,965 | 0.2 |
| 66. Non-metallic mineral manufactures,n.e.s. | 9,688 | 0.3 | 14,357 | 0.3 | 20,774 | 0.5 | 21,820 | 0.4 | 26,526 | 0.5 |
| 67. Iron and steel | 31,225 | 1.0 | 28,681 | 0.7 | 14,320 | 0.3 | 15,399 | 0.3 | 23,434 | 0.5 |
| 68. Non-ferrous metals | 4,815 | 0.2 | 9,705 | 0.2 | 3,423 | 0.1 | 7,744 | 0.1 | 3,401 | 0.1 |
| 69. Manufactures of metals,n.e.s. | 26,327 | 0.9 | 36,336 | 0.9 | 45,230 | 1.0 | 46,820 | 0.9 | 57,144 | 1.1 |
| 7. Machinery,transport equipment | 920,703 | 30.7 | 1,039,392 | 25.0 | 1,316,335 | 29.2 | 1,694,148 | 32.5 | 1,507,314 | 30.2 |
| 71. Power generating machinery and equipment | 37,623 | 1.3 | 40,674 | 1.0 | 87,462 | 1.9 | 121,040 | 2.3 | 99,045 | 2.0 |
| 72. Machinery for specialized industries | 99,643 | 3.3 | 98,028 | 2.4 | 144,576 | 3.2 | 178,546 | 3.4 | 132,995 | 2.7 |
| 73. Metal working machinery | 6,850 | 0.2 | 6,778 | 0.2 | 10,975 | 0.2 | 11,070 | 0.2 | 8,321 | 0.2 |
| 74. General industrial machinery n.e.s. | 146,656 | 4.9 | 193,794 | 4.7 | 232,480 | 5.2 | 311,082 | 6.0 | 270,990 | 5.4 |
| 75. Office machines and adp machines | 171,744 | 5.7 | 311,104 | 7.5 | 383,357 | 8.5 | 511,758 | 9.8 | 338,954 | 6.8 |
| 76. Telecommunications and sound recording equipment | 283,791 | 9.5 | 181,935 | 4.4 | 215,614 | 4.8 | 269,368 | 5.2 | 392,537 | 7.9 |
| 77. Electric machinery,n.e.s.and parts | 110,981 | 3.7 | 151,412 | 3.6 | 162,871 | 3.6 | 201,044 | 3.9 | 201,895 | 4.0 |
| 78. Road vehicles | 44,301 | 1.5 | 50,102 | 1.2 | 71,549 | 1.6 | 86,474 | 1.7 | 53,570 | 1.1 |
| 79. Other transport equipment | 19,112 | 0.6 | 5,564 | 0.1 | 7,451 | 0.2 | 3,766 | 0.1 | 9,007 | 0.2 |
| 8. Miscellaneous manufactured articles | 405,452 | 13.5 | 554,616 | 13.3 | 680,513 | 15.1 | 606,122 | 11.6 | 633,530 | 12.7 |
| 81. Prefabr.buildings;sanitary,lighting etc.fixtrs | 18,939 | 0.6 | 17,536 | 0.4 | 13,120 | 0.3 | 39,010 | 0.7 | 13,375 | 0.3 |
| 82. Furniture and parts thereof | 12,854 | 0.4 | 8,951 | 0.2 | 7,085 | 0.2 | 7,168 | 0.1 | 5,334 | 0.1 |
| 83. Travel goods,handbags and sim.containers | 1,452 | 0.0 | 2,813 | 0.1 | 2,813 | 0.1 | 3,665 | 0.1 | 3,699 | 0.1 |
| 84. Articles of apparel and clothing accessories | 11,219 | 0.4 | 28,464 | 0.7 | 6,962 | 0.2 | 7,902 | 0.2 | 14,871 | 0.3 |
| 85. Footwear | 1,275 | 0.0 | 5,477 | 0.1 | 6,104 | 0.1 | 11,110 | 0.2 | 5,105 | 0.1 |
| 87. Instruments and apparates n.e.s. | 224,240 | 7.5 | 282,911 | 6.8 | 296,630 | 6.6 | 287,520 | 5.5 | 293,471 | 5.9 |
| 88. Photographic equipment,optical goods etc. | 4,565 | 0.2 | 5,693 | 0.1 | 6,447 | 0.1 | 3,557 | 0.1 | 4,730 | 0.1 |
| 89. Miscellaneous manufactured articles,n.e.s. | 130,908 | 4.4 | 202,772 | 4.9 | 341,352 | 7.6 | 246,189 | 4.7 | 292,945 | 5.9 |
| 9. Goods not classified elsewhere | 3,361 | 0.1 | 1,795 | 0.0 | 3,753 | 0.1 | ||||
| 93. Special transactions and commodities not classified | 251 | 0.0 | ||||||||
| 96. Coin (not gold coin or legal) | ||||||||||
| 97. Gold,non-monetary | ||||||||||
| In Total | 2,994,696 | 100.0 | 4,159,651 | 100.0 | 4,509,345 | 100.0 | 5,218,317 | 100.0 | 4,993,089 | 100.0 |

| 2021 | 2022 | 2023 | 2024 | 2025 | ||||||
|---|---|---|---|---|---|---|---|---|---|---|
| 1.000 € | % | 1.000 € | % | 1.000 € | % | 1.000 € | % | 1.000 € | % | |
| 0. Food and live animals | 3,884 | 0.1 | 3,097 | 0.0 | 3,233 | 0.1 | 5,248 | 0.1 | 5,772 | 0.5 |
| 00. Live animals | 18 | 0.0 | 22 | 0.0 | 55 | 0.0 | 122 | 0.0 | 84 | 0.0 |
| 02. Dairy products and birds' eggs | 42 | 0.0 | 480 | 0.0 | 1 | 0.0 | 5 | 0.0 | ||
| 03. Fish and fish preparations | 35 | 0.0 | 139 | 0.0 | 436 | 0.0 | 63 | 0.0 | ||
| 04. Cereals and cereal preparations | 741 | 0.0 | 804 | 0.0 | 322 | 0.0 | 1,270 | 0.0 | 325 | 0.0 |
| 05. Vegetables and fruit | 2,671 | 0.1 | 2,079 | 0.0 | 2,115 | 0.1 | 2,709 | 0.1 | 4,593 | 0.4 |
| 06. Sugars,sugar preparations and honey | 3 | 0.0 | 6 | 0.0 | 2 | 0.0 | 523 | 0.0 | 7 | 0.0 |
| 07. Coffee,tea,cocoa,spices | 250 | 0.0 | 56 | 0.0 | 20 | 0.0 | 23 | 0.0 | 347 | 0.0 |
| 08. Feeding stuff for animals | 2 | 0.0 | ||||||||
| 09. Miscellaneous edible products and preparations | 201 | 0.0 | 54 | 0.0 | 99 | 0.0 | 163 | 0.0 | 347 | 0.0 |
| 1. Beverages and tobacco | 313 | 0.0 | 663 | 0.0 | 808 | 0.0 | 661 | 0.0 | 282 | 0.0 |
| 11. Beverages | 311 | 0.0 | 663 | 0.0 | 808 | 0.0 | 661 | 0.0 | 282 | 0.0 |
| 12. Tobacco and tobacco manufactures | 2 | 0.0 | ||||||||
| 2. Crude materials,inedible,except fuels | 6,808 | 0.3 | 11,646 | 0.2 | 14,998 | 0.4 | 13,664 | 0.4 | 36,804 | 3.3 |
| 21. Hides,skins,furskins,raw | ||||||||||
| 22. Oil seeds,oleaginous fruits | 2 | 0.0 | 1 | 0.0 | 51 | 0.0 | 64 | 0.0 | ||
| 23. Crude rubber (incl.synthetic) | 840 | 0.0 | 7,278 | 0.1 | 6,591 | 0.2 | 7,551 | 0.2 | 9,588 | 0.9 |
| 24. Cork and wood | 1 | 0.0 | 14 | 0.0 | ||||||
| 26. Textile fibres and their wastes | 1 | 0.0 | 1 | 0.0 | 2 | 0.0 | 4 | 0.0 | 5 | 0.0 |
| 27. Crude fertilizers and crude minerals | 375 | 0.0 | 1,038 | 0.0 | 3,468 | 0.1 | 1,439 | 0.0 | 366 | 0.0 |
| 28. Metalliferous ores and metal scrap | 5,575 | 0.2 | 3,310 | 0.0 | 4,876 | 0.1 | 3,972 | 0.1 | 26,750 | 2.4 |
| 29. Crude animal,vegetable materials n.e.s. | 15 | 0.0 | 17 | 0.0 | 8 | 0.0 | 634 | 0.0 | 81 | 0.0 |
| 3. Mineral fuels etc | 2,013,910 | 74.3 | 6,239,717 | 87.1 | 3,375,663 | 84.6 | 3,089,419 | 87.3 | 648,019 | 58.6 |
| 32. Coal,coke and briquettes | 6 | 0.0 | ||||||||
| 33. Petroleum and products | 2,013,910 | 74.3 | 6,239,717 | 87.1 | 3,375,662 | 84.6 | 3,089,413 | 87.3 | 648,019 | 58.6 |
| 4. Animal and vegetable oils and fats | 62,254 | 2.3 | 115,051 | 1.6 | 83,429 | 2.1 | 89,049 | 2.5 | 121,581 | 11.0 |
| 42. Fixed vegetable fats and oils | 1 | 0.0 | 3 | 0.0 | 1 | 0.0 | 364 | 0.0 | ||
| 43. Processed animal or vegetable oils,etc. | 62,253 | 2.3 | 115,048 | 1.6 | 83,428 | 2.1 | 88,685 | 2.5 | 121,581 | 11.0 |
| 5. Chemicals and related products,n.e.s. | 567,345 | 20.9 | 607,337 | 8.5 | 334,833 | 8.4 | 279,499 | 7.9 | 215,063 | 19.4 |
| 51. Organic chemicals | 266,059 | 9.8 | 443,948 | 6.2 | 241,600 | 6.1 | 198,448 | 5.6 | 175,347 | 15.8 |
| 52. Inorganic chemicals | 94 | 0.0 | 527 | 0.0 | 5,918 | 0.1 | 4 | 0.0 | 221 | 0.0 |
| 53. Dyeing,tanning and colouring material | 1,549 | 0.1 | 2,624 | 0.0 | 1,920 | 0.0 | 1,015 | 0.0 | 144 | 0.0 |
| 54. Medicinal and pharmaceutical products | 8 | 0.0 | 277 | 0.0 | 127 | 0.0 | 129 | 0.0 | 332 | 0.0 |
| 55. Perfume,cleaning etc.preparations | 393 | 0.0 | 671 | 0.0 | 1,573 | 0.0 | 1,433 | 0.0 | 1,556 | 0.1 |
| 56. Fertilizers,manufactured | 3 | 0.0 | ||||||||
| 57. Plastics in primary forms | 293,788 | 10.8 | 144,683 | 2.0 | 70,159 | 1.8 | 65,113 | 1.8 | 17,068 | 1.5 |
| 58. Plastics in non-primary forms | 2,037 | 0.1 | 1,446 | 0.0 | 1,746 | 0.0 | 720 | 0.0 | 998 | 0.1 |
| 59. Chemical materials and products,n.e.s. | 3,417 | 0.1 | 13,159 | 0.2 | 11,787 | 0.3 | 12,635 | 0.4 | 19,398 | 1.8 |
| 6. Basic manufactures | 34,506 | 1.3 | 129,865 | 1.8 | 59,203 | 1.5 | 28,976 | 0.8 | 48,985 | 4.4 |
| 61. Leather,dressed fur,etc. | 7 | 0.0 | 15 | 0.0 | 4 | 0.0 | 81 | 0.0 | 8 | 0.0 |
| 62. Rubber manufactures,n.e.s. | 686 | 0.0 | 2,127 | 0.0 | 1,819 | 0.0 | 1,100 | 0.0 | 573 | 0.1 |
| 63. Wood and cork manufactures | 4 | 0.0 | 21 | 0.0 | 7 | 0.0 | 158 | 0.0 | 227 | 0.0 |
| 64. Paper,paperboard and articles thereof | 53 | 0.0 | 91 | 0.0 | 54 | 0.0 | 6 | 0.0 | 76 | 0.0 |
| 65. Textile yarn,fabrics,made up articles,etc. | 9,867 | 0.4 | 11,383 | 0.2 | 8,876 | 0.2 | 7,102 | 0.2 | 7,707 | 0.7 |
| 66. Non-metallic mineral manufactures,n.e.s. | 1,365 | 0.1 | 540 | 0.0 | 828 | 0.0 | 1,673 | 0.0 | 1,496 | 0.1 |
| 67. Iron and steel | 4,731 | 0.2 | 11,759 | 0.2 | 1,146 | 0.0 | 5,665 | 0.2 | 7,317 | 0.7 |
| 68. Non-ferrous metals | 11,526 | 0.4 | 100,123 | 1.4 | 44,824 | 1.1 | 12,035 | 0.3 | 25,937 | 2.3 |
| 69. Manufactures of metals,n.e.s. | 6,265 | 0.2 | 3,807 | 0.1 | 1,646 | 0.0 | 1,156 | 0.0 | 5,644 | 0.5 |
| 7. Machinery,transport equipment | 12,766 | 0.5 | 48,483 | 0.7 | 105,256 | 2.6 | 16,029 | 0.5 | 16,179 | 1.5 |
| 71. Power generating machinery and equipment | 4,835 | 0.2 | 27,728 | 0.4 | 75,150 | 1.9 | 6,425 | 0.2 | 3,583 | 0.3 |
| 72. Machinery for specialized industries | 654 | 0.0 | 848 | 0.0 | 906 | 0.0 | 2,413 | 0.1 | 1,862 | 0.2 |
| 73. Metal working machinery | 27 | 0.0 | 43 | 0.0 | 13 | 0.0 | 73 | 0.0 | 16 | 0.0 |
| 74. General industrial machinery n.e.s. | 1,641 | 0.1 | 4,103 | 0.1 | 3,725 | 0.1 | 1,266 | 0.0 | 1,383 | 0.1 |
| 75. Office machines and adp machines | 541 | 0.0 | 394 | 0.0 | 1,369 | 0.0 | 431 | 0.0 | 1,744 | 0.2 |
| 76. Telecommunications and sound recording equipment | 2,728 | 0.1 | 997 | 0.0 | 1,573 | 0.0 | 486 | 0.0 | 4,639 | 0.4 |
| 77. Electric machinery,n.e.s.and parts | 955 | 0.0 | 8,090 | 0.1 | 21,990 | 0.6 | 1,908 | 0.1 | 1,727 | 0.2 |
| 78. Road vehicles | 351 | 0.0 | 119 | 0.0 | 388 | 0.0 | 2,533 | 0.1 | 751 | 0.1 |
| 79. Other transport equipment | 1,034 | 0.0 | 6,161 | 0.1 | 141 | 0.0 | 495 | 0.0 | 474 | 0.0 |
| 8. Miscellaneous manufactured articles | 9,241 | 0.3 | 9,902 | 0.1 | 13,771 | 0.3 | 15,673 | 0.4 | 13,482 | 1.2 |
| 81. Prefabr.buildings;sanitary,lighting etc.fixtrs | 8 | 0.0 | 1 | 0.0 | 10 | 0.0 | 20 | 0.0 | 39 | 0.0 |
| 82. Furniture and parts thereof | 34 | 0.0 | 17 | 0.0 | 18 | 0.0 | 55 | 0.0 | 74 | 0.0 |
| 83. Travel goods,handbags and sim.containers | 644 | 0.0 | 623 | 0.0 | 1,022 | 0.0 | 924 | 0.0 | 536 | 0.0 |
| 84. Articles of apparel and clothing accessories | 3,026 | 0.1 | 2,618 | 0.0 | 4,557 | 0.1 | 3,691 | 0.1 | 1,381 | 0.1 |
| 85. Footwear | 1,488 | 0.1 | 1,479 | 0.0 | 3,006 | 0.1 | 2,445 | 0.1 | 1,307 | 0.1 |
| 87. Instruments and apparates n.e.s. | 1,268 | 0.0 | 1,965 | 0.0 | 2,781 | 0.1 | 3,308 | 0.1 | 4,023 | 0.4 |
| 88. Photographic equipment,optical goods etc. | 301 | 0.0 | 53 | 0.0 | 247 | 0.0 | 168 | 0.0 | 127 | 0.0 |
| 89. Miscellaneous manufactured articles,n.e.s. | 2,472 | 0.1 | 3,146 | 0.0 | 2,130 | 0.1 | 5,062 | 0.1 | 5,996 | 0.5 |
| 9. Goods not classified elsewhere | 3 | 0.0 | 1 | 0.0 | 184 | 0.0 | ||||
| 93. Special transactions and commodities not classified | 2 | 0.0 | ||||||||
| 96. Coin (not gold coin or legal) | 168 | 0.0 | ||||||||
| 97. Gold,non-monetary | 16 | 0.0 | ||||||||
| In Total | 2,711,029 | 100.0 | 7,165,761 | 100.0 | 3,991,194 | 100.0 | 3,538,219 | 100.0 | 1,106,393 | 100.0 |