
| European countries' export and import of goods | SITC |
Data:Eurostat
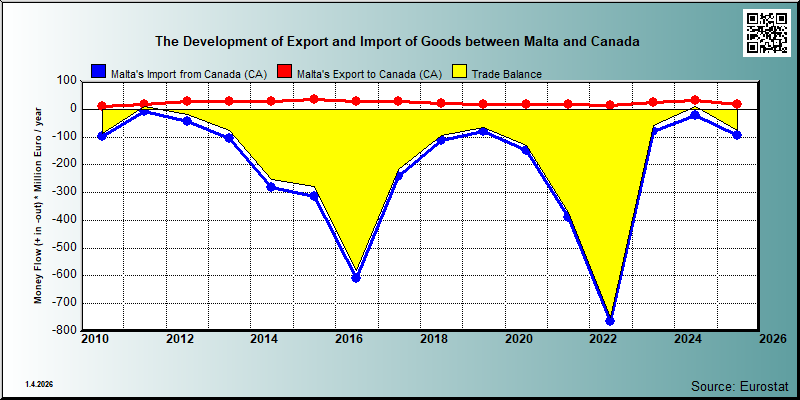

| 2021 | 2022 | 2023 | 2024 | 2025 | ||||||
|---|---|---|---|---|---|---|---|---|---|---|
| 1.000 € | % | 1.000 € | % | 1.000 € | % | 1.000 € | % | 1.000 € | % | |
| 0. Food and live animals | 1,212 | 6.6 | 1,028 | 7.0 | 816 | 3.6 | 940 | 2.9 | 632 | 3.5 |
| 00. Live animals | 172 | 0.8 | ||||||||
| 04. Cereals and cereal preparations | 587 | 3.2 | 576 | 3.9 | 186 | 0.8 | 619 | 1.9 | 530 | 2.9 |
| 05. Vegetables and fruit | ||||||||||
| 06. Sugars,sugar preparations and honey | ||||||||||
| 07. Coffee,tea,cocoa,spices | ||||||||||
| 08. Feeding stuff for animals | ||||||||||
| 09. Miscellaneous edible products and preparations | 608 | 3.3 | 364 | 2.5 | 458 | 2.0 | 278 | 0.9 | 102 | 0.6 |
| 1. Beverages and tobacco | 148 | 0.8 | 9 | 0.0 | ||||||
| 11. Beverages | 7 | 0.0 | 9 | 0.0 | ||||||
| 2. Crude materials,inedible,except fuels | 4 | 0.0 | ||||||||
| 22. Oil seeds,oleaginous fruits | ||||||||||
| 23. Crude rubber (incl.synthetic) | ||||||||||
| 24. Cork and wood | ||||||||||
| 26. Textile fibres and their wastes | 4 | 0.0 | ||||||||
| 27. Crude fertilizers and crude minerals | ||||||||||
| 29. Crude animal,vegetable materials n.e.s. | ||||||||||
| 3. Mineral fuels etc | ||||||||||
| 33. Petroleum and products | ||||||||||
| 4. Animal and vegetable oils and fats | ||||||||||
| 41. Animal oils and fats | ||||||||||
| 5. Chemicals and related products,n.e.s. | 5,640 | 30.9 | 2,913 | 20.0 | 7,350 | 32.4 | 13,497 | 41.8 | 10,146 | 55.9 |
| 51. Organic chemicals | 1,256 | 6.9 | 1,262 | 8.6 | 1,273 | 5.6 | 1,597 | 4.9 | 1,320 | 7.3 |
| 52. Inorganic chemicals | 4 | 0.0 | 10 | 0.1 | 9 | 0.0 | 11 | 0.0 | 5 | 0.0 |
| 53. Dyeing,tanning and colouring material | 2 | 0.0 | ||||||||
| 54. Medicinal and pharmaceutical products | 4,140 | 22.7 | 1,441 | 9.9 | 5,951 | 26.2 | 11,654 | 36.1 | 8,684 | 47.9 |
| 55. Perfume,cleaning etc.preparations | 8 | 0.0 | 18 | 0.1 | 3 | 0.0 | 15 | 0.1 | ||
| 56. Fertilizers,manufactured | ||||||||||
| 57. Plastics in primary forms | 1 | 0.0 | ||||||||
| 58. Plastics in non-primary forms | 114 | 0.6 | 118 | 0.8 | 17 | 0.1 | 170 | 0.5 | 73 | 0.4 |
| 59. Chemical materials and products,n.e.s. | 117 | 0.6 | 82 | 0.6 | 82 | 0.4 | 59 | 0.2 | 48 | 0.3 |
| 6. Basic manufactures | 18 | 0.1 | 67 | 0.5 | 26 | 0.1 | 133 | 0.4 | 119 | 0.7 |
| 61. Leather,dressed fur,etc. | ||||||||||
| 62. Rubber manufactures,n.e.s. | 4 | 0.0 | 7 | 0.0 | ||||||
| 63. Wood and cork manufactures | ||||||||||
| 64. Paper,paperboard and articles thereof | 11 | 0.1 | ||||||||
| 65. Textile yarn,fabrics,made up articles,etc. | 15 | 0.0 | 2 | 0.0 | ||||||
| 66. Non-metallic mineral manufactures,n.e.s. | 1 | 0.0 | ||||||||
| 67. Iron and steel | 4 | 0.0 | 4 | 0.0 | 7 | 0.0 | 19 | 0.1 | ||
| 68. Non-ferrous metals | ||||||||||
| 69. Manufactures of metals,n.e.s. | 18 | 0.1 | 63 | 0.4 | 22 | 0.1 | 106 | 0.3 | 80 | 0.4 |
| 7. Machinery,transport equipment | 2,587 | 14.2 | 2,385 | 16.3 | 5,210 | 23.0 | 9,537 | 29.5 | 3,438 | 18.9 |
| 71. Power generating machinery and equipment | 152 | 0.8 | 282 | 1.9 | 579 | 2.6 | 1,003 | 3.1 | 275 | 1.5 |
| 72. Machinery for specialized industries | 2 | 0.0 | 2 | 0.0 | 3 | 0.0 | 98 | 0.3 | 374 | 2.1 |
| 73. Metal working machinery | ||||||||||
| 74. General industrial machinery n.e.s. | 73 | 0.4 | 95 | 0.7 | 156 | 0.7 | 544 | 1.7 | 357 | 2.0 |
| 75. Office machines and adp machines | 43 | 0.2 | 54 | 0.4 | 22 | 0.1 | 53 | 0.2 | 35 | 0.2 |
| 76. Telecommunications and sound recording equipment | 69 | 0.4 | 4 | 0.0 | 51 | 0.2 | 37 | 0.1 | 71 | 0.4 |
| 77. Electric machinery,n.e.s.and parts | 1,516 | 8.3 | 821 | 5.6 | 2,386 | 10.5 | 652 | 2.0 | 466 | 2.6 |
| 78. Road vehicles | 5 | 0.0 | 4 | 0.0 | ||||||
| 79. Other transport equipment | 732 | 4.0 | 1,122 | 7.7 | 2,008 | 8.9 | 7,151 | 22.1 | 1,860 | 10.2 |
| 8. Miscellaneous manufactured articles | 8,672 | 47.5 | 8,204 | 56.2 | 9,270 | 40.9 | 8,219 | 25.4 | 3,804 | 21.0 |
| 81. Prefabr.buildings;sanitary,lighting etc.fixtrs | 4 | 0.0 | ||||||||
| 82. Furniture and parts thereof | 4 | 0.0 | 69 | 0.4 | ||||||
| 83. Travel goods,handbags and sim.containers | 11 | 0.1 | 2 | 0.0 | 69 | 0.3 | 2 | 0.0 | ||
| 84. Articles of apparel and clothing accessories | 108 | 0.6 | 3 | 0.0 | 65 | 0.3 | 4 | 0.0 | 6 | 0.0 |
| 85. Footwear | 3 | 0.0 | 1 | 0.0 | ||||||
| 87. Instruments and apparates n.e.s. | 8,174 | 44.7 | 7,347 | 50.3 | 8,777 | 38.7 | 7,883 | 24.4 | 3,574 | 19.7 |
| 88. Photographic equipment,optical goods etc. | 43 | 0.3 | 22 | 0.1 | 31 | 0.1 | ||||
| 89. Miscellaneous manufactured articles,n.e.s. | 379 | 2.1 | 809 | 5.5 | 331 | 1.5 | 294 | 0.9 | 154 | 0.8 |
| 9. Goods not classified elsewhere | ||||||||||
| 96. Coin (not gold coin or legal) | ||||||||||
| 97. Gold,non-monetary | ||||||||||
| In Total | 18,276 | 100.0 | 14,597 | 100.0 | 22,676 | 100.0 | 32,326 | 100.0 | 18,147 | 100.0 |

| 2021 | 2022 | 2023 | 2024 | 2025 | ||||||
|---|---|---|---|---|---|---|---|---|---|---|
| 1.000 € | % | 1.000 € | % | 1.000 € | % | 1.000 € | % | 1.000 € | % | |
| 0. Food and live animals | 1,057 | 0.3 | 1,942 | 0.3 | 1,005 | 1.2 | 1,628 | 6.8 | 5,694 | 6.1 |
| 00. Live animals | 1 | 0.0 | ||||||||
| 04. Cereals and cereal preparations | 475 | 0.1 | 767 | 0.1 | 529 | 0.7 | 667 | 2.8 | 4,568 | 4.9 |
| 05. Vegetables and fruit | 239 | 0.1 | 208 | 0.3 | 320 | 1.3 | 287 | 0.3 | ||
| 06. Sugars,sugar preparations and honey | ||||||||||
| 07. Coffee,tea,cocoa,spices | 3 | 0.0 | 2 | 0.0 | ||||||
| 08. Feeding stuff for animals | ||||||||||
| 09. Miscellaneous edible products and preparations | 7 | 0.0 | 14 | 0.0 | 13 | 0.0 | 39 | 0.2 | 407 | 0.4 |
| 1. Beverages and tobacco | 7 | 0.0 | 7 | 0.0 | 8 | 0.0 | ||||
| 11. Beverages | 7 | 0.0 | 7 | 0.0 | 8 | 0.0 | ||||
| 2. Crude materials,inedible,except fuels | 312 | 0.1 | 267 | 0.3 | ||||||
| 22. Oil seeds,oleaginous fruits | ||||||||||
| 23. Crude rubber (incl.synthetic) | ||||||||||
| 24. Cork and wood | ||||||||||
| 26. Textile fibres and their wastes | 2 | 0.0 | ||||||||
| 27. Crude fertilizers and crude minerals | 1 | 0.0 | ||||||||
| 29. Crude animal,vegetable materials n.e.s. | ||||||||||
| 3. Mineral fuels etc | ||||||||||
| 33. Petroleum and products | ||||||||||
| 4. Animal and vegetable oils and fats | ||||||||||
| 41. Animal oils and fats | ||||||||||
| 5. Chemicals and related products,n.e.s. | 3,510 | 0.9 | 1,248 | 0.2 | 2,365 | 2.9 | 1,240 | 5.2 | 2,010 | 2.1 |
| 51. Organic chemicals | 58 | 0.0 | 56 | 0.0 | 509 | 0.6 | 302 | 1.3 | 14 | 0.0 |
| 52. Inorganic chemicals | 2 | 0.0 | 9 | 0.0 | 1 | 0.0 | 2 | 0.0 | 1 | 0.0 |
| 53. Dyeing,tanning and colouring material | 11 | 0.0 | ||||||||
| 54. Medicinal and pharmaceutical products | 3,348 | 0.9 | 1,013 | 0.1 | 1,663 | 2.1 | 629 | 2.6 | 1,806 | 1.9 |
| 55. Perfume,cleaning etc.preparations | 47 | 0.0 | 55 | 0.1 | 79 | 0.3 | 40 | 0.0 | ||
| 56. Fertilizers,manufactured | ||||||||||
| 57. Plastics in primary forms | 1 | 0.0 | ||||||||
| 58. Plastics in non-primary forms | 1 | 0.0 | 5 | 0.0 | 98 | 0.1 | 194 | 0.8 | 94 | 0.1 |
| 59. Chemical materials and products,n.e.s. | 46 | 0.0 | 42 | 0.0 | 31 | 0.0 | 22 | 0.1 | 35 | 0.0 |
| 6. Basic manufactures | 425 | 0.1 | 529 | 0.1 | 647 | 0.8 | 1,136 | 4.8 | 945 | 1.0 |
| 61. Leather,dressed fur,etc. | ||||||||||
| 62. Rubber manufactures,n.e.s. | 110 | 0.5 | 53 | 0.1 | ||||||
| 63. Wood and cork manufactures | ||||||||||
| 64. Paper,paperboard and articles thereof | 87 | 0.1 | ||||||||
| 65. Textile yarn,fabrics,made up articles,etc. | 17 | 0.0 | 64 | 0.3 | 10 | 0.0 | ||||
| 66. Non-metallic mineral manufactures,n.e.s. | 87 | 0.4 | 72 | 0.1 | ||||||
| 67. Iron and steel | 2 | 0.0 | 4 | 0.0 | 17 | 0.1 | 5 | 0.0 | ||
| 68. Non-ferrous metals | ||||||||||
| 69. Manufactures of metals,n.e.s. | 189 | 0.0 | 376 | 0.0 | 423 | 0.5 | 740 | 3.1 | 693 | 0.7 |
| 7. Machinery,transport equipment | 381,628 | 98.0 | 759,060 | 99.1 | 72,785 | 89.8 | 14,057 | 58.9 | 81,191 | 86.5 |
| 71. Power generating machinery and equipment | 2,000 | 0.5 | 352 | 0.0 | 5,529 | 6.8 | 8,263 | 34.6 | 3,740 | 4.0 |
| 72. Machinery for specialized industries | 13 | 0.0 | 148 | 0.0 | 16 | 0.0 | 31 | 0.1 | 7 | 0.0 |
| 73. Metal working machinery | ||||||||||
| 74. General industrial machinery n.e.s. | 51 | 0.0 | 286 | 0.0 | 487 | 0.6 | 777 | 3.3 | 331 | 0.4 |
| 75. Office machines and adp machines | 76 | 0.0 | 81 | 0.0 | 45 | 0.1 | 68 | 0.3 | 67 | 0.1 |
| 76. Telecommunications and sound recording equipment | 307 | 0.1 | 180 | 0.0 | 71 | 0.1 | 98 | 0.4 | 149 | 0.2 |
| 77. Electric machinery,n.e.s.and parts | 310 | 0.1 | 310 | 0.0 | 320 | 0.4 | 541 | 2.3 | 371 | 0.4 |
| 78. Road vehicles | 10 | 0.0 | 82 | 0.1 | 41 | 0.2 | ||||
| 79. Other transport equipment | 378,854 | 97.3 | 757,690 | 98.9 | 66,234 | 81.8 | 4,146 | 17.4 | 76,516 | 81.5 |
| 8. Miscellaneous manufactured articles | 2,364 | 0.6 | 2,869 | 0.4 | 3,938 | 4.9 | 4,460 | 18.7 | 2,390 | 2.5 |
| 81. Prefabr.buildings;sanitary,lighting etc.fixtrs | 33 | 0.0 | ||||||||
| 82. Furniture and parts thereof | 172 | 0.7 | 32 | 0.0 | ||||||
| 83. Travel goods,handbags and sim.containers | 12 | 0.0 | 14 | 0.0 | 10 | 0.0 | 12 | 0.1 | 13 | 0.0 |
| 84. Articles of apparel and clothing accessories | 55 | 0.0 | 96 | 0.0 | 84 | 0.1 | 81 | 0.3 | 84 | 0.1 |
| 85. Footwear | 13 | 0.0 | 11 | 0.0 | 16 | 0.1 | ||||
| 87. Instruments and apparates n.e.s. | 2,123 | 0.5 | 2,520 | 0.3 | 3,513 | 4.3 | 3,828 | 16.0 | 1,972 | 2.1 |
| 88. Photographic equipment,optical goods etc. | 6 | 0.0 | 8 | 0.0 | 10 | 0.0 | 10 | 0.0 | ||
| 89. Miscellaneous manufactured articles,n.e.s. | 146 | 0.0 | 180 | 0.0 | 238 | 0.3 | 286 | 1.2 | 258 | 0.3 |
| 9. Goods not classified elsewhere | ||||||||||
| 96. Coin (not gold coin or legal) | ||||||||||
| 97. Gold,non-monetary | ||||||||||
| In Total | 389,306 | 100.0 | 765,767 | 100.0 | 81,020 | 100.0 | 23,867 | 100.0 | 93,833 | 100.0 |