
| European countries' export and import of goods | SITC |
Data:Eurostat

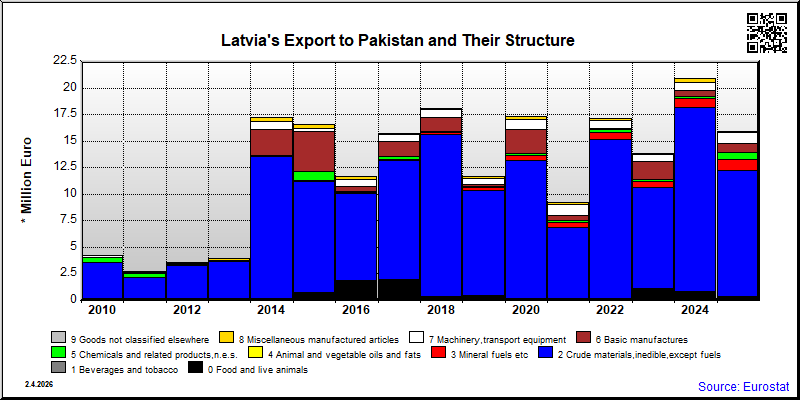
| 2021 | 2022 | 2023 | 2024 | 2025 | ||||||
|---|---|---|---|---|---|---|---|---|---|---|
| 1.000 € | % | 1.000 € | % | 1.000 € | % | 1.000 € | % | 1.000 € | % | |
| 0. Food and live animals | 115 | 0.7 | 1,174 | 8.5 | 811 | 3.9 | 361 | 2.3 | ||
| 04. Cereals and cereal preparations | ||||||||||
| 05. Vegetables and fruit | 1,044 | 7.5 | 811 | 3.9 | 361 | 2.3 | ||||
| 09. Miscellaneous edible products and preparations | ||||||||||
| 2. Crude materials,inedible,except fuels | 6,900 | 75.1 | 15,038 | 87.7 | 9,509 | 68.7 | 17,396 | 83.3 | 11,865 | 74.7 |
| 26. Textile fibres and their wastes | 66 | 0.7 | 120 | 0.7 | 240 | 1.7 | 25 | 0.2 | ||
| 27. Crude fertilizers and crude minerals | ||||||||||
| 28. Metalliferous ores and metal scrap | 10,261 | 64.6 | ||||||||
| 5. Chemicals and related products,n.e.s. | 206 | 2.2 | 324 | 1.9 | 169 | 1.2 | 205 | 1.0 | 634 | 4.0 |
| 57. Plastics in primary forms | ||||||||||
| 58. Plastics in non-primary forms | ||||||||||
| 6. Basic manufactures | 458 | 5.0 | 32 | 0.2 | 1,742 | 12.6 | 541 | 2.6 | 875 | 5.5 |
| 65. Textile yarn,fabrics,made up articles,etc. | 2 | 0.0 | 1 | 0.0 | 3 | 0.0 | ||||
| 66. Non-metallic mineral manufactures,n.e.s. | 74 | 0.8 | 8 | 0.0 | 1 | 0.0 | ||||
| 67. Iron and steel | 869 | 5.5 | ||||||||
| 69. Manufactures of metals,n.e.s. | ||||||||||
| 7. Machinery,transport equipment | 1,056 | 11.5 | 753 | 4.4 | 670 | 4.8 | 732 | 3.5 | 973 | 6.1 |
| 71. Power generating machinery and equipment | 231 | 2.5 | ||||||||
| 72. Machinery for specialized industries | 61 | 0.7 | 28 | 0.1 | 19 | 0.1 | ||||
| 74. General industrial machinery n.e.s. | 12 | 0.1 | 17 | 0.1 | ||||||
| 77. Electric machinery,n.e.s.and parts | 5 | 0.0 | 100 | 0.5 | ||||||
| 8. Miscellaneous manufactured articles | 168 | 1.8 | 210 | 1.2 | 76 | 0.5 | 363 | 1.7 | 82 | 0.5 |
| 82. Furniture and parts thereof | ||||||||||
| 83. Travel goods,handbags and sim.containers | ||||||||||
| 84. Articles of apparel and clothing accessories | 123 | 1.3 | 145 | 0.8 | 26 | 0.2 | 51 | 0.2 | 54 | 0.3 |
| 85. Footwear | ||||||||||
| 87. Instruments and apparates n.e.s. | 44 | 0.5 | 63 | 0.4 | 39 | 0.3 | 312 | 1.5 | ||
| 89. Miscellaneous manufactured articles,n.e.s. | 2 | 0.0 | 1 | 0.0 | 27 | 0.2 | ||||
| In Total | 9,188 | 100.0 | 17,138 | 100.0 | 13,846 | 100.0 | 20,872 | 100.0 | 15,881 | 100.0 |
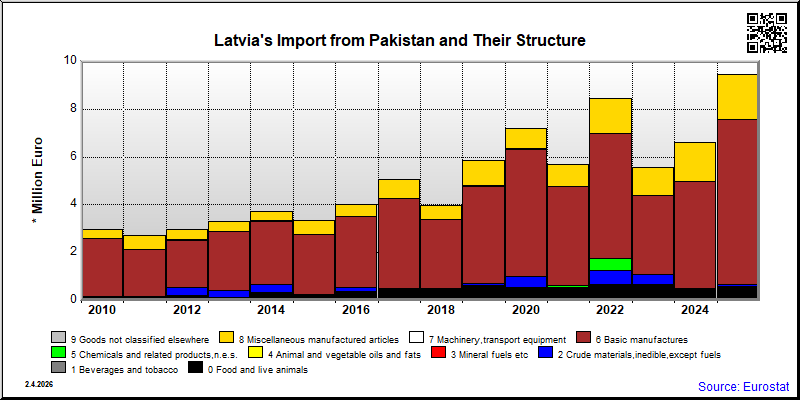
| 2021 | 2022 | 2023 | 2024 | 2025 | ||||||
|---|---|---|---|---|---|---|---|---|---|---|
| 1.000 € | % | 1.000 € | % | 1.000 € | % | 1.000 € | % | 1.000 € | % | |
| 0. Food and live animals | 685 | 8.1 | 657 | 11.8 | 472 | 7.1 | 595 | 6.3 | ||
| 04. Cereals and cereal preparations | ||||||||||
| 05. Vegetables and fruit | 16 | 0.3 | 97 | 1.5 | 79 | 0.8 | ||||
| 09. Miscellaneous edible products and preparations | ||||||||||
| 2. Crude materials,inedible,except fuels | 20 | 0.4 | 587 | 7.0 | 439 | 7.9 | 35 | 0.5 | 70 | 0.7 |
| 26. Textile fibres and their wastes | 548 | 6.5 | 409 | 7.3 | 35 | 0.4 | ||||
| 27. Crude fertilizers and crude minerals | ||||||||||
| 28. Metalliferous ores and metal scrap | 19 | 0.2 | ||||||||
| 5. Chemicals and related products,n.e.s. | 77 | 1.4 | 497 | 5.9 | 1 | 0.0 | 4 | 0.1 | ||
| 57. Plastics in primary forms | ||||||||||
| 58. Plastics in non-primary forms | ||||||||||
| 6. Basic manufactures | 4,150 | 73.1 | 5,231 | 62.0 | 3,307 | 59.3 | 4,453 | 67.2 | 6,906 | 73.1 |
| 65. Textile yarn,fabrics,made up articles,etc. | 4,066 | 71.6 | 3,109 | 55.8 | 4,378 | 66.1 | 6,082 | 64.4 | ||
| 66. Non-metallic mineral manufactures,n.e.s. | 52 | 0.9 | 349 | 4.1 | 150 | 2.7 | ||||
| 67. Iron and steel | 629 | 6.7 | ||||||||
| 69. Manufactures of metals,n.e.s. | ||||||||||
| 7. Machinery,transport equipment | 2 | 0.0 | 1 | 0.0 | 3 | 0.0 | 8 | 0.1 | ||
| 71. Power generating machinery and equipment | 1 | 0.0 | ||||||||
| 72. Machinery for specialized industries | 1 | 0.0 | 1 | 0.0 | 1 | 0.0 | ||||
| 74. General industrial machinery n.e.s. | 8 | 0.1 | ||||||||
| 77. Electric machinery,n.e.s.and parts | 1 | 0.0 | ||||||||
| 8. Miscellaneous manufactured articles | 893 | 15.7 | 1,439 | 17.0 | 1,170 | 21.0 | 1,660 | 25.0 | 1,869 | 19.8 |
| 82. Furniture and parts thereof | ||||||||||
| 83. Travel goods,handbags and sim.containers | ||||||||||
| 84. Articles of apparel and clothing accessories | 860 | 15.1 | 1,401 | 16.6 | 1,080 | 19.4 | 1,516 | 22.9 | 1,731 | 18.3 |
| 85. Footwear | ||||||||||
| 87. Instruments and apparates n.e.s. | 10 | 0.2 | 8 | 0.1 | 12 | 0.2 | 9 | 0.1 | 16 | 0.2 |
| 89. Miscellaneous manufactured articles,n.e.s. | 21 | 0.4 | 21 | 0.2 | 49 | 0.7 | 27 | 0.3 | ||
| In Total | 5,681 | 100.0 | 8,440 | 100.0 | 5,575 | 100.0 | 6,626 | 100.0 | 9,449 | 100.0 |