
| European countries' export and import of goods | SITC |
Data:Eurostat

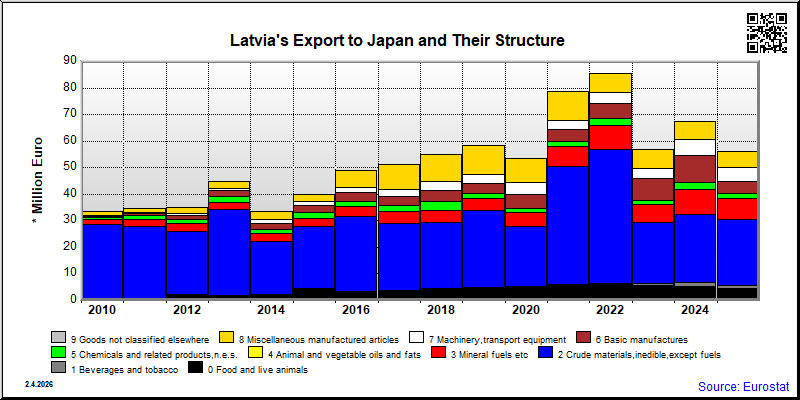
| 2021 | 2022 | 2023 | 2024 | 2025 | ||||||
|---|---|---|---|---|---|---|---|---|---|---|
| 1.000 € | % | 1.000 € | % | 1.000 € | % | 1.000 € | % | 1.000 € | % | |
| 0. Food and live animals | 6,115 | 7.8 | 5,919 | 6.9 | 5,546 | 9.8 | 5,401 | 8.0 | 4,462 | 7.9 |
| 03. Fish and fish preparations | 2,308 | 2.7 | 1,559 | 2.7 | 1,481 | 2.2 | 1,522 | 2.7 | ||
| 04. Cereals and cereal preparations | 1,392 | 1.8 | 1,708 | 2.0 | 1,143 | 2.0 | 1,407 | 2.1 | 1,255 | 2.2 |
| 05. Vegetables and fruit | 1,414 | 1.8 | 1,612 | 1.9 | 2,134 | 3.8 | 1,561 | 2.3 | 816 | 1.4 |
| 06. Sugars,sugar preparations and honey | 357 | 0.5 | 210 | 0.2 | 635 | 1.1 | 796 | 1.2 | 257 | 0.5 |
| 07. Coffee,tea,cocoa,spices | 89 | 0.1 | 76 | 0.1 | 48 | 0.1 | 49 | 0.1 | 80 | 0.1 |
| 09. Miscellaneous edible products and preparations | 32 | 0.0 | 4 | 0.0 | 26 | 0.0 | 97 | 0.1 | 97 | 0.2 |
| 1. Beverages and tobacco | 79 | 0.1 | 330 | 0.4 | 683 | 1.2 | 1,346 | 2.0 | 1,040 | 1.8 |
| 11. Beverages | 79 | 0.1 | 330 | 0.4 | 683 | 1.2 | 1,346 | 2.0 | 1,040 | 1.8 |
| 2. Crude materials,inedible,except fuels | 44,331 | 56.4 | 50,586 | 59.3 | 23,068 | 40.6 | 25,488 | 37.9 | 24,933 | 44.3 |
| 23. Crude rubber (incl.synthetic) | ||||||||||
| 27. Crude fertilizers and crude minerals | 3 | 0.0 | ||||||||
| 29. Crude animal,vegetable materials n.e.s. | 187 | 0.2 | 165 | 0.2 | 45 | 0.1 | 95 | 0.1 | 332 | 0.6 |
| 3. Mineral fuels etc | 7,579 | 9.6 | 9,012 | 10.6 | 9,730 | 14.5 | 7,865 | 14.0 | ||
| 32. Coal,coke and briquettes | 9,729 | 14.5 | ||||||||
| 33. Petroleum and products | 2 | 0.0 | ||||||||
| 4. Animal and vegetable oils and fats | ||||||||||
| 42. Fixed vegetable fats and oils | ||||||||||
| 5. Chemicals and related products,n.e.s. | 1,635 | 2.1 | 2,722 | 3.2 | 1,597 | 2.8 | 2,584 | 3.8 | 2,067 | 3.7 |
| 51. Organic chemicals | 1,389 | 1.8 | 2,022 | 2.4 | 1,192 | 2.1 | 1,914 | 2.8 | 1,427 | 2.5 |
| 52. Inorganic chemicals | ||||||||||
| 53. Dyeing,tanning and colouring material | 15 | 0.0 | 1 | 0.0 | 3 | 0.0 | 3 | 0.0 | 5 | 0.0 |
| 54. Medicinal and pharmaceutical products | 7 | 0.0 | 23 | 0.0 | 54 | 0.1 | 12 | 0.0 | ||
| 55. Perfume,cleaning etc.preparations | 104 | 0.1 | 81 | 0.1 | 62 | 0.1 | 40 | 0.1 | 210 | 0.4 |
| 56. Fertilizers,manufactured | 205 | 0.2 | ||||||||
| 57. Plastics in primary forms | 2 | 0.0 | 36 | 0.0 | 44 | 0.1 | 11 | 0.0 | 6 | 0.0 |
| 58. Plastics in non-primary forms | 24 | 0.0 | 3 | 0.0 | 2 | 0.0 | 1 | 0.0 | 14 | 0.0 |
| 59. Chemical materials and products,n.e.s. | 30 | 0.0 | 352 | 0.4 | 242 | 0.4 | 569 | 0.8 | 405 | 0.7 |
| 6. Basic manufactures | 4,627 | 5.9 | 5,617 | 6.6 | 8,340 | 14.7 | 10,043 | 14.9 | 4,345 | 7.7 |
| 61. Leather,dressed fur,etc. | 2 | 0.0 | ||||||||
| 62. Rubber manufactures,n.e.s. | 1,076 | 1.4 | 391 | 0.5 | 1 | 0.0 | 31 | 0.0 | 2 | 0.0 |
| 63. Wood and cork manufactures | 1,599 | 2.0 | 1,302 | 1.5 | 4,500 | 7.9 | 3,929 | 5.8 | 1,955 | 3.5 |
| 64. Paper,paperboard and articles thereof | 3 | 0.0 | 2 | 0.0 | 2 | 0.0 | 1 | 0.0 | ||
| 65. Textile yarn,fabrics,made up articles,etc. | 1,047 | 1.3 | 573 | 0.7 | 337 | 0.6 | 495 | 0.7 | 303 | 0.5 |
| 66. Non-metallic mineral manufactures,n.e.s. | 386 | 0.5 | 2,860 | 3.4 | 2,671 | 4.7 | 4,512 | 6.7 | 1,399 | 2.5 |
| 67. Iron and steel | 1 | 0.0 | 224 | 0.4 | 493 | 0.7 | 188 | 0.3 | ||
| 68. Non-ferrous metals | 83 | 0.1 | 7 | 0.0 | 96 | 0.2 | ||||
| 69. Manufactures of metals,n.e.s. | 432 | 0.5 | 483 | 0.6 | 511 | 0.9 | 579 | 0.9 | 497 | 0.9 |
| 7. Machinery,transport equipment | 3,566 | 4.5 | 4,170 | 4.9 | 3,695 | 6.5 | 6,191 | 9.2 | 5,284 | 9.4 |
| 71. Power generating machinery and equipment | 77 | 0.1 | 676 | 0.8 | 709 | 1.2 | 1,593 | 2.4 | 942 | 1.7 |
| 72. Machinery for specialized industries | 389 | 0.5 | 407 | 0.5 | 579 | 1.0 | 417 | 0.6 | 772 | 1.4 |
| 73. Metal working machinery | ||||||||||
| 74. General industrial machinery n.e.s. | 566 | 0.7 | 844 | 1.0 | 752 | 1.3 | 655 | 1.0 | 1,089 | 1.9 |
| 75. Office machines and adp machines | 88 | 0.1 | 48 | 0.1 | 94 | 0.2 | 73 | 0.1 | 113 | 0.2 |
| 76. Telecommunications and sound recording equipment | 598 | 0.8 | 709 | 0.8 | 729 | 1.3 | 1,513 | 2.2 | 1,283 | 2.3 |
| 77. Electric machinery,n.e.s.and parts | 1,073 | 1.4 | 887 | 1.0 | 623 | 1.1 | 1,154 | 1.7 | 848 | 1.5 |
| 78. Road vehicles | 558 | 0.7 | 457 | 0.5 | 147 | 0.3 | 319 | 0.5 | 237 | 0.4 |
| 79. Other transport equipment | 217 | 0.3 | 142 | 0.2 | 63 | 0.1 | 467 | 0.7 | ||
| 8. Miscellaneous manufactured articles | 10,710 | 13.6 | 7,004 | 8.2 | 7,144 | 12.6 | 6,504 | 9.7 | 6,299 | 11.2 |
| 81. Prefabr.buildings;sanitary,lighting etc.fixtrs | 1,028 | 1.3 | 72 | 0.1 | 165 | 0.3 | 91 | 0.1 | 215 | 0.4 |
| 82. Furniture and parts thereof | 1,967 | 2.5 | 264 | 0.3 | 13 | 0.0 | 6 | 0.0 | 54 | 0.1 |
| 83. Travel goods,handbags and sim.containers | 19 | 0.0 | 5 | 0.0 | 58 | 0.1 | 5 | 0.0 | 20 | 0.0 |
| 84. Articles of apparel and clothing accessories | 240 | 0.3 | 203 | 0.2 | 155 | 0.3 | 109 | 0.2 | 91 | 0.2 |
| 85. Footwear | 4 | 0.0 | 15 | 0.0 | 68 | 0.1 | 2 | 0.0 | 2 | 0.0 |
| 87. Instruments and apparates n.e.s. | 5,976 | 7.6 | 5,101 | 6.0 | 5,281 | 9.3 | 5,253 | 7.8 | 5,032 | 8.9 |
| 88. Photographic equipment,optical goods etc. | 1,029 | 1.3 | 625 | 0.7 | 620 | 1.1 | 563 | 0.8 | 439 | 0.8 |
| 89. Miscellaneous manufactured articles,n.e.s. | 446 | 0.6 | 720 | 0.8 | 785 | 1.4 | 474 | 0.7 | 445 | 0.8 |
| In Total | 78,640 | 100.0 | 85,359 | 100.0 | 56,805 | 100.0 | 67,288 | 100.0 | 56,295 | 100.0 |

| 2021 | 2022 | 2023 | 2024 | 2025 | ||||||
|---|---|---|---|---|---|---|---|---|---|---|
| 1.000 € | % | 1.000 € | % | 1.000 € | % | 1.000 € | % | 1.000 € | % | |
| 0. Food and live animals | 292 | 1.2 | 382 | 1.4 | 266 | 1.1 | 344 | 1.3 | 356 | 1.1 |
| 03. Fish and fish preparations | 16 | 0.1 | 3 | 0.0 | ||||||
| 04. Cereals and cereal preparations | 2 | 0.0 | 1 | 0.0 | 24 | 0.1 | 4 | 0.0 | 5 | 0.0 |
| 05. Vegetables and fruit | 1 | 0.0 | 5 | 0.0 | 6 | 0.0 | 13 | 0.0 | ||
| 06. Sugars,sugar preparations and honey | 2 | 0.0 | 2 | 0.0 | 1 | 0.0 | 1 | 0.0 | 1 | 0.0 |
| 07. Coffee,tea,cocoa,spices | 12 | 0.1 | 11 | 0.0 | 13 | 0.1 | 24 | 0.1 | 35 | 0.1 |
| 09. Miscellaneous edible products and preparations | 274 | 1.1 | 351 | 1.3 | 223 | 0.9 | 308 | 1.1 | 300 | 0.9 |
| 1. Beverages and tobacco | 521 | 2.1 | 532 | 2.0 | 504 | 2.1 | 554 | 2.0 | 609 | 1.8 |
| 11. Beverages | 521 | 2.1 | 532 | 2.0 | 504 | 2.1 | 554 | 2.0 | 609 | 1.8 |
| 2. Crude materials,inedible,except fuels | 2,963 | 12.1 | 2,646 | 9.9 | 3,071 | 12.9 | 2,854 | 10.5 | 2,027 | 6.0 |
| 23. Crude rubber (incl.synthetic) | ||||||||||
| 27. Crude fertilizers and crude minerals | 279 | 1.2 | ||||||||
| 29. Crude animal,vegetable materials n.e.s. | 1 | 0.0 | 1 | 0.0 | 1 | 0.0 | ||||
| 3. Mineral fuels etc | 22 | 0.1 | 13 | 0.0 | ||||||
| 32. Coal,coke and briquettes | 12 | 0.0 | ||||||||
| 33. Petroleum and products | ||||||||||
| 4. Animal and vegetable oils and fats | 1 | 0.0 | ||||||||
| 42. Fixed vegetable fats and oils | ||||||||||
| 5. Chemicals and related products,n.e.s. | 4,393 | 17.9 | 4,377 | 16.3 | 1,459 | 6.1 | 2,624 | 9.7 | 7,650 | 22.6 |
| 51. Organic chemicals | 9 | 0.0 | 1 | 0.0 | 20 | 0.1 | 3 | 0.0 | 11 | 0.0 |
| 52. Inorganic chemicals | ||||||||||
| 53. Dyeing,tanning and colouring material | 4 | 0.0 | 68 | 0.3 | 60 | 0.3 | 112 | 0.4 | 75 | 0.2 |
| 54. Medicinal and pharmaceutical products | 3,188 | 13.0 | 3,721 | 13.9 | 1,013 | 4.3 | 789 | 2.9 | ||
| 55. Perfume,cleaning etc.preparations | 171 | 0.7 | 123 | 0.5 | 139 | 0.6 | 150 | 0.6 | 255 | 0.8 |
| 56. Fertilizers,manufactured | ||||||||||
| 57. Plastics in primary forms | 862 | 3.5 | 253 | 0.9 | 10 | 0.0 | 1 | 0.0 | ||
| 58. Plastics in non-primary forms | 12 | 0.0 | 31 | 0.1 | 166 | 0.7 | 319 | 1.2 | 413 | 1.2 |
| 59. Chemical materials and products,n.e.s. | 143 | 0.6 | 59 | 0.2 | 49 | 0.2 | 1,248 | 4.6 | 5,726 | 16.9 |
| 6. Basic manufactures | 5,855 | 23.9 | 7,323 | 27.3 | 7,801 | 32.8 | 9,542 | 35.1 | 10,252 | 30.3 |
| 61. Leather,dressed fur,etc. | ||||||||||
| 62. Rubber manufactures,n.e.s. | 3,823 | 15.6 | 4,681 | 17.5 | 4,766 | 20.1 | 4,982 | 18.3 | 7,039 | 20.8 |
| 63. Wood and cork manufactures | 24 | 0.1 | 1 | 0.0 | 2 | 0.0 | 1 | 0.0 | 1 | 0.0 |
| 64. Paper,paperboard and articles thereof | 1,018 | 4.2 | 1,065 | 4.0 | 1,155 | 4.9 | 1,682 | 6.2 | 1,420 | 4.2 |
| 65. Textile yarn,fabrics,made up articles,etc. | 453 | 1.8 | 623 | 2.3 | 366 | 1.5 | 309 | 1.1 | 229 | 0.7 |
| 66. Non-metallic mineral manufactures,n.e.s. | 404 | 1.7 | 828 | 3.1 | 1,273 | 5.4 | 1,945 | 7.2 | 866 | 2.6 |
| 67. Iron and steel | 1 | 0.0 | 3 | 0.0 | 69 | 0.3 | 18 | 0.1 | 227 | 0.7 |
| 68. Non-ferrous metals | 32 | 0.1 | 6 | 0.0 | 56 | 0.2 | 451 | 1.7 | 305 | 0.9 |
| 69. Manufactures of metals,n.e.s. | 99 | 0.4 | 116 | 0.4 | 114 | 0.5 | 155 | 0.6 | 166 | 0.5 |
| 7. Machinery,transport equipment | 8,513 | 34.8 | 8,545 | 31.9 | 8,235 | 34.6 | 7,136 | 26.3 | 9,315 | 27.5 |
| 71. Power generating machinery and equipment | 182 | 0.7 | 477 | 1.8 | 563 | 2.4 | 727 | 2.7 | 1,080 | 3.2 |
| 72. Machinery for specialized industries | 3,194 | 13.0 | 1,451 | 5.4 | 873 | 3.7 | 732 | 2.7 | 1,127 | 3.3 |
| 73. Metal working machinery | ||||||||||
| 74. General industrial machinery n.e.s. | 1,755 | 7.2 | 2,125 | 7.9 | 2,492 | 10.5 | 1,629 | 6.0 | 2,612 | 7.7 |
| 75. Office machines and adp machines | 69 | 0.3 | 66 | 0.2 | 49 | 0.2 | 66 | 0.2 | 44 | 0.1 |
| 76. Telecommunications and sound recording equipment | 1,271 | 5.2 | 1,045 | 3.9 | 655 | 2.8 | 1,383 | 5.1 | 1,457 | 4.3 |
| 77. Electric machinery,n.e.s.and parts | 1,065 | 4.3 | 2,147 | 8.0 | 2,335 | 9.8 | 1,419 | 5.2 | 1,843 | 5.4 |
| 78. Road vehicles | 610 | 2.5 | 889 | 3.3 | 1,023 | 4.3 | 942 | 3.5 | 746 | 2.2 |
| 79. Other transport equipment | 140 | 0.6 | 111 | 0.4 | 11 | 0.0 | 35 | 0.1 | ||
| 8. Miscellaneous manufactured articles | 1,934 | 7.9 | 3,002 | 11.2 | 2,434 | 10.2 | 4,097 | 15.1 | 3,655 | 10.8 |
| 81. Prefabr.buildings;sanitary,lighting etc.fixtrs | 3 | 0.0 | 10 | 0.0 | 1 | 0.0 | 362 | 1.3 | 25 | 0.1 |
| 82. Furniture and parts thereof | 11 | 0.0 | 3 | 0.0 | 3 | 0.0 | 1 | 0.0 | 8 | 0.0 |
| 83. Travel goods,handbags and sim.containers | 19 | 0.1 | 129 | 0.5 | 507 | 2.1 | 1,058 | 3.9 | 936 | 2.8 |
| 84. Articles of apparel and clothing accessories | 64 | 0.3 | 57 | 0.2 | 61 | 0.3 | 109 | 0.4 | 178 | 0.5 |
| 85. Footwear | 5 | 0.0 | 6 | 0.0 | 10 | 0.0 | 44 | 0.2 | 48 | 0.1 |
| 87. Instruments and apparates n.e.s. | 709 | 2.9 | 1,073 | 4.0 | 659 | 2.8 | 951 | 3.5 | 876 | 2.6 |
| 88. Photographic equipment,optical goods etc. | 194 | 0.8 | 198 | 0.7 | 278 | 1.2 | 531 | 2.0 | 491 | 1.5 |
| 89. Miscellaneous manufactured articles,n.e.s. | 929 | 3.8 | 1,526 | 5.7 | 915 | 3.8 | 1,041 | 3.8 | 1,093 | 3.2 |
| In Total | 24,494 | 100.0 | 26,807 | 100.0 | 23,770 | 100.0 | 27,164 | 100.0 | 33,865 | 100.0 |