
| European countries' export and import of goods | SITC |
Data:Eurostat

| 2021 | 2022 | 2023 | 2024 | 2025 | ||||||
|---|---|---|---|---|---|---|---|---|---|---|
| 1.000 € | % | 1.000 € | % | 1.000 € | % | 1.000 € | % | 1.000 € | % | |
| 0. Food and live animals | 115 | 0.1 | 119 | 0.2 | ||||||
| 07. Coffee,tea,cocoa,spices | 3 | 0.0 | ||||||||
| 08. Feeding stuff for animals | 111 | 0.1 | 116 | 0.2 | ||||||
| 09. Miscellaneous edible products and preparations | 1 | 0.0 | ||||||||
| 2. Crude materials,inedible,except fuels | 8 | 0.0 | 11 | 0.0 | ||||||
| 23. Crude rubber (incl.synthetic) | 5 | 0.0 | ||||||||
| 26. Textile fibres and their wastes | 1 | 0.0 | ||||||||
| 27. Crude fertilizers and crude minerals | 2 | 0.0 | 6 | 0.0 | ||||||
| 29. Crude animal,vegetable materials n.e.s. | ||||||||||
| 3. Mineral fuels etc | 47 | 0.0 | 12 | 0.0 | ||||||
| 33. Petroleum and products | 40 | 0.0 | 12 | 0.0 | ||||||
| 5. Chemicals and related products,n.e.s. | 43,467 | 27.8 | 20,272 | 35.9 | 7,162 | 75.4 | 2,665 | 52.1 | 1,485 | 53.3 |
| 51. Organic chemicals | 96 | 0.1 | 312 | 0.6 | 38 | 0.4 | ||||
| 52. Inorganic chemicals | 14 | 0.0 | 13 | 0.0 | ||||||
| 53. Dyeing,tanning and colouring material | 8,327 | 5.3 | 7,182 | 12.7 | ||||||
| 54. Medicinal and pharmaceutical products | ||||||||||
| 55. Perfume,cleaning etc.preparations | 807 | 0.5 | 147 | 0.3 | ||||||
| 57. Plastics in primary forms | 3,090 | 2.0 | 1,869 | 3.3 | 693 | 7.3 | ||||
| 58. Plastics in non-primary forms | 23,137 | 14.8 | 5,513 | 9.8 | ||||||
| 59. Chemical materials and products,n.e.s. | 7,995 | 5.1 | 5,236 | 9.3 | ||||||
| 6. Basic manufactures | 45,090 | 28.9 | 15,713 | 27.9 | 489 | 9.6 | ||||
| 63. Wood and cork manufactures | ||||||||||
| 64. Paper,paperboard and articles thereof | 20,955 | 13.4 | 5,807 | 10.3 | ||||||
| 65. Textile yarn,fabrics,made up articles,etc. | 3,310 | 2.1 | 560 | 1.0 | ||||||
| 66. Non-metallic mineral manufactures,n.e.s. | 144 | 0.1 | 390 | 0.7 | ||||||
| 67. Iron and steel | 7,380 | 4.7 | 3,686 | 6.5 | ||||||
| 68. Non-ferrous metals | 1,644 | 1.1 | 321 | 0.6 | ||||||
| 69. Manufactures of metals,n.e.s. | 1,344 | 0.9 | 975 | 1.7 | 489 | 9.6 | ||||
| 7. Machinery,transport equipment | 59,683 | 38.2 | 17,174 | 30.4 | 492 | 5.2 | 801 | 15.7 | ||
| 72. Machinery for specialized industries | 4,516 | 2.9 | 3,968 | 7.0 | ||||||
| 73. Metal working machinery | 371 | 0.2 | 68 | 0.1 | ||||||
| 74. General industrial machinery n.e.s. | 17,915 | 11.5 | 7,369 | 13.1 | ||||||
| 75. Office machines and adp machines | 420 | 0.3 | 28 | 0.0 | ||||||
| 76. Telecommunications and sound recording equipment | 770 | 0.5 | 14 | 0.0 | ||||||
| 77. Electric machinery,n.e.s.and parts | 3,724 | 2.4 | 1,388 | 2.5 | 460 | 4.8 | ||||
| 78. Road vehicles | 2,296 | 1.5 | 2,937 | 5.2 | ||||||
| 79. Other transport equipment | 29,240 | 18.7 | ||||||||
| 8. Miscellaneous manufactured articles | 4,346 | 2.8 | 2,515 | 4.5 | 1,547 | 16.3 | 1,153 | 22.6 | 1,244 | 44.6 |
| 81. Prefabr.buildings;sanitary,lighting etc.fixtrs | ||||||||||
| 82. Furniture and parts thereof | ||||||||||
| 83. Travel goods,handbags and sim.containers | 21 | 0.0 | 3 | 0.0 | ||||||
| 84. Articles of apparel and clothing accessories | 97 | 0.1 | 11 | 0.0 | ||||||
| 85. Footwear | 26 | 0.0 | 2 | 0.0 | ||||||
| 87. Instruments and apparates n.e.s. | 2,570 | 1.6 | 1,969 | 3.5 | 1,144 | 22.4 | ||||
| 88. Photographic equipment,optical goods etc. | 21 | 0.0 | 13 | 0.0 | ||||||
| 89. Miscellaneous manufactured articles,n.e.s. | 1,612 | 1.0 | 517 | 0.9 | 4 | 0.0 | 9 | 0.2 | 4 | 0.1 |
| 9. Goods not classified elsewhere | 16 | 0.0 | 27 | 0.3 | ||||||
| 93. Special transactions and commodities not classified | 16 | 0.0 | 27 | 0.3 | ||||||
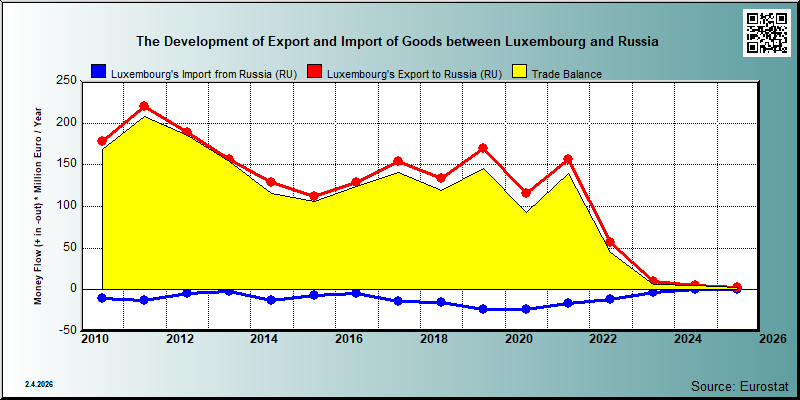
| In Total | 156,096 | 100.0 | 56,411 | 100.0 | 9,499 | 100.0 | 5,111 | 100.0 | 2,788 | 100.0 |
| 2021 | 2022 | 2023 | 2024 | 2025 | ||||||
|---|---|---|---|---|---|---|---|---|---|---|
| 1.000 € | % | 1.000 € | % | 1.000 € | % | 1.000 € | % | 1.000 € | % | |
| 0. Food and live animals | 2 | 0.0 | 1 | 0.0 | ||||||
| 07. Coffee,tea,cocoa,spices | ||||||||||
| 08. Feeding stuff for animals | 1 | 0.0 | ||||||||
| 09. Miscellaneous edible products and preparations | 1 | 0.0 | 1 | 0.0 | ||||||
| 2. Crude materials,inedible,except fuels | 219 | 1.3 | 16 | 0.1 | ||||||
| 23. Crude rubber (incl.synthetic) | 216 | 1.3 | 16 | 0.1 | ||||||
| 26. Textile fibres and their wastes | 1 | 0.0 | ||||||||
| 27. Crude fertilizers and crude minerals | 1 | 0.0 | ||||||||
| 29. Crude animal,vegetable materials n.e.s. | 1 | 0.0 | ||||||||
| 3. Mineral fuels etc | 2 | 0.0 | 1 | 0.0 | ||||||
| 33. Petroleum and products | 2 | 0.0 | 1 | 0.0 | ||||||
| 5. Chemicals and related products,n.e.s. | 1,115 | 6.8 | 6,490 | 57.1 | 20 | 0.7 | 33 | 41.0 | ||
| 51. Organic chemicals | 14 | 0.1 | 7 | 0.1 | 4 | 0.1 | ||||
| 52. Inorganic chemicals | 104 | 0.6 | 5,281 | 46.5 | ||||||
| 53. Dyeing,tanning and colouring material | 1 | 0.0 | 5 | 0.0 | ||||||
| 54. Medicinal and pharmaceutical products | ||||||||||
| 55. Perfume,cleaning etc.preparations | 3 | 0.0 | 1 | 0.0 | ||||||
| 57. Plastics in primary forms | 21 | 0.1 | 3 | 0.0 | 3 | 0.1 | ||||
| 58. Plastics in non-primary forms | 2 | 0.0 | 10 | 0.1 | ||||||
| 59. Chemical materials and products,n.e.s. | 970 | 5.9 | 1,183 | 10.4 | ||||||
| 6. Basic manufactures | 13,273 | 81.3 | 3,859 | 34.0 | 1 | 0.7 | ||||
| 63. Wood and cork manufactures | 3 | 0.0 | 49 | 0.4 | ||||||
| 64. Paper,paperboard and articles thereof | 63 | 0.4 | 84 | 0.7 | ||||||
| 65. Textile yarn,fabrics,made up articles,etc. | 208 | 1.3 | 749 | 6.6 | ||||||
| 66. Non-metallic mineral manufactures,n.e.s. | 50 | 0.3 | 79 | 0.7 | ||||||
| 67. Iron and steel | 133 | 0.8 | ||||||||
| 68. Non-ferrous metals | 12,214 | 74.8 | 2,574 | 22.7 | ||||||
| 69. Manufactures of metals,n.e.s. | 602 | 3.7 | 323 | 2.8 | 1 | 0.7 | ||||
| 7. Machinery,transport equipment | 1,228 | 7.5 | 162 | 1.4 | 44 | 1.5 | 16 | 19.4 | ||
| 72. Machinery for specialized industries | 351 | 2.2 | 12 | 0.1 | ||||||
| 73. Metal working machinery | 616 | 3.8 | 60 | 0.5 | ||||||
| 74. General industrial machinery n.e.s. | 143 | 0.9 | 5 | 0.0 | ||||||
| 75. Office machines and adp machines | 20 | 0.1 | 2 | 0.0 | ||||||
| 76. Telecommunications and sound recording equipment | 26 | 0.2 | 1 | 0.0 | ||||||
| 77. Electric machinery,n.e.s.and parts | 23 | 0.1 | 16 | 0.1 | ||||||
| 78. Road vehicles | 49 | 0.3 | 66 | 0.6 | ||||||
| 79. Other transport equipment | 1 | 0.0 | ||||||||
| 8. Miscellaneous manufactured articles | 352 | 2.2 | 129 | 1.1 | 27 | 0.9 | 3 | 4.1 | 4 | 85.2 |
| 81. Prefabr.buildings;sanitary,lighting etc.fixtrs | ||||||||||
| 82. Furniture and parts thereof | 4 | 0.0 | ||||||||
| 83. Travel goods,handbags and sim.containers | 8 | 0.0 | ||||||||
| 84. Articles of apparel and clothing accessories | 28 | 0.2 | 8 | 0.1 | ||||||
| 85. Footwear | 4 | 0.0 | ||||||||
| 87. Instruments and apparates n.e.s. | 157 | 1.0 | 2 | 0.0 | ||||||
| 88. Photographic equipment,optical goods etc. | 5 | 0.0 | ||||||||
| 89. Miscellaneous manufactured articles,n.e.s. | 140 | 0.9 | 48 | 0.4 | 6 | 0.2 | 1 | 1.0 | 2 | 51.1 |
| 9. Goods not classified elsewhere | 127 | 0.8 | 161 | 5.5 | ||||||
| 93. Special transactions and commodities not classified | 127 | 0.8 | 161 | 5.5 | ||||||
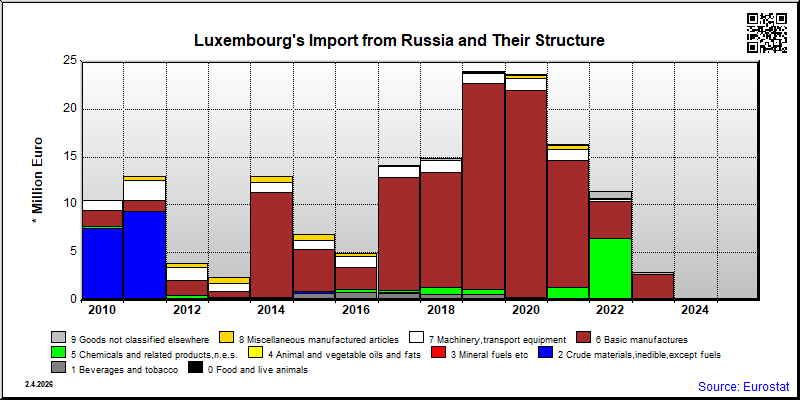
| In Total | 16,319 | 100.0 | 11,360 | 100.0 | 2,913 | 100.0 | 81 | 100.0 | 4 | 100.0 |