
| European countries' export and import of goods | SITC |
Data:Eurostat
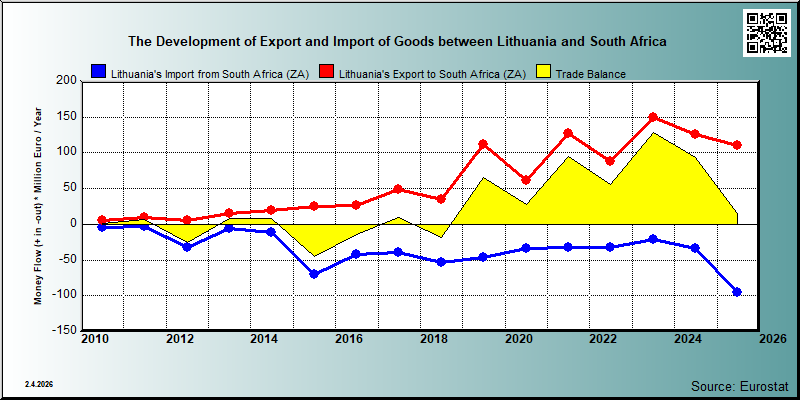
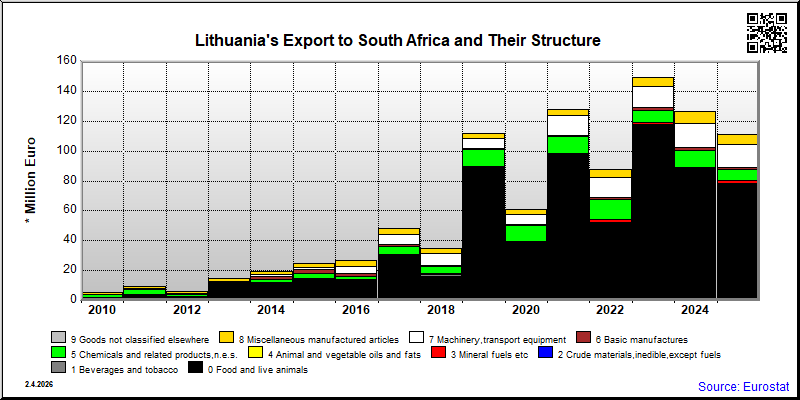
| 2021 | 2022 | 2023 | 2024 | 2025 | ||||||
|---|---|---|---|---|---|---|---|---|---|---|
| 1.000 € | % | 1.000 € | % | 1.000 € | % | 1.000 € | % | 1.000 € | % | |
| 0. Food and live animals | 97,144 | 76.0 | 51,868 | 59.2 | 116,951 | 78.4 | 87,734 | 69.5 | 78,160 | 70.4 |
| 04. Cereals and cereal preparations | 94,250 | 73.7 | 48,699 | 55.6 | 114,329 | 76.7 | 85,976 | 68.1 | 76,511 | 69.0 |
| 05. Vegetables and fruit | 107 | 0.1 | ||||||||
| 07. Coffee,tea,cocoa,spices | 1 | 0.0 | 150 | 0.2 | 100 | 0.1 | 28 | 0.0 | 21 | 0.0 |
| 1. Beverages and tobacco | 24 | 0.0 | 6 | 0.0 | ||||||
| 11. Beverages | 24 | 0.0 | ||||||||
| 2. Crude materials,inedible,except fuels | 346 | 0.3 | 416 | 0.5 | 807 | 0.5 | 322 | 0.3 | 213 | 0.2 |
| 24. Cork and wood | 2 | 0.0 | ||||||||
| 26. Textile fibres and their wastes | 346 | 0.3 | 391 | 0.4 | 754 | 0.5 | 272 | 0.2 | 207 | 0.2 |
| 27. Crude fertilizers and crude minerals | ||||||||||
| 28. Metalliferous ores and metal scrap | ||||||||||
| 29. Crude animal,vegetable materials n.e.s. | 43 | 0.0 | ||||||||
| 4. Animal and vegetable oils and fats | ||||||||||
| 42. Fixed vegetable fats and oils | ||||||||||
| 5. Chemicals and related products,n.e.s. | 11,293 | 8.8 | 13,522 | 15.4 | 8,474 | 5.7 | 11,211 | 8.9 | 7,627 | 6.9 |
| 51. Organic chemicals | 634 | 0.5 | 1,441 | 1.6 | 1,128 | 0.8 | 757 | 0.7 | ||
| 52. Inorganic chemicals | 2,150 | 1.7 | 79 | 0.1 | ||||||
| 54. Medicinal and pharmaceutical products | 7 | 0.0 | 2 | 0.0 | 7 | 0.0 | 14 | 0.0 | 18 | 0.0 |
| 55. Perfume,cleaning etc.preparations | 31 | 0.0 | 87 | 0.1 | 225 | 0.2 | 130 | 0.1 | 36 | 0.0 |
| 57. Plastics in primary forms | 3,957 | 3.1 | 6,984 | 8.0 | 4,520 | 3.0 | 6,719 | 5.3 | ||
| 58. Plastics in non-primary forms | 2,353 | 1.8 | 3,335 | 3.8 | 1,571 | 1.1 | 1,552 | 1.4 | ||
| 59. Chemical materials and products,n.e.s. | 1,698 | 1.3 | 1,171 | 1.3 | 942 | 0.6 | 731 | 0.6 | 1,189 | 1.1 |
| 6. Basic manufactures | 501 | 0.4 | 1,252 | 1.4 | 1,830 | 1.2 | 1,941 | 1.5 | 1,260 | 1.1 |
| 61. Leather,dressed fur,etc. | ||||||||||
| 62. Rubber manufactures,n.e.s. | 40 | 0.0 | 78 | 0.1 | 234 | 0.2 | 87 | 0.1 | 87 | 0.1 |
| 64. Paper,paperboard and articles thereof | 75 | 0.1 | 123 | 0.1 | 283 | 0.2 | 550 | 0.4 | 19 | 0.0 |
| 65. Textile yarn,fabrics,made up articles,etc. | 14 | 0.0 | 317 | 0.4 | 466 | 0.3 | 181 | 0.1 | 16 | 0.0 |
| 66. Non-metallic mineral manufactures,n.e.s. | 42 | 0.0 | 194 | 0.2 | 389 | 0.3 | 639 | 0.5 | 699 | 0.6 |
| 67. Iron and steel | 157 | 0.1 | 266 | 0.3 | 268 | 0.2 | ||||
| 68. Non-ferrous metals | ||||||||||
| 69. Manufactures of metals,n.e.s. | 115 | 0.1 | 232 | 0.3 | 160 | 0.1 | 223 | 0.2 | 136 | 0.1 |
| 7. Machinery,transport equipment | 13,196 | 10.3 | 13,614 | 15.5 | 13,977 | 9.4 | 16,274 | 12.9 | 15,089 | 13.6 |
| 71. Power generating machinery and equipment | 55 | 0.0 | 94 | 0.1 | 178 | 0.1 | 193 | 0.2 | 446 | 0.4 |
| 72. Machinery for specialized industries | 139 | 0.1 | 575 | 0.7 | 81 | 0.1 | 356 | 0.3 | 242 | 0.2 |
| 73. Metal working machinery | ||||||||||
| 74. General industrial machinery n.e.s. | 2,700 | 2.1 | 4,639 | 5.3 | 4,520 | 3.0 | 4,021 | 3.2 | 3,804 | 3.4 |
| 75. Office machines and adp machines | 33 | 0.0 | 45 | 0.1 | 475 | 0.4 | 70 | 0.1 | ||
| 76. Telecommunications and sound recording equipment | 6,984 | 5.5 | 6,540 | 7.5 | 8,561 | 5.7 | 10,500 | 8.3 | 9,502 | 8.6 |
| 77. Electric machinery,n.e.s.and parts | 790 | 0.6 | 761 | 0.9 | 355 | 0.2 | 501 | 0.4 | 590 | 0.5 |
| 78. Road vehicles | 2,339 | 1.8 | 876 | 1.0 | 176 | 0.1 | 139 | 0.1 | 403 | 0.4 |
| 79. Other transport equipment | 95 | 0.1 | 80 | 0.1 | 32 | 0.0 | ||||
| 8. Miscellaneous manufactured articles | 4,128 | 3.2 | 5,120 | 5.8 | 5,770 | 3.9 | 7,717 | 6.1 | 6,796 | 6.1 |
| 81. Prefabr.buildings;sanitary,lighting etc.fixtrs | 13 | 0.0 | 19 | 0.0 | ||||||
| 82. Furniture and parts thereof | 14 | 0.0 | 417 | 0.5 | 158 | 0.1 | ||||
| 83. Travel goods,handbags and sim.containers | 1 | 0.0 | 9 | 0.0 | 4 | 0.0 | 15 | 0.0 | ||
| 84. Articles of apparel and clothing accessories | 20 | 0.0 | 35 | 0.0 | 83 | 0.1 | 73 | 0.1 | 69 | 0.1 |
| 85. Footwear | 1 | 0.0 | ||||||||
| 87. Instruments and apparates n.e.s. | 3,836 | 3.0 | 4,251 | 4.9 | 4,193 | 2.8 | 4,482 | 3.6 | 3,980 | 3.6 |
| 88. Photographic equipment,optical goods etc. | 35 | 0.0 | 5 | 0.0 | 97 | 0.1 | ||||
| 89. Miscellaneous manufactured articles,n.e.s. | 209 | 0.2 | 349 | 0.4 | 460 | 0.3 | 2,423 | 1.9 | 2,336 | 2.1 |
| 9. Goods not classified elsewhere | 101 | 0.1 | ||||||||
| 97. Gold,non-monetary | ||||||||||
| In Total | 127,879 | 100.0 | 87,583 | 100.0 | 149,102 | 100.0 | 126,216 | 100.0 | 110,959 | 100.0 |

| 2021 | 2022 | 2023 | 2024 | 2025 | ||||||
|---|---|---|---|---|---|---|---|---|---|---|
| 1.000 € | % | 1.000 € | % | 1.000 € | % | 1.000 € | % | 1.000 € | % | |
| 0. Food and live animals | 1,960 | 6.0 | 2,587 | 8.0 | 4,551 | 21.5 | 3,878 | 11.6 | 4,848 | 5.1 |
| 04. Cereals and cereal preparations | 19 | 0.1 | 141 | 0.7 | 102 | 0.3 | 67 | 0.1 | ||
| 05. Vegetables and fruit | 4,344 | 20.5 | ||||||||
| 07. Coffee,tea,cocoa,spices | 4 | 0.0 | 1 | 0.0 | 65 | 0.3 | 29 | 0.1 | 29 | 0.0 |
| 1. Beverages and tobacco | 175 | 0.5 | 38 | 0.0 | ||||||
| 11. Beverages | 175 | 0.5 | ||||||||
| 2. Crude materials,inedible,except fuels | 28,348 | 86.7 | 26,194 | 80.9 | 13,016 | 61.4 | 26,982 | 81.0 | 88,832 | 93.0 |
| 24. Cork and wood | ||||||||||
| 26. Textile fibres and their wastes | 563 | 1.7 | 1,155 | 3.6 | 358 | 1.7 | 393 | 1.2 | 493 | 0.5 |
| 27. Crude fertilizers and crude minerals | ||||||||||
| 28. Metalliferous ores and metal scrap | ||||||||||
| 29. Crude animal,vegetable materials n.e.s. | ||||||||||
| 4. Animal and vegetable oils and fats | ||||||||||
| 42. Fixed vegetable fats and oils | ||||||||||
| 5. Chemicals and related products,n.e.s. | 718 | 2.2 | 1,164 | 3.6 | 633 | 3.0 | 267 | 0.8 | 434 | 0.5 |
| 51. Organic chemicals | 111 | 0.3 | 166 | 0.5 | 265 | 1.2 | 62 | 0.1 | ||
| 52. Inorganic chemicals | 10 | 0.0 | 5 | 0.0 | 5 | 0.0 | ||||
| 54. Medicinal and pharmaceutical products | 11 | 0.0 | 21 | 0.1 | 15 | 0.1 | 21 | 0.1 | 37 | 0.0 |
| 55. Perfume,cleaning etc.preparations | 95 | 0.3 | 136 | 0.4 | 296 | 1.4 | 198 | 0.6 | 236 | 0.2 |
| 57. Plastics in primary forms | 22 | 0.1 | 181 | 0.6 | 28 | 0.1 | 21 | 0.1 | ||
| 58. Plastics in non-primary forms | 424 | 1.3 | 661 | 2.0 | 66 | 0.1 | ||||
| 59. Chemical materials and products,n.e.s. | 46 | 0.1 | 25 | 0.1 | 21 | 0.1 | 25 | 0.0 | ||
| 6. Basic manufactures | 532 | 1.6 | 709 | 2.2 | 999 | 4.7 | 377 | 1.1 | 624 | 0.7 |
| 61. Leather,dressed fur,etc. | ||||||||||
| 62. Rubber manufactures,n.e.s. | 1 | 0.0 | 3 | 0.0 | 9 | 0.0 | 1 | 0.0 | 1 | 0.0 |
| 64. Paper,paperboard and articles thereof | 1 | 0.0 | 4 | 0.0 | 3 | 0.0 | 3 | 0.0 | 2 | 0.0 |
| 65. Textile yarn,fabrics,made up articles,etc. | 68 | 0.2 | 35 | 0.1 | 56 | 0.3 | 38 | 0.1 | 1 | 0.0 |
| 66. Non-metallic mineral manufactures,n.e.s. | 307 | 0.9 | 558 | 1.7 | 904 | 4.3 | 279 | 0.8 | 509 | 0.5 |
| 67. Iron and steel | 139 | 0.4 | 90 | 0.3 | 20 | 0.1 | ||||
| 68. Non-ferrous metals | ||||||||||
| 69. Manufactures of metals,n.e.s. | 16 | 0.0 | 16 | 0.1 | 7 | 0.0 | 5 | 0.0 | 3 | 0.0 |
| 7. Machinery,transport equipment | 765 | 2.3 | 996 | 3.1 | 1,187 | 5.6 | 1,253 | 3.8 | 516 | 0.5 |
| 71. Power generating machinery and equipment | 5 | 0.0 | 7 | 0.0 | 1 | 0.0 | 2 | 0.0 | 184 | 0.2 |
| 72. Machinery for specialized industries | 467 | 1.4 | 107 | 0.3 | 976 | 4.6 | 153 | 0.5 | 30 | 0.0 |
| 73. Metal working machinery | 7 | 0.0 | ||||||||
| 74. General industrial machinery n.e.s. | 38 | 0.1 | 13 | 0.0 | 82 | 0.4 | 34 | 0.1 | 145 | 0.2 |
| 75. Office machines and adp machines | 4 | 0.0 | 17 | 0.1 | 7 | 0.0 | 3 | 0.0 | ||
| 76. Telecommunications and sound recording equipment | 35 | 0.1 | 27 | 0.1 | 8 | 0.0 | 641 | 1.9 | 18 | 0.0 |
| 77. Electric machinery,n.e.s.and parts | 91 | 0.3 | 33 | 0.1 | 62 | 0.3 | 310 | 0.9 | 40 | 0.0 |
| 78. Road vehicles | 39 | 0.1 | 590 | 1.8 | 52 | 0.2 | 105 | 0.3 | 84 | 0.1 |
| 79. Other transport equipment | 87 | 0.3 | 202 | 0.6 | 12 | 0.0 | ||||
| 8. Miscellaneous manufactured articles | 178 | 0.5 | 308 | 1.0 | 657 | 3.1 | 477 | 1.4 | 207 | 0.2 |
| 81. Prefabr.buildings;sanitary,lighting etc.fixtrs | 1 | 0.0 | 2 | 0.0 | ||||||
| 82. Furniture and parts thereof | 2 | 0.0 | ||||||||
| 83. Travel goods,handbags and sim.containers | 1 | 0.0 | 1 | 0.0 | 2 | 0.0 | 1 | 0.0 | ||
| 84. Articles of apparel and clothing accessories | 4 | 0.0 | 1 | 0.0 | 2 | 0.0 | 2 | 0.0 | 9 | 0.0 |
| 85. Footwear | 1 | 0.0 | ||||||||
| 87. Instruments and apparates n.e.s. | 3 | 0.0 | 121 | 0.4 | 487 | 2.3 | 273 | 0.8 | 93 | 0.1 |
| 88. Photographic equipment,optical goods etc. | 1 | 0.0 | ||||||||
| 89. Miscellaneous manufactured articles,n.e.s. | 167 | 0.5 | 180 | 0.6 | 166 | 0.8 | 195 | 0.6 | 100 | 0.1 |
| 9. Goods not classified elsewhere | 3 | 0.0 | ||||||||
| 97. Gold,non-monetary | ||||||||||
| In Total | 32,681 | 100.0 | 32,373 | 100.0 | 21,189 | 100.0 | 33,293 | 100.0 | 95,501 | 100.0 |