
| European countries' export and import of goods | SITC |
Data:Eurostat

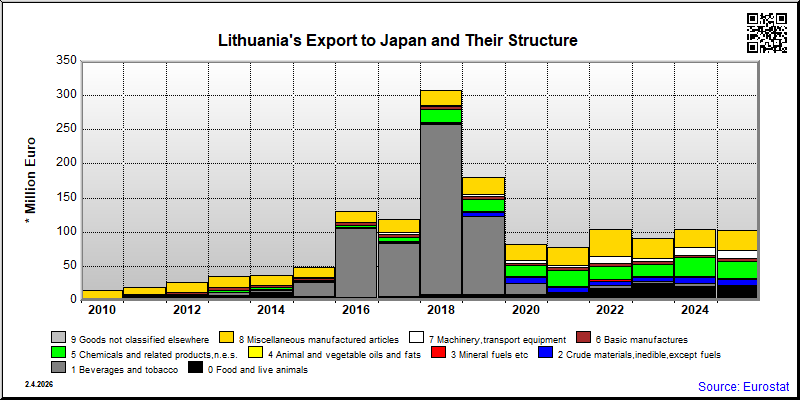
| 2021 | 2022 | 2023 | 2024 | 2025 | ||||||
|---|---|---|---|---|---|---|---|---|---|---|
| 1.000 € | % | 1.000 € | % | 1.000 € | % | 1.000 € | % | 1.000 € | % | |
| 0. Food and live animals | 11,331 | 14.5 | 17,495 | 16.8 | 24,171 | 26.8 | 20,081 | 19.2 | 21,630 | 21.1 |
| 01. Meat and meat preparations | 3,515 | 3.4 | ||||||||
| 02. Dairy products and birds' eggs | 4,109 | 4.0 | 3,445 | 3.4 | ||||||
| 04. Cereals and cereal preparations | 2,939 | 3.8 | 3,267 | 3.1 | 3,268 | 3.6 | 2,847 | 2.7 | 2,224 | 2.2 |
| 05. Vegetables and fruit | 129 | 0.2 | 624 | 0.6 | 215 | 0.2 | 187 | 0.2 | 262 | 0.3 |
| 06. Sugars,sugar preparations and honey | 49 | 0.1 | 490 | 0.5 | 141 | 0.2 | 471 | 0.5 | 133 | 0.1 |
| 07. Coffee,tea,cocoa,spices | 410 | 0.5 | 137 | 0.1 | 311 | 0.3 | 134 | 0.1 | 97 | 0.1 |
| 08. Feeding stuff for animals | 412 | 0.5 | 710 | 0.7 | 1,392 | 1.4 | ||||
| 09. Miscellaneous edible products and preparations | 620 | 0.8 | 688 | 0.7 | 657 | 0.7 | 466 | 0.4 | 568 | 0.6 |
| 1. Beverages and tobacco | 924 | 1.2 | 5,134 | 4.9 | 2,972 | 3.3 | 5,067 | 4.8 | 328 | 0.3 |
| 11. Beverages | 523 | 0.7 | 471 | 0.5 | 293 | 0.3 | 422 | 0.4 | 328 | 0.3 |
| 2. Crude materials,inedible,except fuels | 6,317 | 8.1 | 5,310 | 5.1 | 5,889 | 6.5 | 8,775 | 8.4 | 8,089 | 7.9 |
| 22. Oil seeds,oleaginous fruits | 137 | 0.1 | 11 | 0.0 | ||||||
| 26. Textile fibres and their wastes | 4 | 0.0 | 4 | 0.0 | 37 | 0.0 | ||||
| 28. Metalliferous ores and metal scrap | 6,062 | 7.8 | 4,830 | 4.6 | 5,534 | 6.1 | 8,473 | 8.1 | 7,969 | 7.8 |
| 29. Crude animal,vegetable materials n.e.s. | 90 | 0.1 | ||||||||
| 4. Animal and vegetable oils and fats | 40 | 0.0 | 327 | 0.4 | 194 | 0.2 | 127 | 0.1 | ||
| 42. Fixed vegetable fats and oils | 40 | 0.0 | 327 | 0.4 | 191 | 0.2 | 127 | 0.1 | ||
| 5. Chemicals and related products,n.e.s. | 24,721 | 31.7 | 20,289 | 19.5 | 18,407 | 20.4 | 27,357 | 26.2 | 25,932 | 25.3 |
| 51. Organic chemicals | 3,371 | 4.3 | 1,996 | 1.9 | 2,022 | 2.2 | 3,748 | 3.6 | 2,795 | 2.7 |
| 52. Inorganic chemicals | 43 | 0.1 | 17 | 0.0 | 15 | 0.0 | 32 | 0.0 | 48 | 0.0 |
| 53. Dyeing,tanning and colouring material | 36 | 0.0 | 60 | 0.1 | 21 | 0.0 | 98 | 0.1 | 246 | 0.2 |
| 54. Medicinal and pharmaceutical products | 3,697 | 4.7 | 2,465 | 2.4 | 3,275 | 3.6 | 3,467 | 3.3 | 3,030 | 3.0 |
| 55. Perfume,cleaning etc.preparations | 543 | 0.7 | 691 | 0.7 | 789 | 0.9 | 522 | 0.5 | 927 | 0.9 |
| 57. Plastics in primary forms | 10 | 0.0 | 10 | 0.0 | 18 | 0.0 | 39 | 0.0 | 41 | 0.0 |
| 58. Plastics in non-primary forms | 28 | 0.0 | 36 | 0.0 | 11 | 0.0 | 49 | 0.0 | 102 | 0.1 |
| 59. Chemical materials and products,n.e.s. | 16,993 | 21.8 | 15,012 | 14.4 | 12,193 | 13.5 | 19,279 | 18.4 | 18,538 | 18.1 |
| 6. Basic manufactures | 3,925 | 5.0 | 3,629 | 3.5 | 3,814 | 4.2 | 3,245 | 3.1 | 3,908 | 3.8 |
| 61. Leather,dressed fur,etc. | 2 | 0.0 | ||||||||
| 62. Rubber manufactures,n.e.s. | 8 | 0.0 | 3 | 0.0 | 50 | 0.1 | 97 | 0.1 | 610 | 0.6 |
| 63. Wood and cork manufactures | 284 | 0.4 | 172 | 0.2 | 432 | 0.5 | 129 | 0.1 | 283 | 0.3 |
| 64. Paper,paperboard and articles thereof | 140 | 0.2 | 105 | 0.1 | 77 | 0.1 | 219 | 0.2 | 399 | 0.4 |
| 65. Textile yarn,fabrics,made up articles,etc. | 3,070 | 3.9 | 2,893 | 2.8 | 2,333 | 2.6 | 1,974 | 1.9 | 2,033 | 2.0 |
| 66. Non-metallic mineral manufactures,n.e.s. | 23 | 0.0 | 177 | 0.2 | 250 | 0.3 | 607 | 0.6 | 311 | 0.3 |
| 67. Iron and steel | 2 | 0.0 | 1 | 0.0 | 1 | 0.0 | ||||
| 68. Non-ferrous metals | 96 | 0.1 | 482 | 0.5 | 4 | 0.0 | 3 | 0.0 | ||
| 69. Manufactures of metals,n.e.s. | 401 | 0.5 | 183 | 0.2 | 190 | 0.2 | 211 | 0.2 | 269 | 0.3 |
| 7. Machinery,transport equipment | 2,656 | 3.4 | 11,015 | 10.6 | 4,953 | 5.5 | 11,736 | 11.2 | 11,395 | 11.1 |
| 71. Power generating machinery and equipment | 3 | 0.0 | 6,372 | 6.1 | 6 | 0.0 | 12 | 0.0 | 241 | 0.2 |
| 72. Machinery for specialized industries | 38 | 0.0 | 917 | 0.9 | 281 | 0.3 | 85 | 0.1 | 172 | 0.2 |
| 73. Metal working machinery | 1 | 0.0 | 1 | 0.0 | ||||||
| 74. General industrial machinery n.e.s. | 326 | 0.4 | 169 | 0.2 | 194 | 0.2 | 438 | 0.4 | 2,098 | 2.0 |
| 75. Office machines and adp machines | 171 | 0.2 | 161 | 0.2 | 266 | 0.3 | 582 | 0.6 | 534 | 0.5 |
| 76. Telecommunications and sound recording equipment | 1,684 | 2.2 | 1,232 | 1.2 | 2,335 | 2.6 | 2,695 | 2.6 | 3,289 | 3.2 |
| 77. Electric machinery,n.e.s.and parts | 334 | 0.4 | 1,947 | 1.9 | 1,565 | 1.7 | 7,451 | 7.1 | 3,585 | 3.5 |
| 78. Road vehicles | 100 | 0.1 | 217 | 0.2 | 233 | 0.3 | 470 | 0.4 | 1,467 | 1.4 |
| 79. Other transport equipment | 73 | 0.1 | 2 | 0.0 | 7 | 0.0 | ||||
| 8. Miscellaneous manufactured articles | 26,781 | 34.3 | 38,840 | 37.4 | 28,396 | 31.4 | 26,735 | 25.6 | 29,566 | 28.8 |
| 81. Prefabr.buildings;sanitary,lighting etc.fixtrs | 655 | 0.8 | 1,523 | 1.5 | 217 | 0.2 | 485 | 0.5 | 372 | 0.4 |
| 82. Furniture and parts thereof | 3,564 | 4.6 | 4,129 | 4.0 | 922 | 1.0 | 1,243 | 1.2 | 603 | 0.6 |
| 83. Travel goods,handbags and sim.containers | 147 | 0.2 | 205 | 0.2 | 210 | 0.2 | 207 | 0.2 | 204 | 0.2 |
| 84. Articles of apparel and clothing accessories | 3,643 | 4.7 | 3,632 | 3.5 | 2,874 | 3.2 | 2,789 | 2.7 | 2,633 | 2.6 |
| 85. Footwear | 55 | 0.1 | 38 | 0.0 | 27 | 0.0 | 33 | 0.0 | 30 | 0.0 |
| 87. Instruments and apparates n.e.s. | 15,435 | 19.8 | 19,227 | 18.5 | 20,878 | 23.1 | 19,419 | 18.6 | 20,544 | 20.0 |
| 88. Photographic equipment,optical goods etc. | 2,097 | 2.7 | 2,673 | 2.6 | 2,211 | 2.4 | 1,612 | 1.5 | 1,496 | 1.5 |
| 89. Miscellaneous manufactured articles,n.e.s. | 1,185 | 1.5 | 7,412 | 7.1 | 1,057 | 1.2 | 947 | 0.9 | 3,684 | 3.6 |
| 9. Goods not classified elsewhere | 5 | 0.0 | 4 | 0.0 | 9 | 0.0 | 5 | 0.0 | 7 | 0.0 |
| 93. Special transactions and commodities not classified | 5 | 0.0 | ||||||||
| 97. Gold,non-monetary | 2 | 0.0 | 7 | 0.0 | ||||||
| In Total | 77,976 | 100.0 | 103,937 | 100.0 | 90,299 | 100.0 | 104,563 | 100.0 | 102,489 | 100.0 |

| 2021 | 2022 | 2023 | 2024 | 2025 | ||||||
|---|---|---|---|---|---|---|---|---|---|---|
| 1.000 € | % | 1.000 € | % | 1.000 € | % | 1.000 € | % | 1.000 € | % | |
| 0. Food and live animals | 527 | 0.6 | 851 | 1.0 | 752 | 0.8 | 1,294 | 1.9 | 1,445 | 2.1 |
| 01. Meat and meat preparations | 98 | 0.1 | ||||||||
| 02. Dairy products and birds' eggs | 164 | 0.2 | 59 | 0.1 | ||||||
| 04. Cereals and cereal preparations | 95 | 0.1 | 2 | 0.0 | 16 | 0.0 | ||||
| 05. Vegetables and fruit | 2 | 0.0 | 1 | 0.0 | ||||||
| 06. Sugars,sugar preparations and honey | 6 | 0.0 | 3 | 0.0 | 1 | 0.0 | 24 | 0.0 | 3 | 0.0 |
| 07. Coffee,tea,cocoa,spices | 102 | 0.1 | 100 | 0.1 | 183 | 0.2 | 331 | 0.5 | 485 | 0.7 |
| 08. Feeding stuff for animals | 6 | 0.0 | 17 | 0.0 | ||||||
| 09. Miscellaneous edible products and preparations | 413 | 0.5 | 565 | 0.6 | 473 | 0.5 | 839 | 1.2 | 881 | 1.3 |
| 1. Beverages and tobacco | 612 | 0.7 | 424 | 0.5 | 647 | 0.7 | 902 | 1.3 | 763 | 1.1 |
| 11. Beverages | 612 | 0.7 | 424 | 0.5 | 647 | 0.7 | 902 | 1.3 | 762 | 1.1 |
| 2. Crude materials,inedible,except fuels | 18,178 | 20.7 | 21,778 | 24.9 | 22,863 | 25.5 | 6,588 | 9.6 | 4,162 | 5.9 |
| 22. Oil seeds,oleaginous fruits | 3 | 0.0 | ||||||||
| 26. Textile fibres and their wastes | 18,176 | 20.7 | 21,773 | 24.9 | 6,570 | 9.6 | ||||
| 28. Metalliferous ores and metal scrap | 1 | 0.0 | 2 | 0.0 | 21 | 0.0 | 18 | 0.0 | 21 | 0.0 |
| 29. Crude animal,vegetable materials n.e.s. | 35 | 0.0 | ||||||||
| 4. Animal and vegetable oils and fats | 4 | 0.0 | 36 | 0.0 | ||||||
| 42. Fixed vegetable fats and oils | 4 | 0.0 | 36 | 0.0 | ||||||
| 5. Chemicals and related products,n.e.s. | 5,781 | 6.6 | 6,871 | 7.9 | 4,870 | 5.4 | 8,409 | 12.3 | 12,451 | 17.7 |
| 51. Organic chemicals | 158 | 0.2 | 26 | 0.0 | 1,377 | 1.5 | 3,604 | 5.3 | 2,022 | 2.9 |
| 52. Inorganic chemicals | 224 | 0.3 | 91 | 0.1 | 62 | 0.1 | 63 | 0.1 | 57 | 0.1 |
| 53. Dyeing,tanning and colouring material | 249 | 0.3 | 98 | 0.1 | 90 | 0.1 | 136 | 0.2 | 4,328 | 6.2 |
| 54. Medicinal and pharmaceutical products | 2,376 | 2.7 | 4,316 | 4.9 | 603 | 0.7 | 1,334 | 2.0 | 1,178 | 1.7 |
| 55. Perfume,cleaning etc.preparations | 584 | 0.7 | 237 | 0.3 | 1,077 | 1.2 | 583 | 0.9 | 900 | 1.3 |
| 57. Plastics in primary forms | 121 | 0.1 | 282 | 0.3 | 762 | 0.8 | 1,928 | 2.8 | 3,159 | 4.5 |
| 58. Plastics in non-primary forms | 828 | 0.9 | 85 | 0.1 | 191 | 0.2 | 88 | 0.1 | 137 | 0.2 |
| 59. Chemical materials and products,n.e.s. | 1,240 | 1.4 | 1,737 | 2.0 | 708 | 0.8 | 672 | 1.0 | 671 | 1.0 |
| 6. Basic manufactures | 4,504 | 5.1 | 5,355 | 6.1 | 7,111 | 7.9 | 7,692 | 11.3 | 9,824 | 14.0 |
| 61. Leather,dressed fur,etc. | 10 | 0.0 | 18 | 0.0 | ||||||
| 62. Rubber manufactures,n.e.s. | 1,218 | 1.4 | 1,525 | 1.7 | 1,968 | 2.2 | 1,936 | 2.8 | 2,213 | 3.1 |
| 63. Wood and cork manufactures | 8 | 0.0 | 12 | 0.0 | 29 | 0.0 | 26 | 0.0 | 5 | 0.0 |
| 64. Paper,paperboard and articles thereof | 1,382 | 1.6 | 1,687 | 1.9 | 2,780 | 3.1 | 3,724 | 5.5 | 4,746 | 6.7 |
| 65. Textile yarn,fabrics,made up articles,etc. | 1,132 | 1.3 | 1,012 | 1.2 | 1,132 | 1.3 | 986 | 1.4 | 1,446 | 2.1 |
| 66. Non-metallic mineral manufactures,n.e.s. | 108 | 0.1 | 278 | 0.3 | 318 | 0.4 | 340 | 0.5 | 450 | 0.6 |
| 67. Iron and steel | 36 | 0.0 | 129 | 0.1 | 3 | 0.0 | 5 | 0.0 | ||
| 68. Non-ferrous metals | 53 | 0.1 | 162 | 0.2 | 95 | 0.1 | 35 | 0.1 | 65 | 0.1 |
| 69. Manufactures of metals,n.e.s. | 539 | 0.6 | 632 | 0.7 | 650 | 0.7 | 622 | 0.9 | 895 | 1.3 |
| 7. Machinery,transport equipment | 52,527 | 60.0 | 46,273 | 52.9 | 47,096 | 52.5 | 36,384 | 53.2 | 35,160 | 50.0 |
| 71. Power generating machinery and equipment | 8,885 | 10.1 | 1,928 | 2.2 | 2,968 | 3.3 | 2,521 | 3.7 | 2,633 | 3.7 |
| 72. Machinery for specialized industries | 12,651 | 14.4 | 14,686 | 16.8 | 13,459 | 15.0 | 11,101 | 16.2 | 10,748 | 15.3 |
| 73. Metal working machinery | 203 | 0.3 | 193 | 0.3 | ||||||
| 74. General industrial machinery n.e.s. | 2,495 | 2.8 | 7,227 | 8.3 | 2,974 | 3.3 | 2,775 | 4.1 | 1,702 | 2.4 |
| 75. Office machines and adp machines | 12,477 | 14.2 | 3,024 | 3.5 | 4,684 | 5.2 | 5,677 | 8.3 | 6,996 | 9.9 |
| 76. Telecommunications and sound recording equipment | 708 | 0.8 | 808 | 0.9 | 440 | 0.5 | 876 | 1.3 | 1,599 | 2.3 |
| 77. Electric machinery,n.e.s.and parts | 7,859 | 9.0 | 9,676 | 11.1 | 12,150 | 13.5 | 7,248 | 10.6 | 4,518 | 6.4 |
| 78. Road vehicles | 7,171 | 8.2 | 8,491 | 9.7 | 9,947 | 11.1 | 5,900 | 8.6 | 6,740 | 9.6 |
| 79. Other transport equipment | 272 | 0.3 | 82 | 0.1 | 30 | 0.0 | ||||
| 8. Miscellaneous manufactured articles | 5,433 | 6.2 | 5,911 | 6.8 | 6,345 | 7.1 | 7,064 | 10.3 | 6,543 | 9.3 |
| 81. Prefabr.buildings;sanitary,lighting etc.fixtrs | 66 | 0.1 | 77 | 0.1 | 79 | 0.1 | 130 | 0.2 | 44 | 0.1 |
| 82. Furniture and parts thereof | 19 | 0.0 | 25 | 0.0 | 44 | 0.0 | 14 | 0.0 | 15 | 0.0 |
| 83. Travel goods,handbags and sim.containers | 32 | 0.0 | 32 | 0.0 | 38 | 0.0 | 67 | 0.1 | 154 | 0.2 |
| 84. Articles of apparel and clothing accessories | 174 | 0.2 | 324 | 0.4 | 339 | 0.4 | 453 | 0.7 | 328 | 0.5 |
| 85. Footwear | 33 | 0.0 | 34 | 0.0 | 13 | 0.0 | 31 | 0.0 | 37 | 0.1 |
| 87. Instruments and apparates n.e.s. | 2,387 | 2.7 | 2,307 | 2.6 | 2,809 | 3.1 | 2,558 | 3.7 | 2,357 | 3.4 |
| 88. Photographic equipment,optical goods etc. | 662 | 0.8 | 610 | 0.7 | 672 | 0.7 | 1,907 | 2.8 | 1,447 | 2.1 |
| 89. Miscellaneous manufactured articles,n.e.s. | 2,059 | 2.4 | 2,502 | 2.9 | 2,350 | 2.6 | 1,904 | 2.8 | 2,161 | 3.1 |
| 9. Goods not classified elsewhere | 53 | 0.1 | 22 | 0.0 | 3 | 0.0 | 1 | 0.0 | 3 | 0.0 |
| 93. Special transactions and commodities not classified | 49 | 0.1 | ||||||||
| 97. Gold,non-monetary | 17 | 0.0 | ||||||||
| In Total | 87,613 | 100.0 | 87,488 | 100.0 | 89,722 | 100.0 | 68,334 | 100.0 | 70,350 | 100.0 |