
| European countries' export and import of goods | SITC |
Data:Eurostat


| 2021 | 2022 | 2023 | 2024 | 2025 | ||||||
|---|---|---|---|---|---|---|---|---|---|---|
| 1.000 € | % | 1.000 € | % | 1.000 € | % | 1.000 € | % | 1.000 € | % | |
| 0. Food and live animals | 10,264 | 1.4 | 13,189 | 1.9 | 11,018 | 2.6 | 9,911 | 2.1 | 14,813 | 3.1 |
| 00. Live animals | ||||||||||
| 01. Meat and meat preparations | ||||||||||
| 03. Fish and fish preparations | ||||||||||
| 04. Cereals and cereal preparations | 1,304 | 0.2 | 1,341 | 0.2 | 1,709 | 0.4 | 2,073 | 0.4 | 2,285 | 0.5 |
| 05. Vegetables and fruit | 229 | 0.0 | 337 | 0.0 | 193 | 0.0 | 230 | 0.0 | 130 | 0.0 |
| 06. Sugars,sugar preparations and honey | 4,180 | 0.6 | 6,999 | 1.0 | 5,984 | 1.4 | 3,330 | 0.7 | 5,041 | 1.1 |
| 07. Coffee,tea,cocoa,spices | 2,512 | 0.3 | 1,636 | 0.2 | 901 | 0.2 | 1,875 | 0.4 | 2,434 | 0.5 |
| 08. Feeding stuff for animals | 722 | 0.1 | 850 | 0.1 | 505 | 0.1 | 994 | 0.2 | 1,695 | 0.4 |
| 09. Miscellaneous edible products and preparations | 900 | 0.1 | 1,434 | 0.2 | 943 | 0.2 | 914 | 0.2 | 2,562 | 0.5 |
| 1. Beverages and tobacco | 426 | 0.1 | 732 | 0.1 | 851 | 0.2 | 803 | 0.2 | 1,267 | 0.3 |
| 11. Beverages | 426 | 0.1 | 732 | 0.1 | 851 | 0.2 | 803 | 0.2 | 1,267 | 0.3 |
| 12. Tobacco and tobacco manufactures | ||||||||||
| 2. Crude materials,inedible,except fuels | 57,622 | 7.6 | 42,402 | 6.2 | 30,686 | 7.2 | 48,961 | 10.6 | 19,600 | 4.1 |
| 21. Hides,skins,furskins,raw | 207 | 0.0 | 90 | 0.0 | ||||||
| 22. Oil seeds,oleaginous fruits | 7 | 0.0 | ||||||||
| 24. Cork and wood | 1,901 | 0.4 | ||||||||
| 26. Textile fibres and their wastes | 4,345 | 0.6 | 5,028 | 0.7 | 2,236 | 0.5 | 3,487 | 0.8 | 3,079 | 0.6 |
| 27. Crude fertilizers and crude minerals | 3,494 | 0.5 | 3,261 | 0.5 | 4,559 | 1.1 | 5,782 | 1.2 | 5,171 | 1.1 |
| 28. Metalliferous ores and metal scrap | 39,509 | 5.2 | 29,140 | 4.2 | 18,139 | 4.2 | 32,584 | 7.0 | 4,204 | 0.9 |
| 29. Crude animal,vegetable materials n.e.s. | 1,068 | 0.1 | 1,768 | 0.3 | 2,318 | 0.5 | 1,793 | 0.4 | 1,687 | 0.4 |
| 3. Mineral fuels etc | 6,168 | 1.4 | 5,969 | 1.3 | 5,005 | 1.0 | ||||
| 33. Petroleum and products | 1,833 | 0.4 | 2,137 | 0.4 | ||||||
| 4. Animal and vegetable oils and fats | 1,535 | 0.2 | 1,440 | 0.2 | 1,175 | 0.3 | 1,109 | 0.2 | 2,224 | 0.5 |
| 42. Fixed vegetable fats and oils | 1,469 | 0.2 | 1,412 | 0.2 | 1,173 | 0.3 | 1,099 | 0.2 | 2,183 | 0.5 |
| 5. Chemicals and related products,n.e.s. | 102,439 | 13.6 | 119,798 | 17.5 | 95,413 | 22.3 | 89,168 | 19.2 | 90,834 | 19.0 |
| 51. Organic chemicals | 7,499 | 1.0 | 5,760 | 0.8 | 5,146 | 1.2 | 4,407 | 1.0 | 5,776 | 1.2 |
| 52. Inorganic chemicals | 1,399 | 0.2 | 1,272 | 0.2 | 797 | 0.2 | 1,964 | 0.4 | 696 | 0.1 |
| 53. Dyeing,tanning and colouring material | 17,051 | 2.3 | 14,050 | 2.0 | 10,534 | 2.5 | 9,870 | 2.1 | 9,740 | 2.0 |
| 54. Medicinal and pharmaceutical products | 34,152 | 4.5 | 46,111 | 6.7 | 39,073 | 9.1 | 37,093 | 8.0 | 34,026 | 7.1 |
| 55. Perfume,cleaning etc.preparations | 7,732 | 1.0 | 9,651 | 1.4 | 7,351 | 1.7 | 9,376 | 2.0 | 9,694 | 2.0 |
| 57. Plastics in primary forms | 10,587 | 1.4 | 10,780 | 1.6 | 6,785 | 1.6 | 6,645 | 1.4 | 6,197 | 1.3 |
| 58. Plastics in non-primary forms | 3,320 | 0.4 | 3,573 | 0.5 | 3,002 | 0.7 | 3,229 | 0.7 | 2,862 | 0.6 |
| 59. Chemical materials and products,n.e.s. | 19,129 | 2.5 | 27,936 | 4.1 | 21,662 | 5.1 | 16,127 | 3.5 | 20,511 | 4.3 |
| 6. Basic manufactures | 52,891 | 7.0 | 54,079 | 7.9 | 37,839 | 8.8 | 43,878 | 9.5 | 38,381 | 8.0 |
| 61. Leather,dressed fur,etc. | 1,133 | 0.2 | 2,389 | 0.3 | 2,429 | 0.6 | 2,814 | 0.6 | 3,019 | 0.6 |
| 62. Rubber manufactures,n.e.s. | 4,560 | 0.6 | 6,005 | 0.9 | 5,938 | 1.4 | 4,267 | 0.9 | 2,875 | 0.6 |
| 63. Wood and cork manufactures | 736 | 0.1 | 876 | 0.1 | 275 | 0.1 | 298 | 0.1 | 263 | 0.1 |
| 64. Paper,paperboard and articles thereof | 7,073 | 0.9 | 9,791 | 1.4 | 5,348 | 1.2 | 8,898 | 1.9 | 6,778 | 1.4 |
| 65. Textile yarn,fabrics,made up articles,etc. | 10,066 | 1.3 | 10,109 | 1.5 | 7,702 | 1.8 | 9,319 | 2.0 | 6,293 | 1.3 |
| 66. Non-metallic mineral manufactures,n.e.s. | 6,242 | 0.8 | 7,042 | 1.0 | 6,689 | 1.6 | 7,030 | 1.5 | 6,446 | 1.3 |
| 67. Iron and steel | 13,706 | 1.8 | 9,114 | 1.3 | 3,791 | 0.9 | 4,200 | 0.9 | 4,761 | 1.0 |
| 68. Non-ferrous metals | 962 | 0.1 | 1,148 | 0.2 | 959 | 0.2 | 2,463 | 0.5 | 3,516 | 0.7 |
| 69. Manufactures of metals,n.e.s. | 8,406 | 1.1 | 7,606 | 1.1 | 4,709 | 1.1 | 4,588 | 1.0 | 4,430 | 0.9 |
| 7. Machinery,transport equipment | 424,437 | 56.3 | 341,693 | 49.8 | 200,726 | 46.9 | 220,936 | 47.6 | 214,337 | 44.7 |
| 71. Power generating machinery and equipment | 15,922 | 2.1 | 15,511 | 2.3 | 8,682 | 2.0 | 10,821 | 2.3 | 8,187 | 1.7 |
| 72. Machinery for specialized industries | 231,939 | 30.8 | 151,382 | 22.1 | 73,414 | 17.1 | 88,427 | 19.1 | 105,280 | 22.0 |
| 73. Metal working machinery | 8,438 | 1.1 | 8,315 | 1.2 | 5,935 | 1.4 | 4,896 | 1.1 | 11,235 | 2.3 |
| 74. General industrial machinery n.e.s. | 77,932 | 10.3 | 70,247 | 10.2 | 72,839 | 17.0 | 66,270 | 14.3 | 42,873 | 8.9 |
| 75. Office machines and adp machines | 6,210 | 0.8 | 4,052 | 0.6 | 3,987 | 0.9 | 4,041 | 0.9 | 5,879 | 1.2 |
| 76. Telecommunications and sound recording equipment | 44,212 | 5.9 | 43,600 | 6.4 | 5,649 | 1.3 | 14,537 | 3.1 | 10,850 | 2.3 |
| 77. Electric machinery,n.e.s.and parts | 31,922 | 4.2 | 43,165 | 6.3 | 29,484 | 6.9 | 30,087 | 6.5 | 27,519 | 5.7 |
| 78. Road vehicles | 1,150 | 0.2 | 5,312 | 0.8 | 693 | 0.2 | 1,463 | 0.3 | 2,093 | 0.4 |
| 79. Other transport equipment | 1,157 | 0.2 | 109 | 0.0 | 43 | 0.0 | 394 | 0.1 | 422 | 0.1 |
| 8. Miscellaneous manufactured articles | 89,095 | 11.8 | 58,937 | 8.6 | 32,033 | 7.5 | 28,360 | 6.1 | 31,129 | 6.5 |
| 81. Prefabr.buildings;sanitary,lighting etc.fixtrs | 1,724 | 0.2 | 1,265 | 0.2 | 1,397 | 0.3 | 1,547 | 0.3 | 1,136 | 0.2 |
| 82. Furniture and parts thereof | 3,695 | 0.5 | 2,799 | 0.4 | 2,493 | 0.6 | 2,128 | 0.5 | 2,125 | 0.4 |
| 83. Travel goods,handbags and sim.containers | 261 | 0.0 | 81 | 0.0 | 92 | 0.0 | 22 | 0.0 | 212 | 0.0 |
| 84. Articles of apparel and clothing accessories | 1,505 | 0.2 | 1,369 | 0.2 | 797 | 0.2 | 768 | 0.2 | 1,193 | 0.2 |
| 85. Footwear | 834 | 0.1 | 852 | 0.1 | 413 | 0.1 | 247 | 0.1 | 512 | 0.1 |
| 87. Instruments and apparates n.e.s. | 33,409 | 4.4 | 32,968 | 4.8 | 15,298 | 3.6 | 14,444 | 3.1 | 15,880 | 3.3 |
| 88. Photographic equipment,optical goods etc. | 723 | 0.2 | 1,594 | 0.3 | 1,125 | 0.2 | ||||
| 89. Miscellaneous manufactured articles,n.e.s. | 13,168 | 1.7 | 17,229 | 2.5 | 10,821 | 2.5 | 7,610 | 1.6 | 8,946 | 1.9 |
| 9. Goods not classified elsewhere | 42 | 0.0 | ||||||||
| 93. Special transactions and commodities not classified | 42 | 0.0 | ||||||||
| In Total | 753,377 | 100.0 | 686,026 | 100.0 | 428,407 | 100.0 | 463,782 | 100.0 | 479,185 | 100.0 |
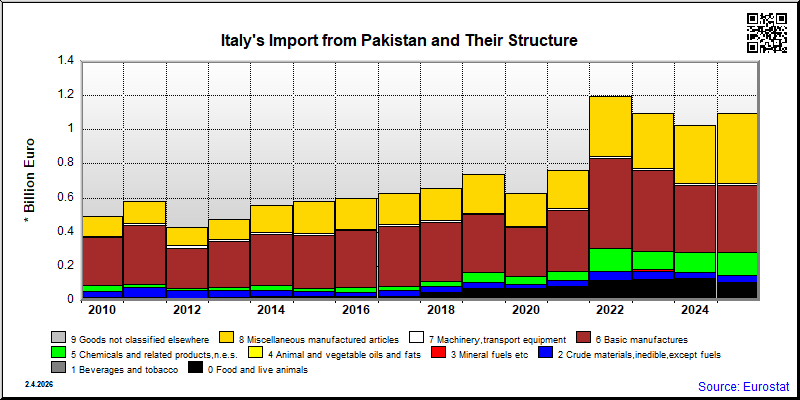
| 2021 | 2022 | 2023 | 2024 | 2025 | ||||||
|---|---|---|---|---|---|---|---|---|---|---|
| 1.000 € | % | 1.000 € | % | 1.000 € | % | 1.000 € | % | 1.000 € | % | |
| 0. Food and live animals | 77,741 | 10.2 | 110,594 | 9.2 | 115,540 | 10.6 | 124,697 | 12.1 | 98,796 | 9.0 |
| 00. Live animals | ||||||||||
| 01. Meat and meat preparations | ||||||||||
| 03. Fish and fish preparations | ||||||||||
| 04. Cereals and cereal preparations | 69,212 | 9.1 | 87,076 | 7.3 | 105,568 | 9.6 | 106,319 | 10.3 | 84,377 | 7.7 |
| 05. Vegetables and fruit | 3,553 | 0.5 | 3,387 | 0.3 | 4,269 | 0.4 | 5,090 | 0.5 | 5,453 | 0.5 |
| 06. Sugars,sugar preparations and honey | 432 | 0.1 | 14,498 | 1.2 | 870 | 0.1 | 7,397 | 0.7 | 881 | 0.1 |
| 07. Coffee,tea,cocoa,spices | 1,213 | 0.2 | 1,031 | 0.1 | 1,021 | 0.1 | 1,268 | 0.1 | 2,187 | 0.2 |
| 08. Feeding stuff for animals | 2,070 | 0.3 | 2,860 | 0.2 | 56 | 0.0 | 16 | 0.0 | 20 | 0.0 |
| 09. Miscellaneous edible products and preparations | 1,257 | 0.2 | 1,729 | 0.1 | 2,859 | 0.3 | 2,930 | 0.3 | 3,424 | 0.3 |
| 1. Beverages and tobacco | 3,066 | 0.4 | 6,552 | 0.5 | 7,772 | 0.7 | 6,884 | 0.7 | 8,010 | 0.7 |
| 11. Beverages | 328 | 0.0 | 476 | 0.0 | 950 | 0.1 | 1,179 | 0.1 | 1,668 | 0.2 |
| 12. Tobacco and tobacco manufactures | ||||||||||
| 2. Crude materials,inedible,except fuels | 35,544 | 4.7 | 50,849 | 4.2 | 47,681 | 4.4 | 33,432 | 3.3 | 37,654 | 3.4 |
| 21. Hides,skins,furskins,raw | 8 | 0.0 | 4 | 0.0 | ||||||
| 22. Oil seeds,oleaginous fruits | 364 | 0.0 | ||||||||
| 24. Cork and wood | 29 | 0.0 | ||||||||
| 26. Textile fibres and their wastes | 11,599 | 1.5 | 19,715 | 1.6 | 17,279 | 1.6 | 10,818 | 1.1 | 7,552 | 0.7 |
| 27. Crude fertilizers and crude minerals | 13,619 | 1.8 | 23,523 | 2.0 | 16,348 | 1.5 | 13,371 | 1.3 | 15,972 | 1.5 |
| 28. Metalliferous ores and metal scrap | 5,560 | 0.7 | 2,480 | 0.2 | 6,481 | 0.6 | 2,173 | 0.2 | 7,133 | 0.7 |
| 29. Crude animal,vegetable materials n.e.s. | 3,805 | 0.5 | 4,767 | 0.4 | 6,203 | 0.6 | 6,019 | 0.6 | 6,036 | 0.6 |
| 3. Mineral fuels etc | 13,148 | 1.2 | 365 | 0.0 | ||||||
| 33. Petroleum and products | 13,148 | 1.2 | 365 | 0.0 | ||||||
| 4. Animal and vegetable oils and fats | 33 | 0.0 | 53 | 0.0 | 11 | 0.0 | 193 | 0.0 | 71 | 0.0 |
| 42. Fixed vegetable fats and oils | 33 | 0.0 | 53 | 0.0 | 11 | 0.0 | 193 | 0.0 | 71 | 0.0 |
| 5. Chemicals and related products,n.e.s. | 50,791 | 6.7 | 139,169 | 11.6 | 104,060 | 9.5 | 118,772 | 11.6 | 133,797 | 12.2 |
| 51. Organic chemicals | 31,364 | 4.1 | 82,963 | 6.9 | 57,731 | 5.3 | 50,938 | 5.0 | 80,922 | 7.4 |
| 52. Inorganic chemicals | 1 | 0.0 | 50 | 0.0 | 4,427 | 0.4 | 3,623 | 0.4 | 1 | 0.0 |
| 53. Dyeing,tanning and colouring material | 85 | 0.0 | 28 | 0.0 | 81 | 0.0 | 243 | 0.0 | 217 | 0.0 |
| 54. Medicinal and pharmaceutical products | 1 | 0.0 | 129 | 0.0 | 65 | 0.0 | 42 | 0.0 | 91 | 0.0 |
| 55. Perfume,cleaning etc.preparations | 28 | 0.0 | 23 | 0.0 | 52 | 0.0 | 37 | 0.0 | 30 | 0.0 |
| 57. Plastics in primary forms | 16,705 | 2.2 | 51,429 | 4.3 | 35,268 | 3.2 | 58,709 | 5.7 | 47,962 | 4.4 |
| 58. Plastics in non-primary forms | 2,524 | 0.3 | 4,277 | 0.4 | 3,696 | 0.3 | 4,942 | 0.5 | 4,327 | 0.4 |
| 59. Chemical materials and products,n.e.s. | 82 | 0.0 | 269 | 0.0 | 2,719 | 0.2 | 212 | 0.0 | 241 | 0.0 |
| 6. Basic manufactures | 358,102 | 46.9 | 523,313 | 43.7 | 473,425 | 43.3 | 392,423 | 38.2 | 396,554 | 36.2 |
| 61. Leather,dressed fur,etc. | 32,280 | 4.2 | 37,062 | 3.1 | 27,327 | 2.5 | 22,770 | 2.2 | 23,628 | 2.2 |
| 62. Rubber manufactures,n.e.s. | 253 | 0.0 | 407 | 0.0 | 569 | 0.1 | 646 | 0.1 | 677 | 0.1 |
| 63. Wood and cork manufactures | 41 | 0.0 | 55 | 0.0 | 44 | 0.0 | 59 | 0.0 | 78 | 0.0 |
| 64. Paper,paperboard and articles thereof | 49 | 0.0 | 154 | 0.0 | 246 | 0.0 | 99 | 0.0 | 17 | 0.0 |
| 65. Textile yarn,fabrics,made up articles,etc. | 317,489 | 41.6 | 476,542 | 39.8 | 434,097 | 39.7 | 360,806 | 35.1 | 364,837 | 33.3 |
| 66. Non-metallic mineral manufactures,n.e.s. | 560 | 0.1 | 541 | 0.0 | 1,046 | 0.1 | 751 | 0.1 | 988 | 0.1 |
| 67. Iron and steel | 392 | 0.1 | 1,041 | 0.1 | 369 | 0.0 | 35 | 0.0 | 150 | 0.0 |
| 68. Non-ferrous metals | 11 | 0.0 | 16 | 0.0 | 2,707 | 0.2 | 1,076 | 0.1 | 622 | 0.1 |
| 69. Manufactures of metals,n.e.s. | 7,027 | 0.9 | 7,494 | 0.6 | 6,402 | 0.6 | 5,579 | 0.5 | 5,364 | 0.5 |
| 7. Machinery,transport equipment | 12,478 | 1.6 | 12,765 | 1.1 | 11,778 | 1.1 | 7,994 | 0.8 | 7,552 | 0.7 |
| 71. Power generating machinery and equipment | 95 | 0.0 | 236 | 0.0 | 1,077 | 0.1 | 1,133 | 0.1 | 400 | 0.0 |
| 72. Machinery for specialized industries | 337 | 0.0 | 620 | 0.1 | 334 | 0.0 | 315 | 0.0 | 400 | 0.0 |
| 73. Metal working machinery | 52 | 0.0 | 402 | 0.0 | 57 | 0.0 | 28 | 0.0 | 50 | 0.0 |
| 74. General industrial machinery n.e.s. | 647 | 0.1 | 1,165 | 0.1 | 1,741 | 0.2 | 1,250 | 0.1 | 1,453 | 0.1 |
| 75. Office machines and adp machines | 582 | 0.1 | 191 | 0.0 | 382 | 0.0 | 94 | 0.0 | 33 | 0.0 |
| 76. Telecommunications and sound recording equipment | 3,309 | 0.4 | 4,863 | 0.4 | 3,519 | 0.3 | 791 | 0.1 | 1,211 | 0.1 |
| 77. Electric machinery,n.e.s.and parts | 841 | 0.1 | 697 | 0.1 | 406 | 0.0 | 794 | 0.1 | 430 | 0.0 |
| 78. Road vehicles | 3,887 | 0.5 | 4,589 | 0.4 | 4,120 | 0.4 | 3,572 | 0.3 | 3,490 | 0.3 |
| 79. Other transport equipment | 2,600 | 0.3 | 2 | 0.0 | 128 | 0.0 | 1 | 0.0 | 85 | 0.0 |
| 8. Miscellaneous manufactured articles | 225,530 | 29.5 | 351,583 | 29.4 | 320,518 | 29.3 | 343,141 | 33.4 | 411,935 | 37.6 |
| 81. Prefabr.buildings;sanitary,lighting etc.fixtrs | 762 | 0.1 | 809 | 0.1 | 500 | 0.0 | 609 | 0.1 | 553 | 0.1 |
| 82. Furniture and parts thereof | 1,320 | 0.2 | 892 | 0.1 | 2,213 | 0.2 | 2,025 | 0.2 | 6,459 | 0.6 |
| 83. Travel goods,handbags and sim.containers | 2,715 | 0.4 | 4,205 | 0.4 | 4,256 | 0.4 | 7,738 | 0.8 | 6,282 | 0.6 |
| 84. Articles of apparel and clothing accessories | 189,449 | 24.8 | 294,138 | 24.6 | 262,702 | 24.0 | 287,230 | 27.9 | 351,585 | 32.1 |
| 85. Footwear | 14,351 | 1.9 | 25,338 | 2.1 | 24,927 | 2.3 | 18,379 | 1.8 | 17,574 | 1.6 |
| 87. Instruments and apparates n.e.s. | 6,914 | 0.9 | 8,751 | 0.7 | 8,645 | 0.8 | 7,099 | 0.7 | 8,407 | 0.8 |
| 88. Photographic equipment,optical goods etc. | 137 | 0.0 | 3 | 0.0 | 10 | 0.0 | ||||
| 89. Miscellaneous manufactured articles,n.e.s. | 10,010 | 1.3 | 17,451 | 1.5 | 16,021 | 1.5 | 18,800 | 1.8 | 20,676 | 1.9 |
| 9. Goods not classified elsewhere | 80 | 0.0 | ||||||||
| 93. Special transactions and commodities not classified | 80 | 0.0 | ||||||||
| In Total | 763,365 | 100.0 | 1,196,864 | 100.0 | 1,094,517 | 100.0 | 1,027,881 | 100.0 | 1,094,934 | 100.0 |