
| European countries' export and import of goods | SITC |
Data:Eurostat
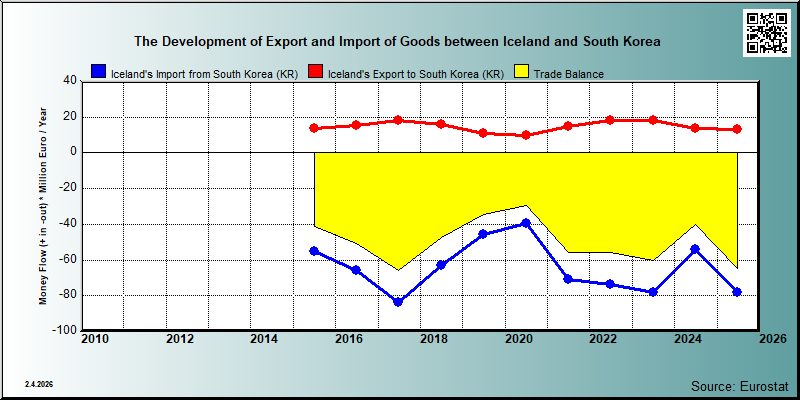

| 2021 | 2022 | 2023 | 2024 | 2025 | ||||||
|---|---|---|---|---|---|---|---|---|---|---|
| 1.000 € | % | 1.000 € | % | 1.000 € | % | 1.000 € | % | 1.000 € | % | |
| 0. Food and live animals | 11,795 | 79.0 | 16,219 | 89.3 | 13,591 | 74.8 | 7,880 | 57.4 | 8,594 | 64.6 |
| 01. Meat and meat preparations | ||||||||||
| 02. Dairy products and birds' eggs | ||||||||||
| 03. Fish and fish preparations | 11,153 | 74.7 | 14,497 | 79.8 | 11,115 | 61.2 | 7,185 | 52.3 | 8,000 | 60.2 |
| 04. Cereals and cereal preparations | ||||||||||
| 05. Vegetables and fruit | ||||||||||
| 06. Sugars,sugar preparations and honey | ||||||||||
| 07. Coffee,tea,cocoa,spices | ||||||||||
| 08. Feeding stuff for animals | 2,142 | 11.8 | 363 | 2.6 | 340 | 2.6 | ||||
| 09. Miscellaneous edible products and preparations | 387 | 2.6 | 1,131 | 6.2 | 335 | 1.8 | 331 | 2.4 | 253 | 1.9 |
| 1. Beverages and tobacco | 11 | 0.1 | 18 | 0.1 | 11 | 0.1 | 11 | 0.1 | ||
| 11. Beverages | 11 | 0.1 | 18 | 0.1 | 11 | 0.1 | 11 | 0.1 | ||
| 2. Crude materials,inedible,except fuels | 16 | 0.1 | 18 | 0.1 | 99 | 0.7 | ||||
| 23. Crude rubber (incl.synthetic) | ||||||||||
| 25. Pulp and waste paper | ||||||||||
| 26. Textile fibres and their wastes | ||||||||||
| 28. Metalliferous ores and metal scrap | ||||||||||
| 29. Crude animal,vegetable materials n.e.s. | 16 | 0.1 | 18 | 0.1 | 99 | 0.7 | ||||
| 3. Mineral fuels etc | ||||||||||
| 33. Petroleum and products | ||||||||||
| 34. Gas,natural and manufactured | ||||||||||
| 4. Animal and vegetable oils and fats | 255 | 1.7 | 70 | 0.4 | 151 | 0.8 | 488 | 3.6 | 144 | 1.1 |
| 42. Fixed vegetable fats and oils | ||||||||||
| 5. Chemicals and related products,n.e.s. | 201 | 1.3 | 300 | 1.7 | 540 | 3.0 | 149 | 1.1 | 6 | 0.0 |
| 51. Organic chemicals | 1 | 0.0 | ||||||||
| 52. Inorganic chemicals | ||||||||||
| 53. Dyeing,tanning and colouring material | 364 | 2.0 | ||||||||
| 54. Medicinal and pharmaceutical products | 87 | 0.6 | 143 | 0.8 | 173 | 1.0 | 28 | 0.2 | ||
| 55. Perfume,cleaning etc.preparations | 100 | 0.7 | 146 | 0.8 | ||||||
| 57. Plastics in primary forms | 113 | 0.8 | ||||||||
| 58. Plastics in non-primary forms | ||||||||||
| 59. Chemical materials and products,n.e.s. | 14 | 0.1 | 10 | 0.1 | 1 | 0.0 | 8 | 0.1 | 4 | 0.0 |
| 6. Basic manufactures | 442 | 3.0 | 11 | 0.1 | 187 | 1.0 | 58 | 0.4 | 129 | 1.0 |
| 61. Leather,dressed fur,etc. | ||||||||||
| 62. Rubber manufactures,n.e.s. | 55 | 0.4 | 147 | 0.8 | ||||||
| 63. Wood and cork manufactures | 2 | 0.0 | ||||||||
| 64. Paper,paperboard and articles thereof | 1 | 0.0 | 1 | 0.0 | ||||||
| 65. Textile yarn,fabrics,made up articles,etc. | 155 | 1.0 | 3 | 0.0 | 8 | 0.1 | 8 | 0.1 | ||
| 66. Non-metallic mineral manufactures,n.e.s. | 10 | 0.1 | ||||||||
| 67. Iron and steel | ||||||||||
| 68. Non-ferrous metals | 211 | 1.4 | 2 | 0.0 | ||||||
| 69. Manufactures of metals,n.e.s. | 17 | 0.1 | 10 | 0.1 | 26 | 0.1 | 50 | 0.4 | 119 | 0.9 |
| 7. Machinery,transport equipment | 1,595 | 10.7 | 1,033 | 5.7 | 2,309 | 12.7 | 3,626 | 26.4 | 4,142 | 31.2 |
| 71. Power generating machinery and equipment | 85 | 0.6 | 8 | 0.0 | 1 | 0.0 | 10 | 0.1 | 8 | 0.1 |
| 72. Machinery for specialized industries | 82 | 0.6 | 1 | 0.0 | 738 | 4.1 | 695 | 5.1 | ||
| 73. Metal working machinery | 4 | 0.0 | 50 | 0.3 | ||||||
| 74. General industrial machinery n.e.s. | 1,310 | 8.8 | 800 | 4.4 | 1,280 | 7.0 | 1,420 | 10.3 | 1,211 | 9.1 |
| 75. Office machines and adp machines | 4 | 0.0 | 3 | 0.0 | 42 | 0.2 | 75 | 0.5 | 358 | 2.7 |
| 76. Telecommunications and sound recording equipment | 2 | 0.0 | 14 | 0.1 | 11 | 0.1 | 162 | 1.2 | ||
| 77. Electric machinery,n.e.s.and parts | 93 | 0.6 | 215 | 1.2 | 127 | 0.7 | 406 | 3.0 | 417 | 3.1 |
| 78. Road vehicles | 21 | 0.1 | 1 | 0.0 | 57 | 0.3 | 13 | 0.1 | ||
| 79. Other transport equipment | 995 | 7.3 | 1,987 | 14.9 | ||||||
| 8. Miscellaneous manufactured articles | 431 | 2.9 | 496 | 2.7 | 1,364 | 7.5 | 1,514 | 11.0 | 169 | 1.3 |
| 81. Prefabr.buildings;sanitary,lighting etc.fixtrs | 3 | 0.0 | 2 | 0.0 | ||||||
| 82. Furniture and parts thereof | ||||||||||
| 83. Travel goods,handbags and sim.containers | ||||||||||
| 84. Articles of apparel and clothing accessories | 12 | 0.1 | 3 | 0.0 | 8 | 0.0 | 15 | 0.1 | 4 | 0.0 |
| 85. Footwear | ||||||||||
| 87. Instruments and apparates n.e.s. | 302 | 2.0 | 396 | 2.2 | 1,162 | 6.4 | 1,416 | 10.3 | 142 | 1.1 |
| 88. Photographic equipment,optical goods etc. | ||||||||||
| 89. Miscellaneous manufactured articles,n.e.s. | 114 | 0.8 | 97 | 0.5 | 194 | 1.1 | 81 | 0.6 | 23 | 0.2 |
| In Total | 14,922 | 100.0 | 18,159 | 100.0 | 18,161 | 100.0 | 13,725 | 100.0 | 13,294 | 100.0 |
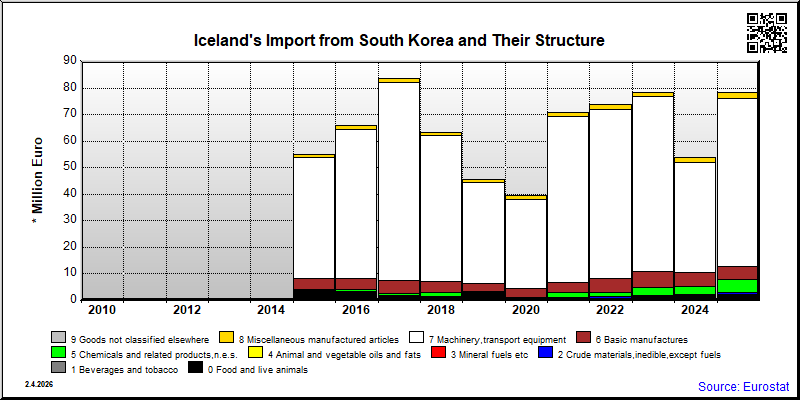
| 2021 | 2022 | 2023 | 2024 | 2025 | ||||||
|---|---|---|---|---|---|---|---|---|---|---|
| 1.000 € | % | 1.000 € | % | 1.000 € | % | 1.000 € | % | 1.000 € | % | |
| 0. Food and live animals | 805 | 1.1 | 868 | 1.2 | 1,617 | 2.1 | 1,446 | 2.7 | 1,914 | 2.4 |
| 01. Meat and meat preparations | 2 | 0.0 | ||||||||
| 02. Dairy products and birds' eggs | ||||||||||
| 03. Fish and fish preparations | 331 | 0.5 | 178 | 0.2 | 902 | 1.2 | 20 | 0.0 | 37 | 0.0 |
| 04. Cereals and cereal preparations | 35 | 0.0 | 45 | 0.1 | ||||||
| 05. Vegetables and fruit | 198 | 0.3 | 276 | 0.5 | ||||||
| 06. Sugars,sugar preparations and honey | 1 | 0.0 | ||||||||
| 07. Coffee,tea,cocoa,spices | 14 | 0.0 | 33 | 0.0 | 11 | 0.0 | 18 | 0.0 | 5 | 0.0 |
| 08. Feeding stuff for animals | 1 | 0.0 | 1 | 0.0 | ||||||
| 09. Miscellaneous edible products and preparations | 223 | 0.3 | 295 | 0.4 | 380 | 0.5 | 490 | 0.9 | 553 | 0.7 |
| 1. Beverages and tobacco | 30 | 0.0 | 109 | 0.1 | 150 | 0.3 | 170 | 0.2 | ||
| 11. Beverages | 30 | 0.0 | 109 | 0.1 | 150 | 0.3 | 170 | 0.2 | ||
| 2. Crude materials,inedible,except fuels | 440 | 0.6 | 543 | 0.7 | 205 | 0.3 | 819 | 1.0 | ||
| 23. Crude rubber (incl.synthetic) | ||||||||||
| 25. Pulp and waste paper | ||||||||||
| 26. Textile fibres and their wastes | ||||||||||
| 28. Metalliferous ores and metal scrap | ||||||||||
| 29. Crude animal,vegetable materials n.e.s. | 436 | 0.6 | 541 | 0.7 | 818 | 1.0 | ||||
| 3. Mineral fuels etc | ||||||||||
| 33. Petroleum and products | ||||||||||
| 34. Gas,natural and manufactured | ||||||||||
| 4. Animal and vegetable oils and fats | 2 | 0.0 | 2 | 0.0 | 1 | 0.0 | 7 | 0.0 | 16 | 0.0 |
| 42. Fixed vegetable fats and oils | ||||||||||
| 5. Chemicals and related products,n.e.s. | 1,708 | 2.4 | 1,556 | 2.1 | 2,953 | 3.8 | 3,053 | 5.7 | 4,866 | 6.2 |
| 51. Organic chemicals | 1 | 0.0 | ||||||||
| 52. Inorganic chemicals | ||||||||||
| 53. Dyeing,tanning and colouring material | 1,314 | 1.7 | ||||||||
| 54. Medicinal and pharmaceutical products | 681 | 1.0 | 107 | 0.1 | 24 | 0.0 | 23 | 0.0 | 35 | 0.0 |
| 55. Perfume,cleaning etc.preparations | 721 | 1.0 | 1,011 | 1.4 | 2,942 | 3.8 | ||||
| 57. Plastics in primary forms | 125 | 0.2 | 14 | 0.0 | 1 | 0.0 | ||||
| 58. Plastics in non-primary forms | 127 | 0.2 | ||||||||
| 59. Chemical materials and products,n.e.s. | 46 | 0.1 | 185 | 0.3 | 170 | 0.2 | 561 | 1.0 | 162 | 0.2 |
| 6. Basic manufactures | 3,844 | 5.4 | 5,350 | 7.2 | 5,935 | 7.6 | 5,358 | 9.9 | 4,883 | 6.2 |
| 61. Leather,dressed fur,etc. | ||||||||||
| 62. Rubber manufactures,n.e.s. | 2,362 | 3.3 | 4,000 | 5.1 | 3,277 | 4.2 | ||||
| 63. Wood and cork manufactures | 3 | 0.0 | ||||||||
| 64. Paper,paperboard and articles thereof | 21 | 0.0 | 16 | 0.0 | ||||||
| 65. Textile yarn,fabrics,made up articles,etc. | 951 | 1.3 | 1,127 | 1.5 | 1,135 | 1.4 | 1,197 | 2.2 | 663 | 0.8 |
| 66. Non-metallic mineral manufactures,n.e.s. | 240 | 0.3 | 240 | 0.4 | ||||||
| 67. Iron and steel | 23 | 0.0 | ||||||||
| 68. Non-ferrous metals | 11 | 0.0 | ||||||||
| 69. Manufactures of metals,n.e.s. | 313 | 0.4 | 301 | 0.4 | 483 | 0.6 | 354 | 0.7 | 534 | 0.7 |
| 7. Machinery,transport equipment | 62,371 | 88.1 | 63,530 | 86.1 | 65,761 | 83.9 | 41,586 | 77.0 | 63,381 | 81.1 |
| 71. Power generating machinery and equipment | 214 | 0.3 | 387 | 0.5 | 328 | 0.4 | 340 | 0.6 | 299 | 0.4 |
| 72. Machinery for specialized industries | 1,258 | 1.8 | 3,020 | 4.1 | 3,441 | 4.4 | 1,569 | 2.9 | ||
| 73. Metal working machinery | 19 | 0.0 | 1 | 0.0 | ||||||
| 74. General industrial machinery n.e.s. | 742 | 1.0 | 963 | 1.3 | 1,022 | 1.3 | 1,431 | 2.7 | 1,057 | 1.4 |
| 75. Office machines and adp machines | 774 | 1.1 | 2,773 | 3.8 | 1,462 | 1.9 | 710 | 1.3 | 570 | 0.7 |
| 76. Telecommunications and sound recording equipment | 707 | 1.0 | 1,875 | 2.5 | 1,378 | 1.8 | 1,706 | 3.2 | 1,088 | 1.4 |
| 77. Electric machinery,n.e.s.and parts | 12,725 | 18.0 | 4,886 | 6.6 | 4,109 | 5.2 | 7,372 | 13.7 | 4,389 | 5.6 |
| 78. Road vehicles | 45,939 | 64.9 | 49,599 | 67.2 | 54,021 | 68.9 | 28,448 | 52.7 | ||
| 79. Other transport equipment | 5 | 0.0 | 41 | 0.1 | ||||||
| 8. Miscellaneous manufactured articles | 1,605 | 2.3 | 1,833 | 2.5 | 1,709 | 2.2 | 1,850 | 3.4 | 1,955 | 2.5 |
| 81. Prefabr.buildings;sanitary,lighting etc.fixtrs | 15 | 0.0 | 26 | 0.0 | ||||||
| 82. Furniture and parts thereof | ||||||||||
| 83. Travel goods,handbags and sim.containers | 30 | 0.0 | 58 | 0.1 | ||||||
| 84. Articles of apparel and clothing accessories | 273 | 0.4 | 264 | 0.4 | 273 | 0.3 | 218 | 0.4 | 205 | 0.3 |
| 85. Footwear | 11 | 0.0 | 30 | 0.0 | ||||||
| 87. Instruments and apparates n.e.s. | 286 | 0.4 | 418 | 0.6 | 390 | 0.5 | 384 | 0.7 | 435 | 0.6 |
| 88. Photographic equipment,optical goods etc. | ||||||||||
| 89. Miscellaneous manufactured articles,n.e.s. | 786 | 1.1 | 880 | 1.2 | 819 | 1.0 | 1,018 | 1.9 | 1,158 | 1.5 |
| In Total | 70,823 | 100.0 | 73,815 | 100.0 | 78,411 | 100.0 | 53,977 | 100.0 | 78,147 | 100.0 |