
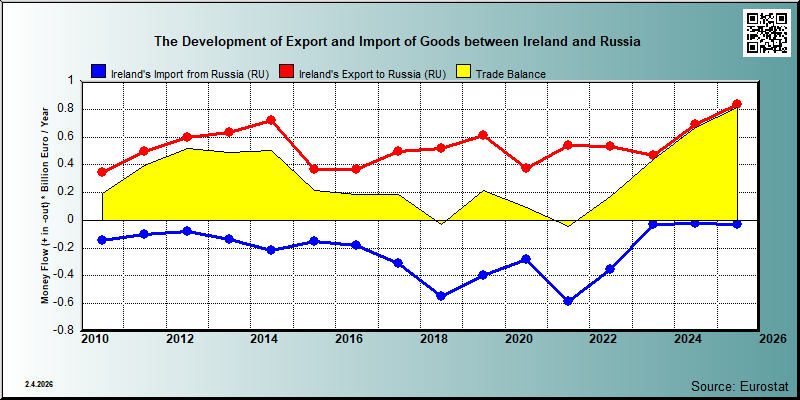
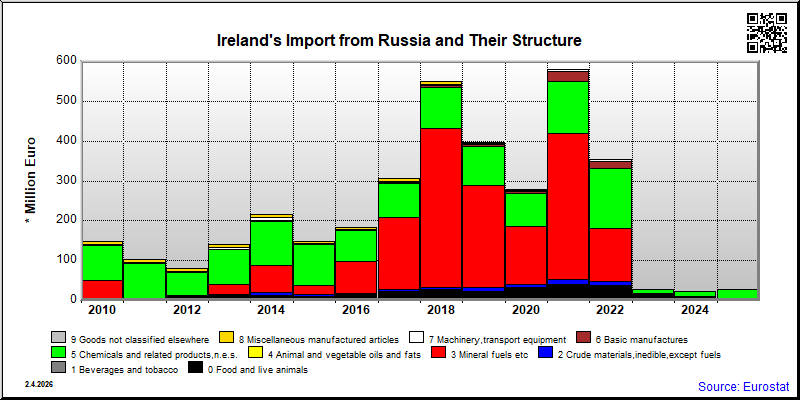
| European countries' export and import of goods | SITC |
Data:Eurostat

| 2021 | 2022 | 2023 | 2024 | 2025 | ||||||
|---|---|---|---|---|---|---|---|---|---|---|
| 1.000 € | % | 1.000 € | % | 1.000 € | % | 1.000 € | % | 1.000 € | % | |
| 0. Food and live animals | 47,226 | 8.8 | 13,296 | 2.5 | 24,500 | 5.2 | 24,838 | 3.6 | 24,477 | 2.9 |
| 00. Live animals | 1,862 | 0.3 | 898 | 0.2 | 5,353 | 1.1 | 1,324 | 0.2 | ||
| 03. Fish and fish preparations | ||||||||||
| 04. Cereals and cereal preparations | ||||||||||
| 05. Vegetables and fruit | 4,864 | 0.9 | 952 | 0.2 | ||||||
| 06. Sugars,sugar preparations and honey | 3,631 | 0.7 | 1,492 | 0.3 | 39 | 0.0 | 28 | 0.0 | 37 | 0.0 |
| 07. Coffee,tea,cocoa,spices | 3,192 | 0.6 | 674 | 0.1 | ||||||
| 08. Feeding stuff for animals | 141 | 0.0 | 56 | 0.0 | 166 | 0.0 | ||||
| 09. Miscellaneous edible products and preparations | 33,535 | 6.2 | 9,225 | 1.7 | 19,107 | 4.1 | 23,486 | 3.4 | 24,273 | 2.9 |
| 1. Beverages and tobacco | 7,378 | 1.4 | 1,083 | 0.2 | ||||||
| 11. Beverages | 7,378 | 1.4 | 1,083 | 0.2 | ||||||
| 2. Crude materials,inedible,except fuels | 157,706 | 29.2 | 231,739 | 43.8 | 194,238 | 41.5 | 347,823 | 50.4 | 317,017 | 37.9 |
| 22. Oil seeds,oleaginous fruits | ||||||||||
| 23. Crude rubber (incl.synthetic) | ||||||||||
| 24. Cork and wood | ||||||||||
| 25. Pulp and waste paper | ||||||||||
| 26. Textile fibres and their wastes | 301 | 0.1 | 138 | 0.0 | 5 | 0.0 | ||||
| 27. Crude fertilizers and crude minerals | 232 | 0.0 | 22 | 0.0 | ||||||
| 28. Metalliferous ores and metal scrap | 155,761 | 28.9 | 193,920 | 41.4 | ||||||
| 29. Crude animal,vegetable materials n.e.s. | 1,412 | 0.3 | 402 | 0.1 | 314 | 0.1 | 795 | 0.1 | 985 | 0.1 |
| 3. Mineral fuels etc | ||||||||||
| 32. Coal,coke and briquettes | ||||||||||
| 33. Petroleum and products | ||||||||||
| 4. Animal and vegetable oils and fats | ||||||||||
| 42. Fixed vegetable fats and oils | ||||||||||
| 5. Chemicals and related products,n.e.s. | 159,047 | 29.5 | 194,745 | 36.8 | 197,713 | 42.2 | 251,632 | 36.5 | 426,176 | 51.0 |
| 51. Organic chemicals | 6,146 | 1.1 | 3,286 | 0.6 | 1,775 | 0.4 | 1,752 | 0.3 | 2,145 | 0.3 |
| 52. Inorganic chemicals | 28 | 0.0 | 473 | 0.1 | 444 | 0.1 | 1,562 | 0.2 | 20 | 0.0 |
| 53. Dyeing,tanning and colouring material | 4,825 | 0.9 | 1,759 | 0.3 | 61 | 0.0 | 100 | 0.0 | 154 | 0.0 |
| 54. Medicinal and pharmaceutical products | 73,975 | 13.7 | 112,533 | 21.3 | 146,880 | 31.4 | 146,775 | 21.3 | 300,352 | 35.9 |
| 55. Perfume,cleaning etc.preparations | 42,709 | 7.9 | 71,665 | 13.5 | 48,501 | 10.4 | 101,260 | 14.7 | 123,250 | 14.7 |
| 56. Fertilizers,manufactured | 6 | 0.0 | 64 | 0.0 | 36 | 0.0 | 182 | 0.0 | 243 | 0.0 |
| 57. Plastics in primary forms | 613 | 0.1 | 296 | 0.1 | ||||||
| 58. Plastics in non-primary forms | 859 | 0.2 | 117 | 0.0 | ||||||
| 59. Chemical materials and products,n.e.s. | 29,887 | 5.5 | 4,551 | 0.9 | 14 | 0.0 | 11 | 0.0 | ||
| 6. Basic manufactures | 6,069 | 1.1 | 814 | 0.2 | 79 | 0.0 | 172 | 0.0 | 1 | 0.0 |
| 61. Leather,dressed fur,etc. | 1 | 0.0 | 2 | 0.0 | ||||||
| 62. Rubber manufactures,n.e.s. | 529 | 0.1 | 64 | 0.0 | ||||||
| 63. Wood and cork manufactures | 106 | 0.0 | 20 | 0.0 | 3 | 0.0 | ||||
| 64. Paper,paperboard and articles thereof | 73 | 0.0 | 13 | 0.0 | ||||||
| 65. Textile yarn,fabrics,made up articles,etc. | 1,315 | 0.2 | 12 | 0.0 | ||||||
| 66. Non-metallic mineral manufactures,n.e.s. | 135 | 0.0 | 3 | 0.0 | 79 | 0.0 | 170 | 0.0 | 1 | 0.0 |
| 67. Iron and steel | 24 | 0.0 | 3 | 0.0 | ||||||
| 68. Non-ferrous metals | 171 | 0.0 | 81 | 0.0 | ||||||
| 69. Manufactures of metals,n.e.s. | 3,714 | 0.7 | 618 | 0.1 | ||||||
| 7. Machinery,transport equipment | 57,415 | 10.6 | 16,568 | 3.1 | 2,502 | 0.5 | 3,792 | 0.5 | 3,997 | 0.5 |
| 71. Power generating machinery and equipment | 124 | 0.0 | 98 | 0.0 | ||||||
| 72. Machinery for specialized industries | 4,074 | 0.8 | 3,066 | 0.6 | 1,299 | 0.3 | 638 | 0.1 | 770 | 0.1 |
| 73. Metal working machinery | 55 | 0.0 | 97 | 0.0 | ||||||
| 74. General industrial machinery n.e.s. | 18,061 | 3.3 | 4,459 | 0.8 | 1,199 | 0.3 | 3,154 | 0.5 | 3,226 | 0.4 |
| 75. Office machines and adp machines | 20,360 | 3.8 | 7,988 | 1.5 | ||||||
| 76. Telecommunications and sound recording equipment | 8,062 | 1.5 | 159 | 0.0 | ||||||
| 77. Electric machinery,n.e.s.and parts | 2,724 | 0.5 | 399 | 0.1 | 3 | 0.0 | ||||
| 78. Road vehicles | 334 | 0.1 | 83 | 0.0 | ||||||
| 79. Other transport equipment | 3,622 | 0.7 | 219 | 0.0 | ||||||
| 8. Miscellaneous manufactured articles | 104,715 | 19.4 | 70,765 | 13.4 | 49,125 | 10.5 | 61,241 | 8.9 | 64,629 | 7.7 |
| 81. Prefabr.buildings;sanitary,lighting etc.fixtrs | 45 | 0.0 | 3 | 0.0 | ||||||
| 82. Furniture and parts thereof | 27 | 0.0 | 1 | 0.0 | ||||||
| 83. Travel goods,handbags and sim.containers | 88 | 0.0 | 135 | 0.0 | ||||||
| 84. Articles of apparel and clothing accessories | 11 | 0.0 | 4 | 0.0 | 1 | 0.0 | 2 | 0.0 | ||
| 85. Footwear | ||||||||||
| 87. Instruments and apparates n.e.s. | 17,589 | 3.3 | 16,425 | 3.1 | 548 | 0.1 | 10 | 0.0 | 108 | 0.0 |
| 88. Photographic equipment,optical goods etc. | 48,995 | 9.1 | 46,119 | 8.7 | 48,432 | 10.3 | 61,230 | 8.9 | 64,475 | 7.7 |
| 89. Miscellaneous manufactured articles,n.e.s. | 37,959 | 7.0 | 8,080 | 1.5 | 144 | 0.0 | 42 | 0.0 | ||
| 9. Goods not classified elsewhere | 3 | 0.0 | ||||||||
| 93. Special transactions and commodities not classified | 3 | 0.0 | ||||||||
| 97. Gold,non-monetary | ||||||||||
| In Total | 539,559 | 100.0 | 529,010 | 100.0 | 468,156 | 100.0 | 689,498 | 100.0 | 836,298 | 100.0 |
| 2021 | 2022 | 2023 | 2024 | 2025 | ||||||
|---|---|---|---|---|---|---|---|---|---|---|
| 1.000 € | % | 1.000 € | % | 1.000 € | % | 1.000 € | % | 1.000 € | % | |
| 0. Food and live animals | 39,576 | 6.8 | 37,710 | 10.6 | 18,337 | 64.0 | 10,461 | 44.9 | 23 | 0.1 |
| 00. Live animals | 39 | 0.0 | 5 | 0.0 | 1 | 0.0 | ||||
| 03. Fish and fish preparations | 3,970 | 0.7 | ||||||||
| 04. Cereals and cereal preparations | 290 | 0.0 | 1 | 0.0 | 1 | 0.0 | ||||
| 05. Vegetables and fruit | 10 | 0.0 | 111 | 0.0 | 1 | 0.0 | ||||
| 06. Sugars,sugar preparations and honey | 4 | 0.0 | 4 | 0.0 | 4 | 0.0 | 3 | 0.0 | 3 | 0.0 |
| 07. Coffee,tea,cocoa,spices | 120 | 0.0 | 43 | 0.0 | 7 | 0.0 | ||||
| 08. Feeding stuff for animals | 34,915 | 6.0 | 33,078 | 9.3 | ||||||
| 09. Miscellaneous edible products and preparations | 228 | 0.0 | 67 | 0.0 | 32 | 0.1 | 8 | 0.0 | 9 | 0.0 |
| 1. Beverages and tobacco | 318 | 0.1 | 82 | 0.0 | ||||||
| 11. Beverages | 318 | 0.1 | 82 | 0.0 | ||||||
| 2. Crude materials,inedible,except fuels | 13,307 | 2.3 | 10,297 | 2.9 | 7 | 0.0 | 2 | 0.0 | 1 | 0.0 |
| 22. Oil seeds,oleaginous fruits | 3 | 0.0 | ||||||||
| 23. Crude rubber (incl.synthetic) | ||||||||||
| 24. Cork and wood | ||||||||||
| 25. Pulp and waste paper | ||||||||||
| 26. Textile fibres and their wastes | 2 | 0.0 | 1 | 0.0 | ||||||
| 27. Crude fertilizers and crude minerals | 90 | 0.0 | 17 | 0.0 | ||||||
| 28. Metalliferous ores and metal scrap | 1 | 0.0 | ||||||||
| 29. Crude animal,vegetable materials n.e.s. | 1 | 0.0 | 1 | 0.0 | 1 | 0.0 | 1 | 0.0 | ||
| 3. Mineral fuels etc | ||||||||||
| 32. Coal,coke and briquettes | ||||||||||
| 33. Petroleum and products | ||||||||||
| 4. Animal and vegetable oils and fats | ||||||||||
| 42. Fixed vegetable fats and oils | ||||||||||
| 5. Chemicals and related products,n.e.s. | 131,671 | 22.7 | 148,622 | 41.9 | 9,296 | 32.5 | 11,446 | 49.2 | 26,705 | 99.1 |
| 51. Organic chemicals | 193 | 0.0 | 24 | 0.0 | 6 | 0.0 | 7 | 0.0 | ||
| 52. Inorganic chemicals | 519 | 0.1 | 109 | 0.0 | 5 | 0.0 | ||||
| 53. Dyeing,tanning and colouring material | 7 | 0.0 | 4 | 0.0 | 1 | 0.0 | 7 | 0.0 | 1 | 0.0 |
| 54. Medicinal and pharmaceutical products | 26 | 0.0 | 100 | 0.0 | 48 | 0.2 | 35 | 0.2 | 65 | 0.2 |
| 55. Perfume,cleaning etc.preparations | 418 | 0.1 | 298 | 0.1 | 167 | 0.6 | 10 | 0.0 | 3 | 0.0 |
| 56. Fertilizers,manufactured | 129,865 | 22.4 | 147,824 | 41.7 | 9,035 | 31.6 | 11,383 | 48.9 | 26,632 | 98.8 |
| 57. Plastics in primary forms | 5 | 0.0 | 5 | 0.0 | 1 | 0.0 | ||||
| 58. Plastics in non-primary forms | 328 | 0.1 | 136 | 0.0 | ||||||
| 59. Chemical materials and products,n.e.s. | 309 | 0.1 | 121 | 0.0 | 1 | 0.0 | ||||
| 6. Basic manufactures | 24,381 | 4.2 | 18,680 | 5.3 | 89 | 0.3 | 1,000 | 4.3 | 13 | 0.0 |
| 61. Leather,dressed fur,etc. | 3 | 0.0 | ||||||||
| 62. Rubber manufactures,n.e.s. | 339 | 0.1 | 122 | 0.0 | ||||||
| 63. Wood and cork manufactures | 3,984 | 0.7 | 2,379 | 0.7 | 16 | 0.1 | ||||
| 64. Paper,paperboard and articles thereof | 1,009 | 0.2 | 320 | 0.1 | 22 | 0.1 | 37 | 0.2 | 1 | 0.0 |
| 65. Textile yarn,fabrics,made up articles,etc. | 33 | 0.0 | 12 | 0.0 | 5 | 0.0 | ||||
| 66. Non-metallic mineral manufactures,n.e.s. | 3,501 | 0.6 | 600 | 0.2 | 7 | 0.0 | 6 | 0.0 | 1 | 0.0 |
| 67. Iron and steel | 8,503 | 1.5 | 7,023 | 2.0 | ||||||
| 68. Non-ferrous metals | 6,685 | 1.2 | 8,134 | 2.3 | ||||||
| 69. Manufactures of metals,n.e.s. | 323 | 0.1 | 91 | 0.0 | 2 | 0.0 | ||||
| 7. Machinery,transport equipment | 4,707 | 0.8 | 3,649 | 1.0 | 707 | 2.5 | 254 | 1.1 | 91 | 0.3 |
| 71. Power generating machinery and equipment | 2 | 0.0 | 1 | 0.0 | ||||||
| 72. Machinery for specialized industries | 32 | 0.0 | 73 | 0.0 | 15 | 0.1 | 3 | 0.0 | 40 | 0.2 |
| 73. Metal working machinery | 72 | 0.0 | 39 | 0.0 | ||||||
| 74. General industrial machinery n.e.s. | 242 | 0.0 | 10 | 0.0 | 3 | 0.0 | 2 | 0.0 | 21 | 0.1 |
| 75. Office machines and adp machines | 172 | 0.0 | 10 | 0.0 | ||||||
| 76. Telecommunications and sound recording equipment | 69 | 0.0 | 114 | 0.0 | 2 | 0.0 | ||||
| 77. Electric machinery,n.e.s.and parts | 3,983 | 0.7 | 3,112 | 0.9 | 133 | 0.5 | ||||
| 78. Road vehicles | 125 | 0.0 | 248 | 0.1 | 180 | 0.8 | ||||
| 79. Other transport equipment | 10 | 0.0 | 42 | 0.0 | ||||||
| 8. Miscellaneous manufactured articles | 1,103 | 0.2 | 1,597 | 0.5 | 192 | 0.7 | 111 | 0.5 | 114 | 0.4 |
| 81. Prefabr.buildings;sanitary,lighting etc.fixtrs | 71 | 0.0 | 186 | 0.1 | ||||||
| 82. Furniture and parts thereof | 238 | 0.0 | 72 | 0.0 | ||||||
| 83. Travel goods,handbags and sim.containers | 14 | 0.0 | 502 | 0.1 | 2 | 0.0 | ||||
| 84. Articles of apparel and clothing accessories | 81 | 0.0 | 400 | 0.1 | 30 | 0.1 | 25 | 0.1 | 16 | 0.1 |
| 85. Footwear | 10 | 0.0 | 9 | 0.0 | 3 | 0.0 | ||||
| 87. Instruments and apparates n.e.s. | 368 | 0.1 | 154 | 0.0 | 91 | 0.3 | 28 | 0.1 | 17 | 0.1 |
| 88. Photographic equipment,optical goods etc. | 8 | 0.0 | 6 | 0.0 | 8 | 0.0 | 3 | 0.0 | 6 | 0.0 |
| 89. Miscellaneous manufactured articles,n.e.s. | 312 | 0.1 | 268 | 0.1 | 54 | 0.2 | 49 | 0.2 | 69 | 0.3 |
| 9. Goods not classified elsewhere | 12 | 0.0 | ||||||||
| 93. Special transactions and commodities not classified | 12 | 0.0 | ||||||||
| 97. Gold,non-monetary | ||||||||||
| In Total | 580,422 | 100.0 | 354,486 | 100.0 | 28,634 | 100.0 | 23,280 | 100.0 | 26,950 | 100.0 |