
| European countries' export and import of goods | SITC |
Data:Eurostat

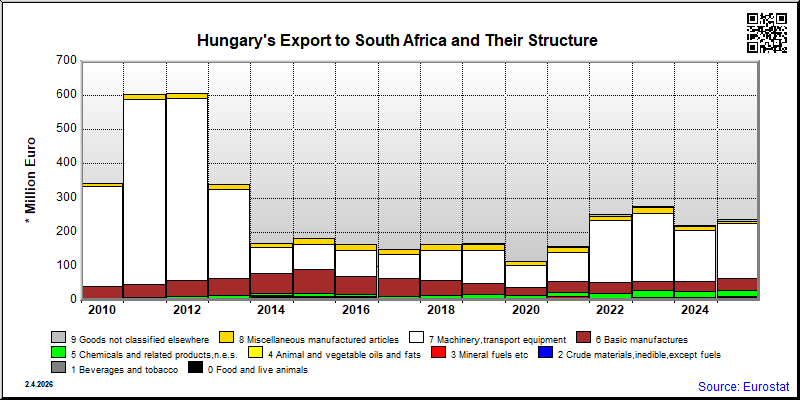
| 2021 | 2022 | 2023 | 2024 | 2025 | ||||||
|---|---|---|---|---|---|---|---|---|---|---|
| 1.000 € | % | 1.000 € | % | 1.000 € | % | 1.000 € | % | 1.000 € | % | |
| 0. Food and live animals | 4,450 | 2.8 | 4,028 | 1.6 | 2,533 | 0.9 | 3,670 | 1.7 | 3,432 | 1.4 |
| 00. Live animals | 37 | 0.0 | 26 | 0.0 | 27 | 0.0 | 17 | 0.0 | 4 | 0.0 |
| 03. Fish and fish preparations | 3 | 0.0 | 7 | 0.0 | ||||||
| 04. Cereals and cereal preparations | 61 | 0.0 | 19 | 0.0 | ||||||
| 05. Vegetables and fruit | 1,027 | 0.6 | 1,026 | 0.4 | 962 | 0.4 | 1,321 | 0.6 | 1,387 | 0.6 |
| 06. Sugars,sugar preparations and honey | 211 | 0.1 | 267 | 0.1 | 103 | 0.0 | 184 | 0.1 | 141 | 0.1 |
| 07. Coffee,tea,cocoa,spices | 85 | 0.1 | 157 | 0.1 | 51 | 0.0 | 224 | 0.1 | 189 | 0.1 |
| 09. Miscellaneous edible products and preparations | 635 | 0.4 | 435 | 0.2 | 408 | 0.1 | 700 | 0.3 | 678 | 0.3 |
| 1. Beverages and tobacco | 3 | 0.0 | 102 | 0.0 | 164 | 0.1 | 941 | 0.4 | 2,582 | 1.1 |
| 11. Beverages | 3 | 0.0 | 1 | 0.0 | 24 | 0.0 | 21 | 0.0 | 5 | 0.0 |
| 12. Tobacco and tobacco manufactures | 921 | 0.4 | 2,577 | 1.1 | ||||||
| 2. Crude materials,inedible,except fuels | 742 | 0.5 | 1,515 | 0.6 | 1,881 | 0.7 | 2,120 | 1.0 | 1,894 | 0.8 |
| 21. Hides,skins,furskins,raw | 1 | 0.0 | ||||||||
| 22. Oil seeds,oleaginous fruits | ||||||||||
| 23. Crude rubber (incl.synthetic) | 1,514 | 0.7 | ||||||||
| 24. Cork and wood | 28 | 0.0 | 29 | 0.0 | 18 | 0.0 | 87 | 0.0 | 74 | 0.0 |
| 26. Textile fibres and their wastes | 74 | 0.0 | 30 | 0.0 | 194 | 0.1 | 34 | 0.0 | ||
| 27. Crude fertilizers and crude minerals | 1 | 0.0 | ||||||||
| 28. Metalliferous ores and metal scrap | ||||||||||
| 29. Crude animal,vegetable materials n.e.s. | 190 | 0.1 | 205 | 0.1 | 79 | 0.0 | 118 | 0.1 | 199 | 0.1 |
| 5. Chemicals and related products,n.e.s. | 13,027 | 8.1 | 14,722 | 5.9 | 20,591 | 7.5 | 15,127 | 6.9 | 16,831 | 7.1 |
| 51. Organic chemicals | 1,210 | 0.7 | 743 | 0.3 | 3,646 | 1.3 | 975 | 0.4 | 416 | 0.2 |
| 52. Inorganic chemicals | 491 | 0.3 | 478 | 0.2 | 600 | 0.2 | 396 | 0.2 | 248 | 0.1 |
| 53. Dyeing,tanning and colouring material | 36 | 0.0 | 144 | 0.1 | 49 | 0.0 | 130 | 0.1 | 136 | 0.1 |
| 54. Medicinal and pharmaceutical products | 3,412 | 2.1 | 4,176 | 1.7 | 8,866 | 3.2 | 8,384 | 3.8 | 8,791 | 3.7 |
| 55. Perfume,cleaning etc.preparations | 754 | 0.5 | 703 | 0.3 | 776 | 0.3 | 814 | 0.4 | 1,639 | 0.7 |
| 56. Fertilizers,manufactured | 7 | 0.0 | ||||||||
| 57. Plastics in primary forms | 149 | 0.1 | 2,894 | 1.2 | 1,321 | 0.5 | 1,332 | 0.6 | 2,214 | 0.9 |
| 58. Plastics in non-primary forms | 1,591 | 1.0 | 648 | 0.3 | 355 | 0.1 | 656 | 0.3 | 181 | 0.1 |
| 59. Chemical materials and products,n.e.s. | 5,384 | 3.3 | 4,930 | 2.0 | 4,978 | 1.8 | 2,439 | 1.1 | 3,206 | 1.3 |
| 6. Basic manufactures | 33,354 | 20.7 | 32,348 | 12.9 | 25,927 | 9.5 | 29,674 | 13.5 | 36,652 | 15.4 |
| 61. Leather,dressed fur,etc. | 11 | 0.0 | 108 | 0.0 | 133 | 0.0 | 28 | 0.0 | ||
| 62. Rubber manufactures,n.e.s. | 6,435 | 4.0 | 9,830 | 3.9 | 6,436 | 2.3 | 9,122 | 4.1 | 9,740 | 4.1 |
| 63. Wood and cork manufactures | 4,232 | 2.6 | 3,692 | 1.5 | 1,696 | 0.6 | 1,036 | 0.5 | 855 | 0.4 |
| 64. Paper,paperboard and articles thereof | 6,280 | 3.9 | 6,648 | 2.6 | 6,617 | 2.4 | 8,178 | 3.7 | 8,242 | 3.5 |
| 65. Textile yarn,fabrics,made up articles,etc. | 3,901 | 2.4 | 4,148 | 1.6 | 2,601 | 0.9 | 3,335 | 1.5 | 2,828 | 1.2 |
| 66. Non-metallic mineral manufactures,n.e.s. | 9,755 | 6.0 | 4,745 | 1.9 | 5,225 | 1.9 | 5,224 | 2.4 | 10,705 | 4.5 |
| 67. Iron and steel | 64 | 0.0 | 101 | 0.0 | 70 | 0.0 | 84 | 0.0 | 282 | 0.1 |
| 68. Non-ferrous metals | 29 | 0.0 | 12 | 0.0 | 2 | 0.0 | 7 | 0.0 | 45 | 0.0 |
| 69. Manufactures of metals,n.e.s. | 2,649 | 1.6 | 3,064 | 1.2 | 3,147 | 1.1 | 2,686 | 1.2 | 3,927 | 1.7 |
| 7. Machinery,transport equipment | 83,814 | 51.9 | 180,426 | 71.7 | 201,063 | 73.4 | 149,699 | 68.0 | 158,369 | 66.6 |
| 71. Power generating machinery and equipment | 2,943 | 1.8 | 3,941 | 1.6 | 3,482 | 1.3 | 1,368 | 0.6 | 1,201 | 0.5 |
| 72. Machinery for specialized industries | 1,725 | 1.1 | 4,044 | 1.6 | 3,346 | 1.2 | 930 | 0.4 | 2,094 | 0.9 |
| 73. Metal working machinery | 2 | 0.0 | 17 | 0.0 | 77 | 0.0 | ||||
| 74. General industrial machinery n.e.s. | 10,275 | 6.4 | 13,171 | 5.2 | 13,069 | 4.8 | 9,972 | 4.5 | 18,397 | 7.7 |
| 75. Office machines and adp machines | 18,221 | 11.3 | 45,999 | 18.3 | 38,137 | 13.9 | 43,605 | 19.8 | 29,047 | 12.2 |
| 76. Telecommunications and sound recording equipment | 13,237 | 8.2 | 11,202 | 4.5 | 21,486 | 7.8 | 8,339 | 3.8 | 7,002 | 2.9 |
| 77. Electric machinery,n.e.s.and parts | 14,718 | 9.1 | 13,942 | 5.5 | 26,437 | 9.6 | 9,123 | 4.1 | 11,064 | 4.7 |
| 78. Road vehicles | 22,663 | 14.0 | 88,011 | 35.0 | 95,008 | 34.7 | 76,023 | 34.5 | 89,112 | 37.5 |
| 79. Other transport equipment | 32 | 0.0 | 109 | 0.0 | 96 | 0.0 | 322 | 0.1 | 375 | 0.2 |
| 8. Miscellaneous manufactured articles | 15,150 | 9.4 | 12,500 | 5.0 | 16,146 | 5.9 | 12,017 | 5.5 | 7,718 | 3.2 |
| 81. Prefabr.buildings;sanitary,lighting etc.fixtrs | 30 | 0.0 | 614 | 0.2 | 166 | 0.1 | 81 | 0.0 | 18 | 0.0 |
| 82. Furniture and parts thereof | 4,662 | 2.9 | 3,742 | 1.5 | 5,795 | 2.1 | 2,128 | 1.0 | 559 | 0.2 |
| 83. Travel goods,handbags and sim.containers | 6 | 0.0 | 8 | 0.0 | 10 | 0.0 | 2 | 0.0 | 4 | 0.0 |
| 84. Articles of apparel and clothing accessories | 54 | 0.0 | 82 | 0.0 | 62 | 0.0 | 50 | 0.0 | 23 | 0.0 |
| 85. Footwear | 1 | 0.0 | 1 | 0.0 | 3 | 0.0 | ||||
| 87. Instruments and apparates n.e.s. | 4,332 | 2.7 | 2,990 | 1.2 | 1,730 | 0.6 | 2,004 | 0.9 | 1,567 | 0.7 |
| 88. Photographic equipment,optical goods etc. | 700 | 0.4 | 611 | 0.2 | 688 | 0.3 | 1,145 | 0.5 | 911 | 0.4 |
| 89. Miscellaneous manufactured articles,n.e.s. | 5,365 | 3.3 | 4,453 | 1.8 | 7,696 | 2.8 | 6,604 | 3.0 | 4,636 | 2.0 |
| 9. Goods not classified elsewhere | 1,937 | 1.2 | 4,713 | 1.9 | 2,697 | 1.0 | 3,877 | 1.8 | 5,777 | 2.4 |
| 93. Special transactions and commodities not classified | 1,937 | 1.2 | ||||||||
| 97. Gold,non-monetary | ||||||||||
| In Total | 161,439 | 100.0 | 251,606 | 100.0 | 274,108 | 100.0 | 220,205 | 100.0 | 237,665 | 100.0 |

| 2021 | 2022 | 2023 | 2024 | 2025 | ||||||
|---|---|---|---|---|---|---|---|---|---|---|
| 1.000 € | % | 1.000 € | % | 1.000 € | % | 1.000 € | % | 1.000 € | % | |
| 0. Food and live animals | 59 | 0.2 | 16,793 | 35.1 | 1,769 | 8.7 | 594 | 2.9 | 378 | 0.8 |
| 00. Live animals | 3 | 0.0 | 2 | 0.0 | 3 | 0.0 | 4 | 0.0 | 5 | 0.0 |
| 03. Fish and fish preparations | 166 | 0.8 | 327 | 0.7 | ||||||
| 04. Cereals and cereal preparations | 245 | 0.5 | 1,568 | 7.8 | 403 | 2.0 | ||||
| 05. Vegetables and fruit | 35 | 0.1 | 36 | 0.1 | 24 | 0.1 | 43 | 0.1 | ||
| 06. Sugars,sugar preparations and honey | 16,381 | 34.2 | 1 | 0.0 | 2 | 0.0 | 1 | 0.0 | ||
| 07. Coffee,tea,cocoa,spices | 3 | 0.0 | 6 | 0.0 | 4 | 0.0 | 1 | 0.0 | ||
| 09. Miscellaneous edible products and preparations | 17 | 0.1 | 9 | 0.0 | 1 | 0.0 | 58 | 0.3 | 1 | 0.0 |
| 1. Beverages and tobacco | 146 | 0.6 | 90 | 0.2 | 279 | 1.4 | 569 | 2.8 | 239 | 0.5 |
| 11. Beverages | 146 | 0.6 | 90 | 0.2 | 279 | 1.4 | 228 | 1.1 | 239 | 0.5 |
| 12. Tobacco and tobacco manufactures | 341 | 1.7 | ||||||||
| 2. Crude materials,inedible,except fuels | 1,346 | 5.4 | 1,654 | 3.5 | 1,159 | 5.7 | 1,058 | 5.1 | 2,011 | 4.3 |
| 21. Hides,skins,furskins,raw | 38 | 0.2 | 146 | 0.7 | ||||||
| 22. Oil seeds,oleaginous fruits | ||||||||||
| 23. Crude rubber (incl.synthetic) | 172 | 0.8 | ||||||||
| 24. Cork and wood | 77 | 0.3 | 215 | 0.4 | 204 | 1.0 | 62 | 0.3 | 114 | 0.2 |
| 26. Textile fibres and their wastes | 3 | 0.0 | 35 | 0.2 | ||||||
| 27. Crude fertilizers and crude minerals | 593 | 2.4 | 304 | 1.5 | 262 | 1.3 | 344 | 0.7 | ||
| 28. Metalliferous ores and metal scrap | ||||||||||
| 29. Crude animal,vegetable materials n.e.s. | 459 | 1.8 | 645 | 1.3 | 512 | 2.5 | 415 | 2.0 | 1,417 | 3.0 |
| 5. Chemicals and related products,n.e.s. | 961 | 3.8 | 5,899 | 12.3 | 492 | 2.4 | 605 | 2.9 | 541 | 1.2 |
| 51. Organic chemicals | 205 | 0.8 | 38 | 0.1 | 27 | 0.1 | 33 | 0.2 | 27 | 0.1 |
| 52. Inorganic chemicals | 78 | 0.3 | 5,505 | 11.5 | 191 | 0.9 | 37 | 0.2 | 71 | 0.2 |
| 53. Dyeing,tanning and colouring material | 4 | 0.0 | 6 | 0.0 | 24 | 0.1 | 85 | 0.2 | ||
| 54. Medicinal and pharmaceutical products | 237 | 0.9 | 12 | 0.0 | 34 | 0.2 | 26 | 0.1 | ||
| 55. Perfume,cleaning etc.preparations | 337 | 1.3 | 234 | 0.5 | 187 | 0.9 | 319 | 1.6 | 270 | 0.6 |
| 56. Fertilizers,manufactured | 7 | 0.0 | ||||||||
| 57. Plastics in primary forms | 58 | 0.2 | 43 | 0.1 | 27 | 0.1 | 12 | 0.0 | ||
| 58. Plastics in non-primary forms | 25 | 0.1 | 50 | 0.1 | 43 | 0.2 | 106 | 0.5 | 26 | 0.1 |
| 59. Chemical materials and products,n.e.s. | 17 | 0.1 | 8 | 0.0 | 38 | 0.2 | 20 | 0.1 | 25 | 0.1 |
| 6. Basic manufactures | 13,488 | 53.9 | 16,272 | 34.0 | 12,477 | 61.7 | 14,044 | 68.4 | 16,741 | 35.8 |
| 61. Leather,dressed fur,etc. | 10,016 | 40.0 | 13,957 | 29.2 | 11,630 | 57.5 | 13,577 | 66.1 | 15,160 | 32.4 |
| 62. Rubber manufactures,n.e.s. | 61 | 0.2 | 24 | 0.1 | 9 | 0.0 | 3 | 0.0 | 8 | 0.0 |
| 63. Wood and cork manufactures | 35 | 0.1 | 34 | 0.1 | 2 | 0.0 | 1 | 0.0 | 1 | 0.0 |
| 64. Paper,paperboard and articles thereof | 1 | 0.0 | 1 | 0.0 | 1 | 0.0 | ||||
| 65. Textile yarn,fabrics,made up articles,etc. | 25 | 0.1 | 42 | 0.1 | 51 | 0.3 | 65 | 0.3 | 92 | 0.2 |
| 66. Non-metallic mineral manufactures,n.e.s. | 102 | 0.4 | 151 | 0.3 | 106 | 0.5 | 119 | 0.6 | 101 | 0.2 |
| 67. Iron and steel | 292 | 1.2 | 454 | 0.9 | 145 | 0.7 | 218 | 1.1 | 29 | 0.1 |
| 68. Non-ferrous metals | 2,419 | 9.7 | 1,387 | 2.9 | 483 | 2.4 | 1,216 | 2.6 | ||
| 69. Manufactures of metals,n.e.s. | 537 | 2.1 | 221 | 0.5 | 51 | 0.3 | 60 | 0.3 | 135 | 0.3 |
| 7. Machinery,transport equipment | 6,097 | 24.3 | 4,089 | 8.5 | 2,317 | 11.5 | 1,658 | 8.1 | 24,711 | 52.9 |
| 71. Power generating machinery and equipment | 436 | 1.7 | 44 | 0.1 | 92 | 0.5 | 40 | 0.2 | 87 | 0.2 |
| 72. Machinery for specialized industries | 292 | 1.2 | 151 | 0.3 | 1 | 0.0 | 26 | 0.1 | 6,026 | 12.9 |
| 73. Metal working machinery | 120 | 0.6 | 512 | 1.1 | ||||||
| 74. General industrial machinery n.e.s. | 4,357 | 17.4 | 1,548 | 3.2 | 363 | 1.8 | 242 | 1.2 | 15,743 | 33.7 |
| 75. Office machines and adp machines | 113 | 0.5 | 198 | 0.4 | 267 | 1.3 | 132 | 0.6 | 98 | 0.2 |
| 76. Telecommunications and sound recording equipment | 570 | 2.3 | 871 | 1.8 | 660 | 3.3 | 849 | 4.1 | 593 | 1.3 |
| 77. Electric machinery,n.e.s.and parts | 194 | 0.8 | 260 | 0.5 | 535 | 2.6 | 177 | 0.9 | 442 | 0.9 |
| 78. Road vehicles | 131 | 0.5 | 886 | 1.9 | 193 | 1.0 | 192 | 0.9 | 1,206 | 2.6 |
| 79. Other transport equipment | 4 | 0.0 | 131 | 0.3 | 86 | 0.4 | 4 | 0.0 | ||
| 8. Miscellaneous manufactured articles | 1,529 | 6.1 | 1,216 | 2.5 | 1,716 | 8.5 | 1,992 | 9.7 | 2,119 | 4.5 |
| 81. Prefabr.buildings;sanitary,lighting etc.fixtrs | 194 | 0.8 | 119 | 0.2 | 171 | 0.8 | 153 | 0.7 | 53 | 0.1 |
| 82. Furniture and parts thereof | 2 | 0.0 | 2 | 0.0 | 37 | 0.2 | 6 | 0.0 | ||
| 83. Travel goods,handbags and sim.containers | 2 | 0.0 | 1 | 0.0 | 2 | 0.0 | 1 | 0.0 | 4 | 0.0 |
| 84. Articles of apparel and clothing accessories | 4 | 0.0 | 14 | 0.0 | 18 | 0.1 | 6 | 0.0 | 8 | 0.0 |
| 85. Footwear | 1 | 0.0 | 1 | 0.0 | 2 | 0.0 | 1 | 0.0 | 23 | 0.1 |
| 87. Instruments and apparates n.e.s. | 120 | 0.5 | 68 | 0.1 | 86 | 0.4 | 205 | 1.0 | 207 | 0.4 |
| 88. Photographic equipment,optical goods etc. | 2 | 0.0 | 2 | 0.0 | 16 | 0.1 | 3 | 0.0 | 1 | 0.0 |
| 89. Miscellaneous manufactured articles,n.e.s. | 1,204 | 4.8 | 1,009 | 2.1 | 1,420 | 7.0 | 1,586 | 7.7 | 1,817 | 3.9 |
| 9. Goods not classified elsewhere | 158 | 0.6 | 1,830 | 3.8 | 4 | 0.0 | 4 | 0.0 | 10 | 0.0 |
| 93. Special transactions and commodities not classified | 99 | 0.4 | ||||||||
| 97. Gold,non-monetary | ||||||||||
| In Total | 25,046 | 100.0 | 47,843 | 100.0 | 20,234 | 100.0 | 20,540 | 100.0 | 46,749 | 100.0 |