
| European countries' export and import of goods | SITC |
Data:Eurostat
| 2021 | 2022 | 2023 | 2024 | 2025 | ||||||
|---|---|---|---|---|---|---|---|---|---|---|
| 1.000 € | % | 1.000 € | % | 1.000 € | % | 1.000 € | % | 1.000 € | % | |
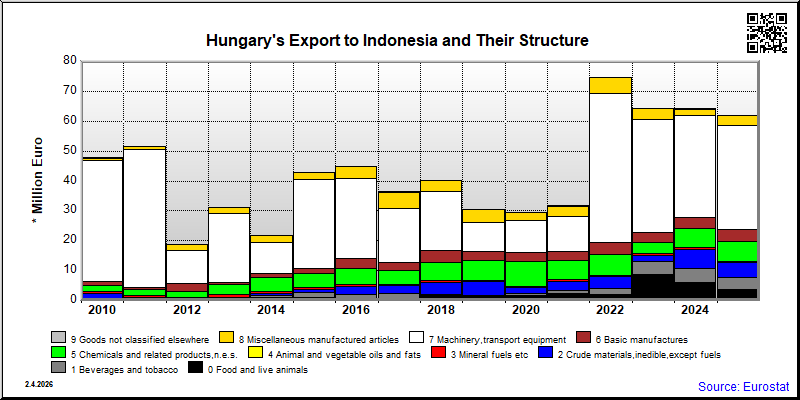
| 0. Food and live animals | 2,482 | 7.8 | 2,032 | 2.6 | 8,672 | 13.5 | 5,862 | 9.1 | 3,825 | 6.2 |
| 01. Meat and meat preparations | 34 | 0.0 | 258 | 0.4 | 18 | 0.0 | 59 | 0.1 | ||
| 03. Fish and fish preparations | 64 | 0.1 | ||||||||
| 04. Cereals and cereal preparations | 2 | 0.0 | 4 | 0.0 | 6,524 | 10.1 | 2,949 | 4.6 | ||
| 05. Vegetables and fruit | 1 | 0.0 | ||||||||
| 06. Sugars,sugar preparations and honey | 440 | 1.4 | 445 | 0.6 | 524 | 0.8 | 288 | 0.4 | 267 | 0.4 |
| 07. Coffee,tea,cocoa,spices | 144 | 0.5 | 226 | 0.3 | 232 | 0.4 | 314 | 0.5 | 273 | 0.4 |
| 09. Miscellaneous edible products and preparations | 657 | 2.1 | 789 | 1.0 | 854 | 1.3 | 2,217 | 3.5 | 3,223 | 5.2 |
| 1. Beverages and tobacco | 928 | 2.9 | 1,957 | 2.5 | 4,375 | 6.8 | 4,779 | 7.4 | 4,013 | 6.5 |
| 12. Tobacco and tobacco manufactures | 928 | 2.9 | 1,955 | 2.5 | 4,374 | 6.8 | 4,776 | 7.4 | 4,008 | 6.5 |
| 2. Crude materials,inedible,except fuels | 3,053 | 9.6 | 4,038 | 5.1 | 2,154 | 3.3 | 6,508 | 10.1 | 4,740 | 7.7 |
| 23. Crude rubber (incl.synthetic) | ||||||||||
| 24. Cork and wood | 2,573 | 8.1 | 3,339 | 4.2 | 1,281 | 2.0 | 5,217 | 8.1 | 4,546 | 7.3 |
| 26. Textile fibres and their wastes | 78 | 0.2 | 338 | 0.5 | 42 | 0.1 | 15 | 0.0 | ||
| 27. Crude fertilizers and crude minerals | ||||||||||
| 28. Metalliferous ores and metal scrap | ||||||||||
| 29. Crude animal,vegetable materials n.e.s. | 208 | 0.7 | 15 | 0.0 | 659 | 1.0 | 1 | 0.0 | ||
| 4. Animal and vegetable oils and fats | 13 | 0.0 | 22 | 0.0 | 14 | 0.0 | 4 | 0.0 | 2 | 0.0 |
| 42. Fixed vegetable fats and oils | 3 | 0.0 | 4 | 0.0 | 1 | 0.0 | 1 | 0.0 | 2 | 0.0 |
| 43. Processed animal or vegetable oils,etc. | 10 | 0.0 | 18 | 0.0 | 12 | 0.0 | 3 | 0.0 | ||
| 5. Chemicals and related products,n.e.s. | 6,464 | 20.2 | 7,082 | 8.9 | 3,846 | 6.0 | 6,283 | 9.8 | 6,825 | 11.0 |
| 51. Organic chemicals | 507 | 1.6 | 821 | 1.0 | 538 | 0.8 | 783 | 1.2 | 907 | 1.5 |
| 52. Inorganic chemicals | 56 | 0.2 | 300 | 0.4 | 41 | 0.1 | 88 | 0.1 | 214 | 0.3 |
| 53. Dyeing,tanning and colouring material | 209 | 0.7 | 115 | 0.1 | 197 | 0.3 | 100 | 0.2 | 393 | 0.6 |
| 54. Medicinal and pharmaceutical products | 1,839 | 5.8 | 3,137 | 4.0 | 1,372 | 2.1 | 2,972 | 4.6 | 3,671 | 5.9 |
| 55. Perfume,cleaning etc.preparations | 2,305 | 7.2 | 1,967 | 2.5 | 1,175 | 1.8 | 1,710 | 2.7 | 1,150 | 1.9 |
| 57. Plastics in primary forms | 55 | 0.2 | 91 | 0.1 | 76 | 0.1 | 325 | 0.5 | 109 | 0.2 |
| 58. Plastics in non-primary forms | 148 | 0.5 | 121 | 0.2 | 39 | 0.1 | 94 | 0.1 | 108 | 0.2 |
| 59. Chemical materials and products,n.e.s. | 1,344 | 4.2 | 531 | 0.7 | 410 | 0.6 | 211 | 0.3 | 274 | 0.4 |
| 6. Basic manufactures | 3,099 | 9.7 | 4,027 | 5.1 | 3,303 | 5.1 | 3,941 | 6.1 | 4,125 | 6.7 |
| 61. Leather,dressed fur,etc. | 10 | 0.0 | 29 | 0.0 | 10 | 0.0 | ||||
| 62. Rubber manufactures,n.e.s. | 478 | 1.5 | 855 | 1.1 | 916 | 1.4 | 1,002 | 1.6 | 768 | 1.2 |
| 63. Wood and cork manufactures | 1 | 0.0 | 8 | 0.0 | 7 | 0.0 | ||||
| 64. Paper,paperboard and articles thereof | 304 | 1.0 | 383 | 0.5 | 366 | 0.6 | 592 | 0.9 | 566 | 0.9 |
| 65. Textile yarn,fabrics,made up articles,etc. | 93 | 0.3 | 90 | 0.1 | 169 | 0.3 | 46 | 0.1 | 264 | 0.4 |
| 66. Non-metallic mineral manufactures,n.e.s. | 28 | 0.1 | 38 | 0.0 | 5 | 0.0 | 37 | 0.1 | 80 | 0.1 |
| 67. Iron and steel | 311 | 1.0 | 672 | 0.8 | 486 | 0.8 | 415 | 0.6 | 605 | 1.0 |
| 68. Non-ferrous metals | 1,528 | 4.8 | 1,208 | 1.5 | 1,097 | 1.7 | 1,548 | 2.4 | 1,094 | 1.8 |
| 69. Manufactures of metals,n.e.s. | 356 | 1.1 | 770 | 1.0 | 227 | 0.4 | 295 | 0.5 | 739 | 1.2 |
| 7. Machinery,transport equipment | 11,669 | 36.5 | 49,823 | 62.8 | 37,898 | 58.8 | 33,844 | 52.7 | 34,824 | 56.3 |
| 71. Power generating machinery and equipment | 239 | 0.7 | 11,062 | 13.9 | 408 | 0.6 | 745 | 1.2 | 2,047 | 3.3 |
| 72. Machinery for specialized industries | 189 | 0.6 | 126 | 0.2 | 273 | 0.4 | 47 | 0.1 | 1,209 | 2.0 |
| 73. Metal working machinery | 46 | 0.1 | 55 | 0.1 | 28 | 0.0 | 238 | 0.4 | ||
| 74. General industrial machinery n.e.s. | 3,141 | 9.8 | 3,866 | 4.9 | 11,834 | 18.4 | 2,684 | 4.2 | 6,131 | 9.9 |
| 75. Office machines and adp machines | 2,318 | 7.3 | 10,329 | 13.0 | 3,661 | 5.7 | 21,141 | 32.9 | 15,807 | 25.6 |
| 76. Telecommunications and sound recording equipment | 3,016 | 9.4 | 16,965 | 21.4 | 13,789 | 21.4 | 1,123 | 1.7 | 2,188 | 3.5 |
| 77. Electric machinery,n.e.s.and parts | 2,613 | 8.2 | 2,922 | 3.7 | 2,215 | 3.4 | 3,999 | 6.2 | 3,438 | 5.6 |
| 78. Road vehicles | 107 | 0.3 | 4,272 | 5.4 | 5,329 | 8.3 | 3,959 | 6.2 | 1,928 | 3.1 |
| 79. Other transport equipment | 1,837 | 3.0 | ||||||||
| 8. Miscellaneous manufactured articles | 3,414 | 10.7 | 5,149 | 6.5 | 3,602 | 5.6 | 2,302 | 3.6 | 3,059 | 4.9 |
| 81. Prefabr.buildings;sanitary,lighting etc.fixtrs | 4 | 0.0 | 4 | 0.0 | 5 | 0.0 | ||||
| 82. Furniture and parts thereof | 63 | 0.2 | 5 | 0.0 | 224 | 0.4 | ||||
| 83. Travel goods,handbags and sim.containers | 1 | 0.0 | 285 | 0.4 | 82 | 0.1 | 54 | 0.1 | 4 | 0.0 |
| 84. Articles of apparel and clothing accessories | 134 | 0.4 | 116 | 0.1 | 17 | 0.0 | 41 | 0.1 | 181 | 0.3 |
| 85. Footwear | 3 | 0.0 | ||||||||
| 87. Instruments and apparates n.e.s. | 2,439 | 7.6 | 3,858 | 4.9 | 2,654 | 4.1 | 1,154 | 1.8 | 1,496 | 2.4 |
| 88. Photographic equipment,optical goods etc. | 99 | 0.3 | 1 | 0.0 | 7 | 0.0 | 5 | 0.0 | ||
| 89. Miscellaneous manufactured articles,n.e.s. | 678 | 2.1 | 885 | 1.1 | 837 | 1.3 | 1,036 | 1.6 | 1,154 | 1.9 |
| 9. Goods not classified elsewhere | 232 | 0.7 | 202 | 0.3 | 120 | 0.2 | 138 | 0.2 | 82 | 0.1 |
| 93. Special transactions and commodities not classified | 232 | 0.7 | ||||||||
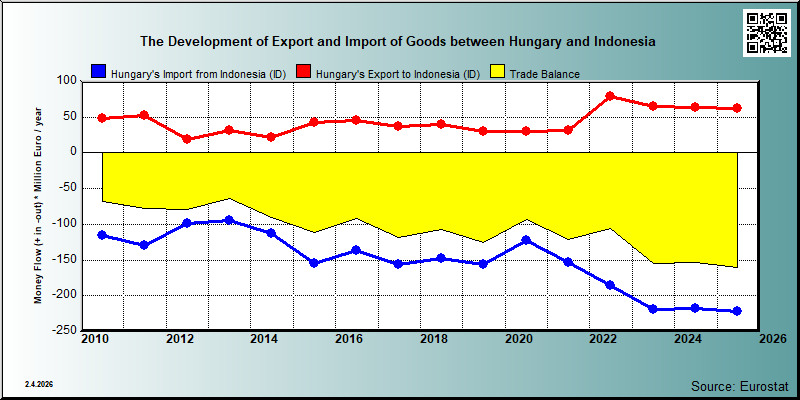
| In Total | 31,943 | 100.0 | 79,342 | 100.0 | 64,415 | 100.0 | 64,214 | 100.0 | 61,864 | 100.0 |

| 2021 | 2022 | 2023 | 2024 | 2025 | ||||||
|---|---|---|---|---|---|---|---|---|---|---|
| 1.000 € | % | 1.000 € | % | 1.000 € | % | 1.000 € | % | 1.000 € | % | |
| 0. Food and live animals | 2,811 | 1.8 | 3,429 | 1.8 | 2,045 | 0.9 | 3,132 | 1.4 | 3,851 | 1.7 |
| 01. Meat and meat preparations | 3 | 0.0 | 5 | 0.0 | 6 | 0.0 | 6 | 0.0 | ||
| 03. Fish and fish preparations | 118 | 0.1 | ||||||||
| 04. Cereals and cereal preparations | 4 | 0.0 | 26 | 0.0 | 2 | 0.0 | 10 | 0.0 | ||
| 05. Vegetables and fruit | 1,094 | 0.7 | 1,526 | 0.8 | 1,819 | 0.8 | ||||
| 06. Sugars,sugar preparations and honey | 154 | 0.1 | 174 | 0.1 | 93 | 0.0 | 169 | 0.1 | 246 | 0.1 |
| 07. Coffee,tea,cocoa,spices | 130 | 0.1 | 425 | 0.2 | 510 | 0.2 | 302 | 0.1 | 272 | 0.1 |
| 09. Miscellaneous edible products and preparations | 1,310 | 0.9 | 1,189 | 0.6 | 807 | 0.4 | 1,633 | 0.7 | 1,364 | 0.6 |
| 1. Beverages and tobacco | 544 | 0.4 | 560 | 0.3 | 997 | 0.5 | 2,040 | 0.9 | 1,964 | 0.9 |
| 12. Tobacco and tobacco manufactures | 544 | 0.4 | 560 | 0.3 | 997 | 0.5 | 2,040 | 0.9 | 1,964 | 0.9 |
| 2. Crude materials,inedible,except fuels | 33,161 | 21.7 | 47,637 | 25.6 | 101,692 | 46.5 | 93,693 | 42.9 | 93,758 | 42.3 |
| 23. Crude rubber (incl.synthetic) | ||||||||||
| 24. Cork and wood | 208 | 0.1 | 223 | 0.1 | 106 | 0.0 | 160 | 0.1 | 241 | 0.1 |
| 26. Textile fibres and their wastes | 2 | 0.0 | 3 | 0.0 | 8 | 0.0 | ||||
| 27. Crude fertilizers and crude minerals | ||||||||||
| 28. Metalliferous ores and metal scrap | ||||||||||
| 29. Crude animal,vegetable materials n.e.s. | 486 | 0.3 | 1,691 | 0.8 | 258 | 0.1 | 1,194 | 0.5 | ||
| 4. Animal and vegetable oils and fats | 749 | 0.5 | 894 | 0.5 | 1,559 | 0.7 | 1,958 | 0.9 | 3,853 | 1.7 |
| 42. Fixed vegetable fats and oils | 591 | 0.4 | 700 | 0.4 | 941 | 0.4 | 1,320 | 0.6 | 3,632 | 1.6 |
| 43. Processed animal or vegetable oils,etc. | 158 | 0.1 | 194 | 0.1 | 618 | 0.3 | 638 | 0.3 | ||
| 5. Chemicals and related products,n.e.s. | 8,279 | 5.4 | 5,989 | 3.2 | 6,362 | 2.9 | 1,532 | 0.7 | 2,016 | 0.9 |
| 51. Organic chemicals | 4,296 | 2.8 | 4,408 | 2.4 | 1,680 | 0.8 | 545 | 0.2 | 1,242 | 0.6 |
| 52. Inorganic chemicals | 464 | 0.3 | 1,026 | 0.6 | 305 | 0.1 | 311 | 0.1 | 230 | 0.1 |
| 53. Dyeing,tanning and colouring material | 1 | 0.0 | 14 | 0.0 | 245 | 0.1 | 218 | 0.1 | ||
| 54. Medicinal and pharmaceutical products | 2 | 0.0 | ||||||||
| 55. Perfume,cleaning etc.preparations | 90 | 0.1 | 124 | 0.1 | 108 | 0.0 | 229 | 0.1 | 153 | 0.1 |
| 57. Plastics in primary forms | 3,369 | 2.2 | 188 | 0.1 | 1,502 | 0.7 | 32 | 0.0 | ||
| 58. Plastics in non-primary forms | 47 | 0.0 | 238 | 0.1 | 2,645 | 1.2 | 88 | 0.0 | 97 | 0.0 |
| 59. Chemical materials and products,n.e.s. | 12 | 0.0 | 4 | 0.0 | 107 | 0.0 | 114 | 0.1 | 42 | 0.0 |
| 6. Basic manufactures | 5,941 | 3.9 | 7,246 | 3.9 | 10,779 | 4.9 | 7,109 | 3.3 | 4,029 | 1.8 |
| 61. Leather,dressed fur,etc. | ||||||||||
| 62. Rubber manufactures,n.e.s. | 317 | 0.2 | 41 | 0.0 | 138 | 0.1 | 390 | 0.2 | 276 | 0.1 |
| 63. Wood and cork manufactures | 120 | 0.1 | 70 | 0.0 | 75 | 0.0 | 59 | 0.0 | 57 | 0.0 |
| 64. Paper,paperboard and articles thereof | 141 | 0.1 | 1,709 | 0.9 | 2,535 | 1.2 | 2,049 | 0.9 | 1,327 | 0.6 |
| 65. Textile yarn,fabrics,made up articles,etc. | 4,071 | 2.7 | 4,849 | 2.6 | 5,646 | 2.6 | 2,475 | 1.1 | 1,889 | 0.9 |
| 66. Non-metallic mineral manufactures,n.e.s. | 70 | 0.0 | 57 | 0.0 | 71 | 0.0 | 43 | 0.0 | 65 | 0.0 |
| 67. Iron and steel | 293 | 0.2 | 2 | 0.0 | 2 | 0.0 | 1 | 0.0 | 2 | 0.0 |
| 68. Non-ferrous metals | 655 | 0.4 | 74 | 0.0 | 2,052 | 0.9 | 1,853 | 0.8 | 71 | 0.0 |
| 69. Manufactures of metals,n.e.s. | 274 | 0.2 | 444 | 0.2 | 261 | 0.1 | 239 | 0.1 | 340 | 0.2 |
| 7. Machinery,transport equipment | 88,132 | 57.6 | 107,983 | 58.1 | 85,242 | 39.0 | 95,455 | 43.7 | 100,849 | 45.5 |
| 71. Power generating machinery and equipment | 2,424 | 1.6 | 1,786 | 1.0 | 2,844 | 1.3 | 3,082 | 1.4 | 2,198 | 1.0 |
| 72. Machinery for specialized industries | 1 | 0.0 | 51 | 0.0 | 9 | 0.0 | 2,390 | 1.1 | 245 | 0.1 |
| 73. Metal working machinery | 8 | 0.0 | 2 | 0.0 | 1,275 | 0.6 | 2,095 | 0.9 | ||
| 74. General industrial machinery n.e.s. | 369 | 0.2 | 677 | 0.4 | 412 | 0.2 | 296 | 0.1 | 551 | 0.2 |
| 75. Office machines and adp machines | 19,682 | 12.9 | 24,864 | 13.4 | 10,793 | 4.9 | 13,113 | 6.0 | 14,360 | 6.5 |
| 76. Telecommunications and sound recording equipment | 18,516 | 12.1 | 19,334 | 10.4 | 9,129 | 4.2 | 6,248 | 2.9 | 10,231 | 4.6 |
| 77. Electric machinery,n.e.s.and parts | 43,458 | 28.4 | 53,594 | 28.9 | 56,783 | 26.0 | 67,401 | 30.9 | 68,284 | 30.8 |
| 78. Road vehicles | 3,673 | 2.4 | 7,678 | 4.1 | 5,270 | 2.4 | 1,651 | 0.8 | 2,883 | 1.3 |
| 79. Other transport equipment | 1 | 0.0 | ||||||||
| 8. Miscellaneous manufactured articles | 13,186 | 8.6 | 11,954 | 6.4 | 10,101 | 4.6 | 13,051 | 6.0 | 11,494 | 5.2 |
| 81. Prefabr.buildings;sanitary,lighting etc.fixtrs | 4 | 0.0 | 738 | 0.4 | 24 | 0.0 | 24 | 0.0 | ||
| 82. Furniture and parts thereof | 163 | 0.1 | 304 | 0.1 | 341 | 0.2 | 344 | 0.2 | ||
| 83. Travel goods,handbags and sim.containers | 30 | 0.0 | 74 | 0.0 | 22 | 0.0 | 37 | 0.0 | 44 | 0.0 |
| 84. Articles of apparel and clothing accessories | 1,093 | 0.7 | 878 | 0.5 | 828 | 0.4 | 661 | 0.3 | 609 | 0.3 |
| 85. Footwear | 158 | 0.1 | 417 | 0.2 | 1,172 | 0.5 | ||||
| 87. Instruments and apparates n.e.s. | 608 | 0.4 | 921 | 0.5 | 556 | 0.3 | 1,355 | 0.6 | 1,697 | 0.8 |
| 88. Photographic equipment,optical goods etc. | 224 | 0.1 | 267 | 0.1 | 181 | 0.1 | 150 | 0.1 | 1,750 | 0.8 |
| 89. Miscellaneous manufactured articles,n.e.s. | 10,908 | 7.1 | 8,440 | 4.5 | 7,770 | 3.6 | 9,312 | 4.3 | 6,563 | 3.0 |
| 9. Goods not classified elsewhere | 115 | 0.1 | 51 | 0.0 | 4 | 0.0 | 28 | 0.0 | 5 | 0.0 |
| 93. Special transactions and commodities not classified | 110 | 0.1 | ||||||||
| In Total | 152,928 | 100.0 | 185,743 | 100.0 | 218,793 | 100.0 | 218,263 | 100.0 | 221,818 | 100.0 |