
| European countries' export and import of goods | SITC |
Data:Eurostat
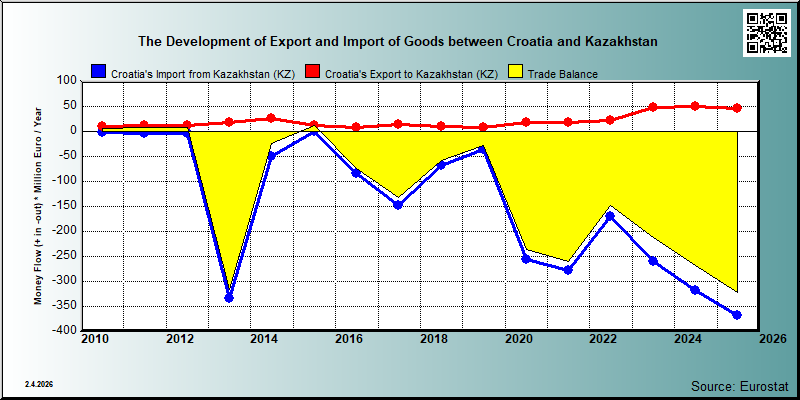
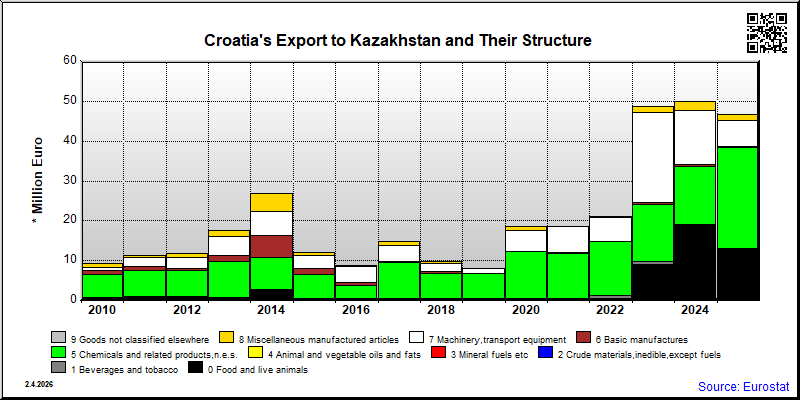
| 2021 | 2022 | 2023 | 2024 | 2025 | ||||||
|---|---|---|---|---|---|---|---|---|---|---|
| 1.000 € | % | 1.000 € | % | 1.000 € | % | 1.000 € | % | 1.000 € | % | |
| 2. Crude materials,inedible,except fuels | 2 | 0.0 | 194 | 0.4 | 445 | 0.9 | 250 | 0.5 | ||
| 22. Oil seeds,oleaginous fruits | ||||||||||
| 24. Cork and wood | 15 | 0.0 | ||||||||
| 29. Crude animal,vegetable materials n.e.s. | 250 | 0.5 | ||||||||
| 3. Mineral fuels etc | 73 | 0.3 | ||||||||
| 32. Coal,coke and briquettes | ||||||||||
| 33. Petroleum and products | 73 | 0.3 | ||||||||
| 34. Gas,natural and manufactured | ||||||||||
| 5. Chemicals and related products,n.e.s. | 11,745 | 63.0 | 13,510 | 64.1 | 14,559 | 29.1 | 25,310 | 54.1 | ||
| 57. Plastics in primary forms | ||||||||||
| 58. Plastics in non-primary forms | 12 | 0.0 | 3 | 0.0 | ||||||
| 59. Chemical materials and products,n.e.s. | 2,035 | 4.4 | ||||||||
| 6. Basic manufactures | 86 | 0.5 | 136 | 0.6 | 405 | 0.8 | 436 | 0.9 | 261 | 0.6 |
| 63. Wood and cork manufactures | 1 | 0.0 | 4 | 0.0 | ||||||
| 67. Iron and steel | 1 | 0.0 | 19 | 0.0 | 3 | 0.0 | ||||
| 68. Non-ferrous metals | 4 | 0.0 | 10 | 0.0 | ||||||
| 7. Machinery,transport equipment | 6,492 | 34.8 | 5,844 | 27.7 | 22,662 | 46.6 | 13,497 | 27.0 | ||
| 76. Telecommunications and sound recording equipment | 10 | 0.1 | 141 | 0.3 | ||||||
| 77. Electric machinery,n.e.s.and parts | 2,439 | 13.1 | 4,079 | 19.3 | ||||||
| 78. Road vehicles | 63 | 0.3 | 570 | 1.2 | ||||||
| 8. Miscellaneous manufactured articles | 171 | 0.9 | 341 | 1.6 | 1,442 | 3.0 | 2,362 | 4.7 | 1,485 | 3.2 |
| 82. Furniture and parts thereof | 1,003 | 2.0 | ||||||||
| 89. Miscellaneous manufactured articles,n.e.s. | 22 | 0.1 | 104 | 0.5 | 38 | 0.1 | 97 | 0.2 | 77 | 0.2 |
| 9. Goods not classified elsewhere | 3 | 0.0 | ||||||||
| 93. Special transactions and commodities not classified | ||||||||||
| In Total | 18,639 | 100.0 | 21,092 | 100.0 | 48,609 | 100.0 | 50,005 | 100.0 | 46,764 | 100.0 |
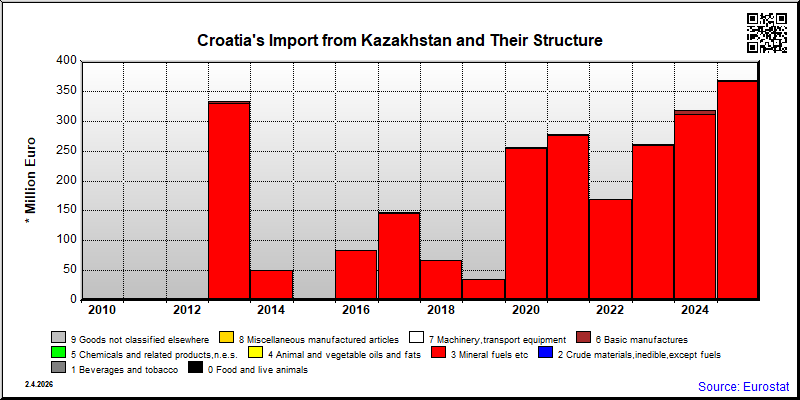
| 2021 | 2022 | 2023 | 2024 | 2025 | ||||||
|---|---|---|---|---|---|---|---|---|---|---|
| 1.000 € | % | 1.000 € | % | 1.000 € | % | 1.000 € | % | 1.000 € | % | |
| 2. Crude materials,inedible,except fuels | 31 | 0.0 | 70 | 0.0 | 191 | 0.1 | 100 | 0.0 | ||
| 22. Oil seeds,oleaginous fruits | 32 | 0.0 | ||||||||
| 24. Cork and wood | 170 | 0.1 | ||||||||
| 29. Crude animal,vegetable materials n.e.s. | 2 | 0.0 | ||||||||
| 3. Mineral fuels etc | 168,623 | 99.7 | ||||||||
| 32. Coal,coke and briquettes | ||||||||||
| 33. Petroleum and products | 136,291 | 80.6 | ||||||||
| 34. Gas,natural and manufactured | ||||||||||
| 5. Chemicals and related products,n.e.s. | 20 | 0.0 | 3 | 0.0 | ||||||
| 57. Plastics in primary forms | ||||||||||
| 58. Plastics in non-primary forms | 2 | 0.0 | ||||||||
| 59. Chemical materials and products,n.e.s. | 1 | 0.0 | ||||||||
| 6. Basic manufactures | 1,893 | 0.7 | 369 | 0.2 | 1,093 | 0.4 | 6,779 | 2.1 | 1,045 | 0.3 |
| 63. Wood and cork manufactures | 369 | 0.2 | 1,070 | 0.4 | ||||||
| 67. Iron and steel | 8 | 0.0 | 23 | 0.0 | 3 | 0.0 | ||||
| 68. Non-ferrous metals | 4,728 | 1.5 | 931 | 0.3 | ||||||
| 7. Machinery,transport equipment | 16 | 0.0 | 46 | 0.0 | 32 | 0.0 | ||||
| 76. Telecommunications and sound recording equipment | 32 | 0.0 | ||||||||
| 77. Electric machinery,n.e.s.and parts | ||||||||||
| 78. Road vehicles | 15 | 0.0 | 46 | 0.0 | ||||||
| 8. Miscellaneous manufactured articles | 27 | 0.0 | 196 | 0.1 | 116 | 0.0 | 18 | 0.0 | ||
| 82. Furniture and parts thereof | 40 | 0.0 | ||||||||
| 89. Miscellaneous manufactured articles,n.e.s. | 27 | 0.0 | 196 | 0.1 | 77 | 0.0 | 17 | 0.0 | ||
| 9. Goods not classified elsewhere | 15 | 0.0 | ||||||||
| 93. Special transactions and commodities not classified | ||||||||||
| In Total | 278,117 | 100.0 | 169,071 | 100.0 | 260,315 | 100.0 | 317,446 | 100.0 | 368,145 | 100.0 |