
| European countries' export and import of goods | SITC |
Data:Eurostat
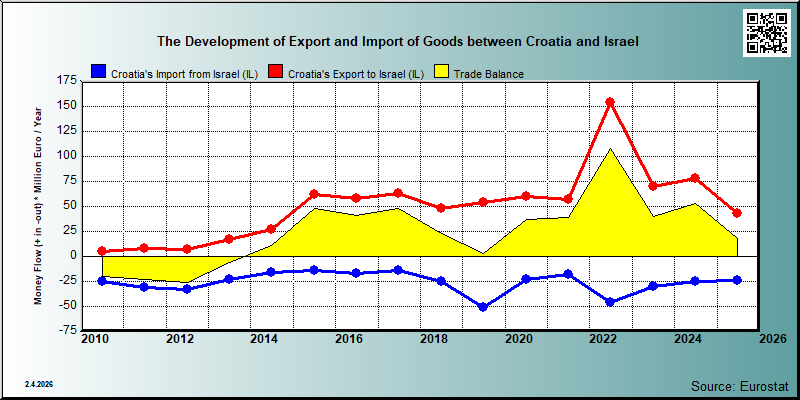

| 2021 | 2022 | 2023 | 2024 | 2025 | ||||||
|---|---|---|---|---|---|---|---|---|---|---|
| 1.000 € | % | 1.000 € | % | 1.000 € | % | 1.000 € | % | 1.000 € | % | |
| 0. Food and live animals | 24,160 | 42.4 | 41,312 | 26.9 | 33,982 | 48.7 | 2,458 | 3.1 | 3,160 | 7.4 |
| 00. Live animals | 22,259 | 39.0 | 38,530 | 25.1 | ||||||
| 03. Fish and fish preparations | 34 | 0.1 | 16 | 0.0 | 139 | 0.2 | 986 | 2.3 | ||
| 04. Cereals and cereal preparations | 291 | 0.4 | 586 | 0.7 | ||||||
| 05. Vegetables and fruit | 139 | 0.2 | 137 | 0.1 | 94 | 0.1 | 109 | 0.1 | 179 | 0.4 |
| 07. Coffee,tea,cocoa,spices | 772 | 1.1 | 1,247 | 1.6 | ||||||
| 09. Miscellaneous edible products and preparations | 113 | 0.2 | 125 | 0.1 | 180 | 0.3 | 98 | 0.1 | 125 | 0.3 |
| 1. Beverages and tobacco | 579 | 0.4 | 1,193 | 1.7 | 865 | 1.1 | ||||
| 11. Beverages | 482 | 0.3 | 862 | 1.1 | ||||||
| 2. Crude materials,inedible,except fuels | 532 | 0.9 | 1,645 | 1.1 | 868 | 1.2 | 921 | 1.2 | 895 | 2.1 |
| 21. Hides,skins,furskins,raw | ||||||||||
| 22. Oil seeds,oleaginous fruits | ||||||||||
| 27. Crude fertilizers and crude minerals | 16 | 0.0 | 53 | 0.0 | 65 | 0.1 | 35 | 0.1 | ||
| 28. Metalliferous ores and metal scrap | ||||||||||
| 29. Crude animal,vegetable materials n.e.s. | 21 | 0.0 | 32 | 0.0 | 29 | 0.0 | 39 | 0.0 | 80 | 0.2 |
| 3. Mineral fuels etc | 53 | 0.1 | ||||||||
| 32. Coal,coke and briquettes | ||||||||||
| 4. Animal and vegetable oils and fats | ||||||||||
| 42. Fixed vegetable fats and oils | ||||||||||
| 5. Chemicals and related products,n.e.s. | 20,546 | 36.0 | 24,616 | 16.0 | 18,931 | 27.1 | 18,317 | 23.4 | 15,744 | 37.0 |
| 51. Organic chemicals | 1,719 | 3.0 | 4,145 | 2.7 | 2,004 | 2.9 | 1,141 | 1.5 | 486 | 1.1 |
| 52. Inorganic chemicals | 46 | 0.0 | 15 | 0.0 | 1 | 0.0 | ||||
| 53. Dyeing,tanning and colouring material | 22 | 0.0 | 190 | 0.1 | 121 | 0.2 | 352 | 0.4 | 132 | 0.3 |
| 54. Medicinal and pharmaceutical products | 17,960 | 31.5 | 19,514 | 12.7 | 15,806 | 22.6 | 14,054 | 18.0 | 12,856 | 30.2 |
| 55. Perfume,cleaning etc.preparations | 99 | 0.2 | 164 | 0.1 | 135 | 0.2 | 177 | 0.2 | 114 | 0.3 |
| 56. Fertilizers,manufactured | ||||||||||
| 57. Plastics in primary forms | 78 | 0.1 | 57 | 0.0 | 103 | 0.1 | 152 | 0.2 | 87 | 0.2 |
| 58. Plastics in non-primary forms | 429 | 0.8 | 181 | 0.1 | 504 | 0.7 | 2,003 | 2.6 | 1,618 | 3.8 |
| 59. Chemical materials and products,n.e.s. | 240 | 0.4 | 318 | 0.2 | 258 | 0.4 | 416 | 0.5 | 451 | 1.1 |
| 6. Basic manufactures | 1,564 | 2.7 | 1,176 | 0.8 | 1,101 | 1.6 | 1,930 | 2.5 | 1,792 | 4.2 |
| 62. Rubber manufactures,n.e.s. | 7 | 0.0 | 3 | 0.0 | 4 | 0.0 | 21 | 0.0 | 77 | 0.2 |
| 63. Wood and cork manufactures | 60 | 0.1 | 17 | 0.0 | 20 | 0.0 | 53 | 0.1 | 81 | 0.2 |
| 64. Paper,paperboard and articles thereof | 60 | 0.1 | 148 | 0.1 | 123 | 0.2 | 177 | 0.2 | 205 | 0.5 |
| 65. Textile yarn,fabrics,made up articles,etc. | 781 | 1.4 | 423 | 0.3 | 622 | 0.9 | 661 | 0.8 | 424 | 1.0 |
| 66. Non-metallic mineral manufactures,n.e.s. | 542 | 1.0 | 288 | 0.2 | 216 | 0.3 | 453 | 0.6 | 599 | 1.4 |
| 67. Iron and steel | 48 | 0.1 | 60 | 0.0 | 73 | 0.1 | 92 | 0.1 | 65 | 0.2 |
| 68. Non-ferrous metals | 2 | 0.0 | 25 | 0.0 | 7 | 0.0 | 233 | 0.3 | ||
| 69. Manufactures of metals,n.e.s. | 63 | 0.1 | 212 | 0.1 | 37 | 0.1 | 240 | 0.3 | 165 | 0.4 |
| 7. Machinery,transport equipment | 6,019 | 10.6 | 18,064 | 11.7 | 10,276 | 14.7 | 12,943 | 16.5 | 17,520 | 41.2 |
| 71. Power generating machinery and equipment | 238 | 0.4 | 5,829 | 8.3 | 48 | 0.1 | 24 | 0.1 | ||
| 72. Machinery for specialized industries | 444 | 0.8 | 114 | 0.1 | 31 | 0.0 | 384 | 0.5 | 252 | 0.6 |
| 73. Metal working machinery | 74 | 0.1 | 3 | 0.0 | 2 | 0.0 | 20 | 0.0 | ||
| 74. General industrial machinery n.e.s. | 835 | 1.5 | 10,987 | 7.1 | 1,117 | 1.6 | 947 | 1.2 | 1,239 | 2.9 |
| 75. Office machines and adp machines | 395 | 0.7 | 230 | 0.1 | 1,004 | 1.4 | 163 | 0.2 | 94 | 0.2 |
| 76. Telecommunications and sound recording equipment | 1,023 | 1.8 | 1,682 | 1.1 | 337 | 0.5 | 639 | 0.8 | 281 | 0.7 |
| 77. Electric machinery,n.e.s.and parts | 1,866 | 3.3 | 2,380 | 1.5 | 1,507 | 2.2 | 3,174 | 4.1 | 3,400 | 8.0 |
| 78. Road vehicles | 106 | 0.2 | 116 | 0.2 | 90 | 0.1 | 684 | 1.6 | ||
| 79. Other transport equipment | 1,037 | 1.8 | 2,279 | 1.5 | 334 | 0.5 | 7,499 | 9.6 | 11,525 | 27.1 |
| 8. Miscellaneous manufactured articles | 3,520 | 6.2 | 3,614 | 2.3 | 3,415 | 4.9 | 40,821 | 52.2 | 2,920 | 6.9 |
| 81. Prefabr.buildings;sanitary,lighting etc.fixtrs | 35 | 0.1 | 45 | 0.1 | 36,907 | 47.2 | 49 | 0.1 | ||
| 82. Furniture and parts thereof | 1,011 | 1.8 | 808 | 0.5 | 864 | 1.2 | 578 | 0.7 | 630 | 1.5 |
| 83. Travel goods,handbags and sim.containers | 7 | 0.0 | 2 | 0.0 | 5 | 0.0 | 44 | 0.1 | ||
| 84. Articles of apparel and clothing accessories | 3 | 0.0 | 43 | 0.0 | 12 | 0.0 | 15 | 0.0 | 154 | 0.4 |
| 85. Footwear | 74 | 0.1 | 79 | 0.1 | ||||||
| 87. Instruments and apparates n.e.s. | 28 | 0.0 | 238 | 0.2 | 127 | 0.2 | 132 | 0.2 | 199 | 0.5 |
| 88. Photographic equipment,optical goods etc. | 11 | 0.0 | 2 | 0.0 | ||||||
| 89. Miscellaneous manufactured articles,n.e.s. | 2,363 | 4.1 | 2,438 | 1.6 | 2,316 | 3.3 | 3,102 | 4.0 | 1,805 | 4.2 |
| 9. Goods not classified elsewhere | 34 | 0.1 | ||||||||
| 93. Special transactions and commodities not classified | 34 | 0.1 | ||||||||
| In Total | 57,037 | 100.0 | 153,801 | 100.0 | 69,818 | 100.0 | 78,266 | 100.0 | 42,567 | 100.0 |

| 2021 | 2022 | 2023 | 2024 | 2025 | ||||||
|---|---|---|---|---|---|---|---|---|---|---|
| 1.000 € | % | 1.000 € | % | 1.000 € | % | 1.000 € | % | 1.000 € | % | |
| 0. Food and live animals | 641 | 3.6 | 988 | 2.2 | 1,291 | 4.3 | 1,117 | 4.4 | 1,344 | 5.5 |
| 00. Live animals | 212 | 1.2 | 337 | 0.7 | ||||||
| 03. Fish and fish preparations | 55 | 0.3 | 74 | 0.2 | 8 | 0.0 | 34 | 0.1 | ||
| 04. Cereals and cereal preparations | 21 | 0.1 | 1 | 0.0 | ||||||
| 05. Vegetables and fruit | 306 | 1.7 | 361 | 0.8 | 978 | 3.3 | 972 | 3.9 | 1,039 | 4.3 |
| 07. Coffee,tea,cocoa,spices | 1 | 0.0 | 1 | 0.0 | ||||||
| 09. Miscellaneous edible products and preparations | 68 | 0.4 | 216 | 0.5 | 242 | 0.8 | 135 | 0.5 | 271 | 1.1 |
| 1. Beverages and tobacco | 1 | 0.0 | ||||||||
| 11. Beverages | 1 | 0.0 | ||||||||
| 2. Crude materials,inedible,except fuels | 37 | 0.2 | 6 | 0.0 | 22 | 0.1 | 8 | 0.0 | 63 | 0.3 |
| 21. Hides,skins,furskins,raw | ||||||||||
| 22. Oil seeds,oleaginous fruits | ||||||||||
| 27. Crude fertilizers and crude minerals | 1 | 0.0 | ||||||||
| 28. Metalliferous ores and metal scrap | ||||||||||
| 29. Crude animal,vegetable materials n.e.s. | 25 | 0.1 | 5 | 0.0 | 22 | 0.1 | 8 | 0.0 | 1 | 0.0 |
| 3. Mineral fuels etc | ||||||||||
| 32. Coal,coke and briquettes | ||||||||||
| 4. Animal and vegetable oils and fats | ||||||||||
| 42. Fixed vegetable fats and oils | ||||||||||
| 5. Chemicals and related products,n.e.s. | 6,291 | 35.5 | 24,797 | 54.1 | 10,038 | 33.5 | 8,947 | 35.5 | 10,118 | 41.7 |
| 51. Organic chemicals | 2,367 | 13.3 | 9,416 | 20.6 | 1,819 | 6.1 | 1,538 | 6.1 | 2,058 | 8.5 |
| 52. Inorganic chemicals | 28 | 0.1 | 1 | 0.0 | ||||||
| 53. Dyeing,tanning and colouring material | 96 | 0.5 | 158 | 0.3 | 915 | 3.1 | 511 | 2.0 | 305 | 1.3 |
| 54. Medicinal and pharmaceutical products | 1,417 | 8.0 | 1,195 | 2.6 | 3,415 | 11.4 | 3,861 | 15.3 | 4,825 | 19.9 |
| 55. Perfume,cleaning etc.preparations | 58 | 0.3 | 226 | 0.5 | 132 | 0.4 | 85 | 0.3 | 130 | 0.5 |
| 56. Fertilizers,manufactured | ||||||||||
| 57. Plastics in primary forms | 405 | 2.3 | 343 | 1.1 | 859 | 3.4 | 1,105 | 4.6 | ||
| 58. Plastics in non-primary forms | 633 | 3.6 | 8,877 | 19.4 | 882 | 2.9 | 634 | 2.5 | 764 | 3.1 |
| 59. Chemical materials and products,n.e.s. | 1,257 | 7.1 | 1,550 | 3.4 | 2,525 | 8.4 | 1,459 | 5.8 | 817 | 3.4 |
| 6. Basic manufactures | 777 | 4.4 | 2,560 | 5.6 | 780 | 2.6 | 753 | 3.0 | 800 | 3.3 |
| 62. Rubber manufactures,n.e.s. | 49 | 0.3 | 106 | 0.2 | 104 | 0.3 | 5 | 0.0 | 8 | 0.0 |
| 63. Wood and cork manufactures | 8 | 0.0 | 8 | 0.0 | 16 | 0.1 | 13 | 0.1 | 19 | 0.1 |
| 64. Paper,paperboard and articles thereof | 6 | 0.0 | 4 | 0.0 | 8 | 0.0 | 5 | 0.0 | 180 | 0.7 |
| 65. Textile yarn,fabrics,made up articles,etc. | 4 | 0.0 | 4 | 0.0 | 5 | 0.0 | 83 | 0.3 | 18 | 0.1 |
| 66. Non-metallic mineral manufactures,n.e.s. | 25 | 0.1 | 12 | 0.0 | 7 | 0.0 | 9 | 0.0 | 22 | 0.1 |
| 67. Iron and steel | 3 | 0.0 | 594 | 1.3 | 9 | 0.0 | 36 | 0.1 | 7 | 0.0 |
| 68. Non-ferrous metals | 156 | 0.9 | 833 | 1.8 | 97 | 0.3 | 11 | 0.0 | ||
| 69. Manufactures of metals,n.e.s. | 526 | 3.0 | 1,000 | 2.2 | 535 | 1.8 | 591 | 2.3 | 546 | 2.2 |
| 7. Machinery,transport equipment | 2,646 | 14.9 | 5,172 | 11.3 | 7,329 | 24.4 | 5,876 | 23.3 | 2,344 | 9.7 |
| 71. Power generating machinery and equipment | 5 | 0.0 | 5 | 0.0 | 3 | 0.0 | 10 | 0.0 | ||
| 72. Machinery for specialized industries | 422 | 2.4 | 170 | 0.4 | 103 | 0.3 | 209 | 0.8 | 54 | 0.2 |
| 73. Metal working machinery | 54 | 0.3 | 71 | 0.2 | 63 | 0.2 | 66 | 0.3 | ||
| 74. General industrial machinery n.e.s. | 865 | 4.9 | 1,122 | 2.4 | 4,702 | 15.7 | 3,748 | 14.9 | 1,414 | 5.8 |
| 75. Office machines and adp machines | 126 | 0.7 | 1,584 | 3.5 | 904 | 3.0 | 116 | 0.5 | 115 | 0.5 |
| 76. Telecommunications and sound recording equipment | 698 | 3.9 | 723 | 1.6 | 380 | 1.3 | 550 | 2.2 | 86 | 0.4 |
| 77. Electric machinery,n.e.s.and parts | 461 | 2.6 | 1,469 | 3.2 | 961 | 3.2 | 912 | 3.6 | 483 | 2.0 |
| 78. Road vehicles | 4 | 0.0 | 62 | 0.2 | 4 | 0.0 | 2 | 0.0 | ||
| 79. Other transport equipment | 12 | 0.1 | 34 | 0.1 | 148 | 0.5 | 295 | 1.2 | 114 | 0.5 |
| 8. Miscellaneous manufactured articles | 7,326 | 41.3 | 12,281 | 26.8 | 10,532 | 35.1 | 8,533 | 33.8 | 9,595 | 39.5 |
| 81. Prefabr.buildings;sanitary,lighting etc.fixtrs | 1 | 0.0 | 1 | 0.0 | 1 | 0.0 | ||||
| 82. Furniture and parts thereof | 156 | 0.9 | 12 | 0.0 | 2 | 0.0 | 4 | 0.0 | 20 | 0.1 |
| 83. Travel goods,handbags and sim.containers | 1 | 0.0 | 1 | 0.0 | 1 | 0.0 | ||||
| 84. Articles of apparel and clothing accessories | 2 | 0.0 | 24 | 0.1 | 101 | 0.3 | 162 | 0.6 | 130 | 0.5 |
| 85. Footwear | ||||||||||
| 87. Instruments and apparates n.e.s. | 719 | 4.1 | 874 | 1.9 | 1,055 | 3.5 | 908 | 3.6 | 511 | 2.1 |
| 88. Photographic equipment,optical goods etc. | 9 | 0.0 | 1 | 0.0 | 7 | 0.0 | ||||
| 89. Miscellaneous manufactured articles,n.e.s. | 6,438 | 36.3 | 11,361 | 24.8 | 9,368 | 31.2 | 7,456 | 29.5 | 8,926 | 36.8 |
| 9. Goods not classified elsewhere | 11 | 0.1 | ||||||||
| 93. Special transactions and commodities not classified | 11 | 0.1 | ||||||||
| In Total | 17,730 | 100.0 | 45,804 | 100.0 | 29,993 | 100.0 | 25,235 | 100.0 | 24,265 | 100.0 |