
| European countries' export and import of goods | SITC |
Data:Eurostat

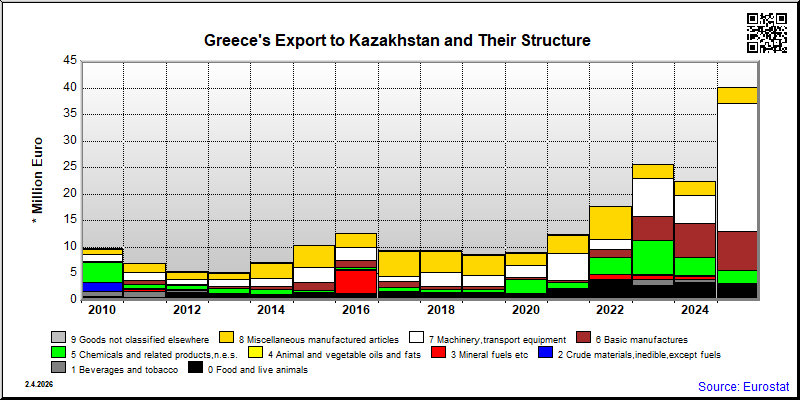
| 2021 | 2022 | 2023 | 2024 | 2025 | ||||||
|---|---|---|---|---|---|---|---|---|---|---|
| 1.000 € | % | 1.000 € | % | 1.000 € | % | 1.000 € | % | 1.000 € | % | |
| 0. Food and live animals | 2,012 | 16.1 | 3,838 | 21.3 | 2,886 | 11.2 | 3,373 | 15.1 | 2,914 | 7.3 |
| 04. Cereals and cereal preparations | 40 | 0.3 | 121 | 0.7 | 44 | 0.2 | ||||
| 05. Vegetables and fruit | 3,616 | 20.1 | 2,663 | 10.3 | 3,121 | 14.0 | 2,692 | 6.7 | ||
| 2. Crude materials,inedible,except fuels | 69 | 0.6 | 4 | 0.0 | 21 | 0.1 | 4 | 0.0 | 62 | 0.2 |
| 22. Oil seeds,oleaginous fruits | 1 | 0.0 | ||||||||
| 26. Textile fibres and their wastes | ||||||||||
| 27. Crude fertilizers and crude minerals | 59 | 0.1 | ||||||||
| 3. Mineral fuels etc | 18 | 0.1 | 943 | 5.2 | 745 | 2.9 | 437 | 2.0 | 61 | 0.2 |
| 32. Coal,coke and briquettes | ||||||||||
| 33. Petroleum and products | 18 | 0.1 | 943 | 5.2 | 745 | 2.9 | 437 | 2.0 | 61 | 0.2 |
| 34. Gas,natural and manufactured | ||||||||||
| 5. Chemicals and related products,n.e.s. | 1,033 | 8.3 | 3,093 | 17.2 | 6,370 | 24.7 | 3,279 | 14.7 | 2,414 | 6.0 |
| 52. Inorganic chemicals | ||||||||||
| 57. Plastics in primary forms | 161 | 0.9 | 1,628 | 6.3 | 571 | 2.6 | 227 | 0.6 | ||
| 58. Plastics in non-primary forms | 36 | 0.1 | ||||||||
| 59. Chemical materials and products,n.e.s. | 670 | 5.4 | 2,106 | 11.7 | 3,898 | 15.1 | ||||
| 6. Basic manufactures | 404 | 3.2 | 1,574 | 8.7 | 4,649 | 18.0 | 6,418 | 28.7 | 7,286 | 18.2 |
| 61. Leather,dressed fur,etc. | 25 | 0.1 | ||||||||
| 62. Rubber manufactures,n.e.s. | 60 | 0.1 | ||||||||
| 63. Wood and cork manufactures | ||||||||||
| 66. Non-metallic mineral manufactures,n.e.s. | 954 | 2.4 | ||||||||
| 67. Iron and steel | 618 | 2.8 | 116 | 0.3 | ||||||
| 68. Non-ferrous metals | 17 | 0.1 | 593 | 3.3 | 975 | 3.8 | 1,190 | 5.3 | 973 | 2.4 |
| 7. Machinery,transport equipment | 5,125 | 41.1 | 1,909 | 10.6 | 7,032 | 27.3 | 5,236 | 23.4 | ||
| 74. General industrial machinery n.e.s. | 749 | 4.2 | 1,325 | 5.1 | ||||||
| 75. Office machines and adp machines | 3 | 0.0 | 46 | 0.3 | 37 | 0.1 | ||||
| 76. Telecommunications and sound recording equipment | 75 | 0.3 | ||||||||
| 77. Electric machinery,n.e.s.and parts | 323 | 1.3 | ||||||||
| 78. Road vehicles | 538 | 2.1 | 350 | 1.6 | ||||||
| 8. Miscellaneous manufactured articles | 3,328 | 26.7 | 6,184 | 34.4 | 2,579 | 10.0 | 2,652 | 11.9 | 2,943 | 7.3 |
| 82. Furniture and parts thereof | 429 | 1.7 | 22 | 0.1 | ||||||
| 84. Articles of apparel and clothing accessories | 1,543 | 6.0 | 2,654 | 6.6 | ||||||
| 85. Footwear | 35 | 0.2 | 28 | 0.1 | ||||||
| 87. Instruments and apparates n.e.s. | 56 | 0.4 | 246 | 1.4 | 119 | 0.5 | 33 | 0.1 | ||
| 89. Miscellaneous manufactured articles,n.e.s. | 144 | 1.2 | 271 | 1.5 | 327 | 1.3 | 272 | 1.2 | 158 | 0.4 |
| In Total | 12,457 | 100.0 | 18,001 | 100.0 | 25,771 | 100.0 | 22,354 | 100.0 | 40,092 | 100.0 |
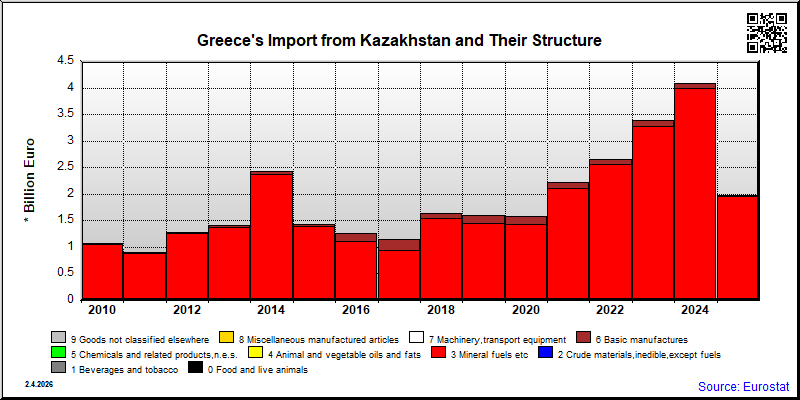
| 2021 | 2022 | 2023 | 2024 | 2025 | ||||||
|---|---|---|---|---|---|---|---|---|---|---|
| 1.000 € | % | 1.000 € | % | 1.000 € | % | 1.000 € | % | 1.000 € | % | |
| 0. Food and live animals | 1,569 | 0.1 | 20,430 | 0.8 | 10,445 | 0.3 | 225 | 0.0 | 238 | 0.0 |
| 04. Cereals and cereal preparations | 1,569 | 0.1 | 20,359 | 0.8 | 10,372 | 0.3 | ||||
| 05. Vegetables and fruit | 71 | 0.0 | 73 | 0.0 | 225 | 0.0 | 238 | 0.0 | ||
| 2. Crude materials,inedible,except fuels | 19 | 0.0 | 76 | 0.0 | 1 | 0.0 | 2 | 0.0 | 59 | 0.0 |
| 22. Oil seeds,oleaginous fruits | 18 | 0.0 | ||||||||
| 26. Textile fibres and their wastes | ||||||||||
| 27. Crude fertilizers and crude minerals | 1 | 0.0 | ||||||||
| 3. Mineral fuels etc | 2,099,175 | 94.5 | 2,533,519 | 95.3 | 3,273,550 | 96.6 | 3,991,462 | 97.9 | 1,951,534 | 99.1 |
| 32. Coal,coke and briquettes | ||||||||||
| 33. Petroleum and products | 2,097,173 | 94.4 | 2,522,995 | 94.9 | 3,273,371 | 96.6 | 3,991,462 | 97.9 | 1,951,534 | 99.1 |
| 34. Gas,natural and manufactured | ||||||||||
| 5. Chemicals and related products,n.e.s. | 8 | 0.0 | 770 | 0.0 | 2,742 | 0.1 | 2,769 | 0.1 | ||
| 52. Inorganic chemicals | ||||||||||
| 57. Plastics in primary forms | 745 | 0.0 | 2,707 | 0.1 | 2,768 | 0.1 | ||||
| 58. Plastics in non-primary forms | 1 | 0.0 | ||||||||
| 59. Chemical materials and products,n.e.s. | 8 | 0.0 | 26 | 0.0 | ||||||
| 6. Basic manufactures | 120,444 | 5.4 | 104,197 | 3.9 | 103,592 | 3.1 | 83,987 | 2.1 | 15,037 | 0.8 |
| 61. Leather,dressed fur,etc. | 131 | 0.0 | ||||||||
| 62. Rubber manufactures,n.e.s. | 35 | 0.0 | ||||||||
| 63. Wood and cork manufactures | 29 | 0.0 | ||||||||
| 66. Non-metallic mineral manufactures,n.e.s. | 1 | 0.0 | ||||||||
| 67. Iron and steel | 720 | 0.0 | 159 | 0.0 | ||||||
| 68. Non-ferrous metals | 119,626 | 5.4 | 102,183 | 3.8 | 102,879 | 3.0 | 83,137 | 2.0 | 14,843 | 0.8 |
| 7. Machinery,transport equipment | 7 | 0.0 | 42 | 0.0 | 16 | 0.0 | ||||
| 74. General industrial machinery n.e.s. | 5 | 0.0 | 18 | 0.0 | ||||||
| 75. Office machines and adp machines | 1 | 0.0 | 22 | 0.0 | ||||||
| 76. Telecommunications and sound recording equipment | 16 | 0.0 | ||||||||
| 77. Electric machinery,n.e.s.and parts | 1 | 0.0 | ||||||||
| 78. Road vehicles | 1 | 0.0 | ||||||||
| 8. Miscellaneous manufactured articles | 1 | 0.0 | 34 | 0.0 | 41 | 0.0 | 37 | 0.0 | 30 | 0.0 |
| 82. Furniture and parts thereof | 10 | 0.0 | 10 | 0.0 | ||||||
| 84. Articles of apparel and clothing accessories | 2 | 0.0 | 1 | 0.0 | ||||||
| 85. Footwear | 1 | 0.0 | 1 | 0.0 | ||||||
| 87. Instruments and apparates n.e.s. | 9 | 0.0 | 27 | 0.0 | 1 | 0.0 | ||||
| 89. Miscellaneous manufactured articles,n.e.s. | 26 | 0.0 | 2 | 0.0 | 26 | 0.0 | 27 | 0.0 | ||
| In Total | 2,221,208 | 100.0 | 2,658,271 | 100.0 | 3,388,440 | 100.0 | 4,078,471 | 100.0 | 1,969,667 | 100.0 |