
| European countries' export and import of goods | SITC |
Data:Eurostat
| 2021 | 2022 | 2023 | 2024 | 2025 | ||||||
|---|---|---|---|---|---|---|---|---|---|---|
| 1.000 € | % | 1.000 € | % | 1.000 € | % | 1.000 € | % | 1.000 € | % | |
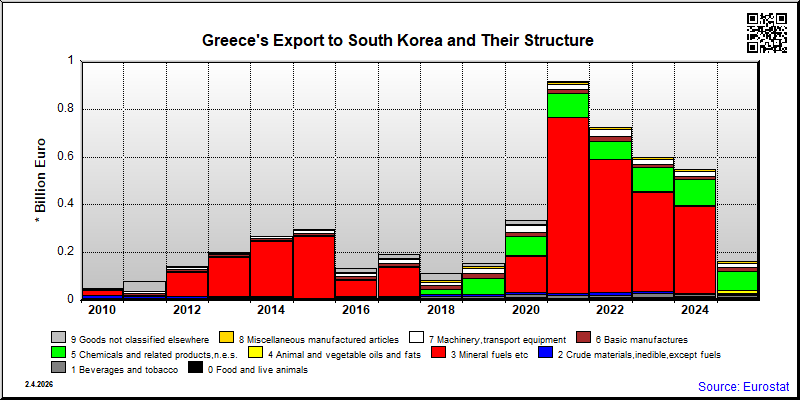
| 0. Food and live animals | 10,154 | 1.1 | 10,760 | 1.5 | 13,980 | 2.3 | 14,725 | 2.7 | 13,249 | 8.1 |
| 02. Dairy products and birds' eggs | 993 | 0.1 | 1,709 | 0.2 | 1,527 | 0.3 | ||||
| 03. Fish and fish preparations | 6 | 0.0 | ||||||||
| 04. Cereals and cereal preparations | 988 | 0.1 | 834 | 0.1 | 1,197 | 0.2 | 808 | 0.1 | 255 | 0.2 |
| 05. Vegetables and fruit | 5,694 | 0.6 | 5,957 | 0.8 | 8,288 | 1.4 | 9,059 | 1.6 | 5,277 | 3.2 |
| 06. Sugars,sugar preparations and honey | 789 | 0.1 | ||||||||
| 07. Coffee,tea,cocoa,spices | 197 | 0.0 | 3 | 0.0 | 38 | 0.0 | 149 | 0.1 | ||
| 08. Feeding stuff for animals | 255 | 0.0 | ||||||||
| 09. Miscellaneous edible products and preparations | 992 | 0.1 | 1,116 | 0.2 | 1,153 | 0.2 | 1,667 | 0.3 | 2,222 | 1.4 |
| 1. Beverages and tobacco | 9,285 | 1.0 | 10,473 | 1.4 | 14,662 | 2.4 | 11,310 | 2.1 | 9,052 | 5.6 |
| 11. Beverages | 1,380 | 0.2 | 2,106 | 0.3 | 1,791 | 0.3 | 1,802 | 0.3 | 1,415 | 0.9 |
| 12. Tobacco and tobacco manufactures | 12,872 | 2.1 | 9,508 | 1.7 | 7,638 | 4.7 | ||||
| 2. Crude materials,inedible,except fuels | 9,492 | 1.0 | 11,315 | 1.6 | 7,259 | 1.2 | 4,325 | 0.8 | 3,663 | 2.2 |
| 23. Crude rubber (incl.synthetic) | ||||||||||
| 26. Textile fibres and their wastes | 7 | 0.0 | ||||||||
| 28. Metalliferous ores and metal scrap | 3,022 | 0.3 | 4,020 | 0.6 | 2,795 | 0.5 | 709 | 0.1 | 1,704 | 1.0 |
| 29. Crude animal,vegetable materials n.e.s. | 4,197 | 0.5 | 3,393 | 0.5 | 2,410 | 0.4 | 2,701 | 0.5 | 1,285 | 0.8 |
| 3. Mineral fuels etc | 736,999 | 80.3 | 557,382 | 76.7 | 416,466 | 68.8 | 364,581 | 66.1 | 4,955 | 3.0 |
| 33. Petroleum and products | 736,988 | 80.3 | 557,354 | 76.7 | 416,466 | 68.8 | 364,581 | 66.1 | 4,937 | 3.0 |
| 34. Gas,natural and manufactured | 21 | 0.0 | 19 | 0.0 | ||||||
| 5. Chemicals and related products,n.e.s. | 97,269 | 10.6 | 74,368 | 10.2 | 100,508 | 16.6 | 106,569 | 19.3 | 81,303 | 49.9 |
| 51. Organic chemicals | 2 | 0.0 | 760 | 0.1 | 105 | 0.1 | ||||
| 52. Inorganic chemicals | 8 | 0.0 | 3 | 0.0 | 3 | 0.0 | 4 | 0.0 | ||
| 53. Dyeing,tanning and colouring material | 170 | 0.0 | 351 | 0.0 | 201 | 0.0 | 141 | 0.0 | 177 | 0.1 |
| 54. Medicinal and pharmaceutical products | 94,668 | 10.3 | 71,554 | 9.8 | 97,572 | 16.1 | 104,195 | 18.9 | 79,508 | 48.8 |
| 55. Perfume,cleaning etc.preparations | 1,083 | 0.1 | 1,216 | 0.2 | 1,101 | 0.2 | 1,534 | 0.3 | 847 | 0.5 |
| 57. Plastics in primary forms | 739 | 0.1 | 922 | 0.1 | 502 | 0.1 | 278 | 0.1 | 258 | 0.2 |
| 58. Plastics in non-primary forms | 300 | 0.0 | 52 | 0.0 | 230 | 0.0 | 129 | 0.0 | 174 | 0.1 |
| 59. Chemical materials and products,n.e.s. | 142 | 0.0 | 195 | 0.0 | 125 | 0.0 | 205 | 0.0 | 192 | 0.1 |
| 6. Basic manufactures | 18,473 | 2.0 | 20,736 | 2.9 | 12,404 | 2.0 | 15,006 | 2.7 | 16,033 | 9.8 |
| 61. Leather,dressed fur,etc. | 436 | 0.0 | 634 | 0.1 | 2,272 | 0.4 | 1,359 | 0.2 | 1,673 | 1.0 |
| 62. Rubber manufactures,n.e.s. | 36 | 0.0 | 51 | 0.0 | 14 | 0.0 | 21 | 0.0 | 16 | 0.0 |
| 63. Wood and cork manufactures | 11 | 0.0 | 1 | 0.0 | 2 | 0.0 | 15 | 0.0 | 3 | 0.0 |
| 64. Paper,paperboard and articles thereof | 1,534 | 0.2 | 3,235 | 0.4 | 1,150 | 0.2 | 3,278 | 0.6 | 1,314 | 0.8 |
| 65. Textile yarn,fabrics,made up articles,etc. | 6,777 | 0.7 | 3,722 | 0.5 | 2,736 | 0.5 | 5,056 | 0.9 | 5,572 | 3.4 |
| 66. Non-metallic mineral manufactures,n.e.s. | 2,882 | 0.3 | 4,141 | 0.6 | 2,081 | 0.3 | 1,987 | 0.4 | 1,203 | 0.7 |
| 67. Iron and steel | 3 | 0.0 | 19 | 0.0 | 67 | 0.0 | 2 | 0.0 | 15 | 0.0 |
| 68. Non-ferrous metals | 6,270 | 0.7 | 8,549 | 1.2 | 3,833 | 0.6 | 3,154 | 0.6 | 5,432 | 3.3 |
| 69. Manufactures of metals,n.e.s. | 526 | 0.1 | 383 | 0.1 | 250 | 0.0 | 134 | 0.0 | 806 | 0.5 |
| 7. Machinery,transport equipment | 20,415 | 2.2 | 27,113 | 3.7 | 19,830 | 3.3 | 18,706 | 3.4 | 16,885 | 10.4 |
| 71. Power generating machinery and equipment | 4,815 | 0.5 | 4,617 | 0.6 | 4,355 | 0.7 | 5,407 | 1.0 | 5,306 | 3.3 |
| 72. Machinery for specialized industries | 71 | 0.0 | 199 | 0.0 | 71 | 0.0 | 118 | 0.0 | 22 | 0.0 |
| 73. Metal working machinery | 24 | 0.0 | 1 | 0.0 | 14 | 0.0 | ||||
| 74. General industrial machinery n.e.s. | 5,240 | 0.6 | 11,949 | 1.6 | 6,220 | 1.0 | 4,143 | 0.8 | 4,069 | 2.5 |
| 75. Office machines and adp machines | 1,983 | 0.2 | 1,566 | 0.2 | 1,516 | 0.3 | 1,498 | 0.3 | 1,402 | 0.9 |
| 76. Telecommunications and sound recording equipment | 817 | 0.1 | 801 | 0.1 | 795 | 0.1 | 1,141 | 0.2 | 1,340 | 0.8 |
| 77. Electric machinery,n.e.s.and parts | 5,567 | 0.6 | 6,255 | 0.9 | 3,526 | 0.6 | 2,716 | 0.5 | 1,662 | 1.0 |
| 78. Road vehicles | 1,912 | 0.2 | 1,655 | 0.2 | 2,859 | 0.5 | 3,682 | 0.7 | 3,070 | 1.9 |
| 79. Other transport equipment | 9 | 0.0 | 47 | 0.0 | 487 | 0.1 | ||||
| 8. Miscellaneous manufactured articles | 7,062 | 0.8 | 8,691 | 1.2 | 10,205 | 1.7 | 7,800 | 1.4 | 8,914 | 5.5 |
| 81. Prefabr.buildings;sanitary,lighting etc.fixtrs | 41 | 0.0 | 48 | 0.0 | 94 | 0.0 | 28 | 0.0 | 27 | 0.0 |
| 82. Furniture and parts thereof | 185 | 0.0 | 153 | 0.0 | 71 | 0.0 | 111 | 0.0 | 137 | 0.1 |
| 83. Travel goods,handbags and sim.containers | 251 | 0.0 | 179 | 0.0 | 73 | 0.0 | 45 | 0.0 | 12 | 0.0 |
| 84. Articles of apparel and clothing accessories | 2,474 | 0.3 | 4,355 | 0.6 | 6,609 | 1.1 | 4,688 | 0.8 | 3,972 | 2.4 |
| 85. Footwear | 100 | 0.0 | 115 | 0.0 | 184 | 0.0 | 121 | 0.0 | 91 | 0.1 |
| 87. Instruments and apparates n.e.s. | 1,465 | 0.2 | 1,440 | 0.2 | 1,625 | 0.3 | 964 | 0.2 | 3,161 | 1.9 |
| 88. Photographic equipment,optical goods etc. | 228 | 0.0 | 74 | 0.0 | 53 | 0.0 | 105 | 0.0 | 68 | 0.0 |
| 89. Miscellaneous manufactured articles,n.e.s. | 2,318 | 0.3 | 2,327 | 0.3 | 1,496 | 0.2 | 1,738 | 0.3 | 1,447 | 0.9 |
| 9. Goods not classified elsewhere | 7,487 | 0.8 | ||||||||
| 93. Special transactions and commodities not classified | 2 | 0.0 | ||||||||
| In Total | 917,866 | 100.0 | 726,847 | 100.0 | 605,407 | 100.0 | 551,653 | 100.0 | 162,997 | 100.0 |
| 2021 | 2022 | 2023 | 2024 | 2025 | ||||||
|---|---|---|---|---|---|---|---|---|---|---|
| 1.000 € | % | 1.000 € | % | 1.000 € | % | 1.000 € | % | 1.000 € | % | |
| 0. Food and live animals | 370 | 0.1 | 454 | 0.1 | 255 | 0.1 | 924 | 0.2 | 2,862 | 0.6 |
| 02. Dairy products and birds' eggs | 65 | 0.0 | ||||||||
| 03. Fish and fish preparations | 1,048 | 0.2 | ||||||||
| 04. Cereals and cereal preparations | 7 | 0.0 | 19 | 0.0 | 36 | 0.0 | 93 | 0.0 | 49 | 0.0 |
| 05. Vegetables and fruit | 210 | 0.1 | 217 | 0.0 | 121 | 0.0 | 307 | 0.1 | 155 | 0.0 |
| 06. Sugars,sugar preparations and honey | 3 | 0.0 | ||||||||
| 07. Coffee,tea,cocoa,spices | 2 | 0.0 | 2 | 0.0 | 1 | 0.0 | 3 | 0.0 | ||
| 08. Feeding stuff for animals | 15 | 0.0 | ||||||||
| 09. Miscellaneous edible products and preparations | 137 | 0.0 | 150 | 0.0 | 95 | 0.0 | 523 | 0.1 | 1,607 | 0.3 |
| 1. Beverages and tobacco | 1,052 | 0.3 | 1,684 | 0.3 | 2,646 | 0.6 | 2,844 | 0.7 | 1,637 | 0.3 |
| 11. Beverages | 1,052 | 0.3 | 1,684 | 0.3 | 1,428 | 0.3 | 1,362 | 0.3 | 1,245 | 0.3 |
| 12. Tobacco and tobacco manufactures | 1,218 | 0.3 | 1,483 | 0.4 | 392 | 0.1 | ||||
| 2. Crude materials,inedible,except fuels | 3,183 | 1.0 | 6,559 | 1.1 | 3,663 | 0.8 | 3,693 | 0.9 | 4,825 | 1.0 |
| 23. Crude rubber (incl.synthetic) | ||||||||||
| 26. Textile fibres and their wastes | 1,121 | 0.3 | 2,474 | 0.4 | ||||||
| 28. Metalliferous ores and metal scrap | 1,219 | 0.4 | 2,381 | 0.4 | 438 | 0.1 | 277 | 0.1 | 1,690 | 0.3 |
| 29. Crude animal,vegetable materials n.e.s. | 83 | 0.0 | 46 | 0.0 | 90 | 0.0 | 103 | 0.0 | 69 | 0.0 |
| 3. Mineral fuels etc | 597 | 0.2 | 1,241 | 0.2 | 1,152 | 0.3 | 774 | 0.2 | 778 | 0.2 |
| 33. Petroleum and products | 469 | 0.1 | 1,149 | 0.2 | 1,070 | 0.2 | 734 | 0.2 | 742 | 0.2 |
| 34. Gas,natural and manufactured | 92 | 0.0 | 39 | 0.0 | 35 | 0.0 | ||||
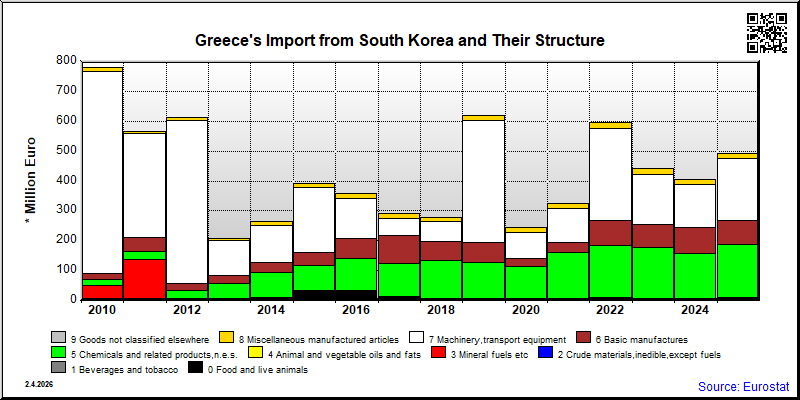
| 5. Chemicals and related products,n.e.s. | 156,956 | 48.3 | 172,992 | 29.1 | 168,223 | 38.1 | 150,189 | 37.0 | 176,714 | 35.9 |
| 51. Organic chemicals | 50,948 | 8.6 | 58,472 | 13.2 | 27,162 | 5.5 | ||||
| 52. Inorganic chemicals | 450 | 0.1 | 4,801 | 0.8 | 317 | 0.1 | 562 | 0.1 | 884 | 0.2 |
| 53. Dyeing,tanning and colouring material | 699 | 0.2 | 598 | 0.1 | 572 | 0.1 | 631 | 0.2 | 465 | 0.1 |
| 54. Medicinal and pharmaceutical products | 3,703 | 1.1 | 5,540 | 0.9 | 6,902 | 1.6 | 9,597 | 2.4 | 10,123 | 2.1 |
| 55. Perfume,cleaning etc.preparations | 1,556 | 0.5 | 3,688 | 0.6 | 4,737 | 1.1 | 7,359 | 1.8 | 11,832 | 2.4 |
| 57. Plastics in primary forms | 69,936 | 21.5 | 98,428 | 16.5 | 84,849 | 19.2 | 83,850 | 20.7 | 113,431 | 23.0 |
| 58. Plastics in non-primary forms | 4,348 | 1.3 | 4,171 | 0.7 | 7,709 | 1.7 | 10,695 | 2.6 | 8,744 | 1.8 |
| 59. Chemical materials and products,n.e.s. | 27,954 | 8.6 | 4,819 | 0.8 | 4,665 | 1.1 | 2,542 | 0.6 | 4,073 | 0.8 |
| 6. Basic manufactures | 31,690 | 9.8 | 85,860 | 14.4 | 79,027 | 17.9 | 87,146 | 21.5 | 79,908 | 16.2 |
| 61. Leather,dressed fur,etc. | 40 | 0.0 | 61 | 0.0 | 44 | 0.0 | 62 | 0.0 | 12 | 0.0 |
| 62. Rubber manufactures,n.e.s. | 4,467 | 1.4 | 7,205 | 1.2 | 5,571 | 1.3 | 5,221 | 1.3 | 5,160 | 1.0 |
| 63. Wood and cork manufactures | 28 | 0.0 | 1 | 0.0 | 8 | 0.0 | 1 | 0.0 | 2 | 0.0 |
| 64. Paper,paperboard and articles thereof | 1,373 | 0.4 | 5,644 | 0.9 | 10,821 | 2.5 | 8,485 | 2.1 | 8,169 | 1.7 |
| 65. Textile yarn,fabrics,made up articles,etc. | 6,455 | 2.0 | 13,689 | 2.3 | 10,593 | 2.4 | 10,303 | 2.5 | 7,468 | 1.5 |
| 66. Non-metallic mineral manufactures,n.e.s. | 604 | 0.2 | 1,100 | 0.2 | 1,161 | 0.3 | 1,080 | 0.3 | 1,045 | 0.2 |
| 67. Iron and steel | 10,864 | 3.3 | 38,970 | 6.6 | 37,264 | 8.4 | 52,855 | 13.0 | 53,982 | 11.0 |
| 68. Non-ferrous metals | 1,573 | 0.5 | 2,768 | 0.5 | 1,991 | 0.5 | 1,233 | 0.3 | 1,911 | 0.4 |
| 69. Manufactures of metals,n.e.s. | 6,286 | 1.9 | 16,421 | 2.8 | 11,571 | 2.6 | 7,905 | 1.9 | 2,158 | 0.4 |
| 7. Machinery,transport equipment | 115,592 | 35.6 | 306,660 | 51.5 | 166,796 | 37.8 | 143,301 | 35.3 | 206,978 | 42.0 |
| 71. Power generating machinery and equipment | 10,158 | 3.1 | 11,330 | 1.9 | 12,725 | 2.9 | 8,082 | 2.0 | 5,400 | 1.1 |
| 72. Machinery for specialized industries | 1,319 | 0.4 | 1,416 | 0.2 | 2,560 | 0.6 | 3,153 | 0.8 | 3,795 | 0.8 |
| 73. Metal working machinery | 1,107 | 0.2 | 1,316 | 0.3 | 2,774 | 0.6 | ||||
| 74. General industrial machinery n.e.s. | 9,260 | 2.9 | 9,576 | 1.6 | 11,701 | 2.7 | 11,047 | 2.7 | 12,655 | 2.6 |
| 75. Office machines and adp machines | 1,739 | 0.5 | 2,364 | 0.4 | 4,123 | 0.9 | 2,878 | 0.7 | 2,860 | 0.6 |
| 76. Telecommunications and sound recording equipment | 6,001 | 1.8 | 21,500 | 3.6 | 11,199 | 2.5 | 4,272 | 1.1 | 3,635 | 0.7 |
| 77. Electric machinery,n.e.s.and parts | 29,588 | 9.1 | 37,718 | 6.3 | 32,125 | 7.3 | 40,287 | 9.9 | 46,410 | 9.4 |
| 78. Road vehicles | 57,195 | 17.6 | 65,178 | 11.0 | 86,677 | 19.6 | 72,175 | 17.8 | 129,448 | 26.3 |
| 79. Other transport equipment | 32 | 0.0 | 156,471 | 26.3 | 5,292 | 1.2 | ||||
| 8. Miscellaneous manufactured articles | 15,371 | 4.7 | 19,512 | 3.3 | 19,296 | 4.4 | 16,405 | 4.0 | 19,005 | 3.9 |
| 81. Prefabr.buildings;sanitary,lighting etc.fixtrs | 2,023 | 0.6 | 2,224 | 0.4 | 2,881 | 0.7 | 1,087 | 0.3 | 2,484 | 0.5 |
| 82. Furniture and parts thereof | 124 | 0.0 | 120 | 0.0 | 157 | 0.0 | 85 | 0.0 | 41 | 0.0 |
| 83. Travel goods,handbags and sim.containers | 32 | 0.0 | 20 | 0.0 | 10 | 0.0 | 42 | 0.0 | 6 | 0.0 |
| 84. Articles of apparel and clothing accessories | 139 | 0.0 | 188 | 0.0 | 278 | 0.1 | 232 | 0.1 | 166 | 0.0 |
| 85. Footwear | 44 | 0.0 | 94 | 0.0 | 40 | 0.0 | 3 | 0.0 | 3 | 0.0 |
| 87. Instruments and apparates n.e.s. | 6,361 | 2.0 | 7,508 | 1.3 | 7,704 | 1.7 | 6,341 | 1.6 | 4,864 | 1.0 |
| 88. Photographic equipment,optical goods etc. | 889 | 0.3 | 1,502 | 0.3 | 1,181 | 0.3 | 747 | 0.2 | 2,890 | 0.6 |
| 89. Miscellaneous manufactured articles,n.e.s. | 5,759 | 1.8 | 7,856 | 1.3 | 7,045 | 1.6 | 7,868 | 1.9 | 8,550 | 1.7 |
| 9. Goods not classified elsewhere | 1 | 0.0 | ||||||||
| 93. Special transactions and commodities not classified | 1 | 0.0 | ||||||||
| In Total | 324,812 | 100.0 | 594,964 | 100.0 | 441,430 | 100.0 | 405,707 | 100.0 | 492,707 | 100.0 |