
| European countries' export and import of goods | SITC |
Data:Eurostat
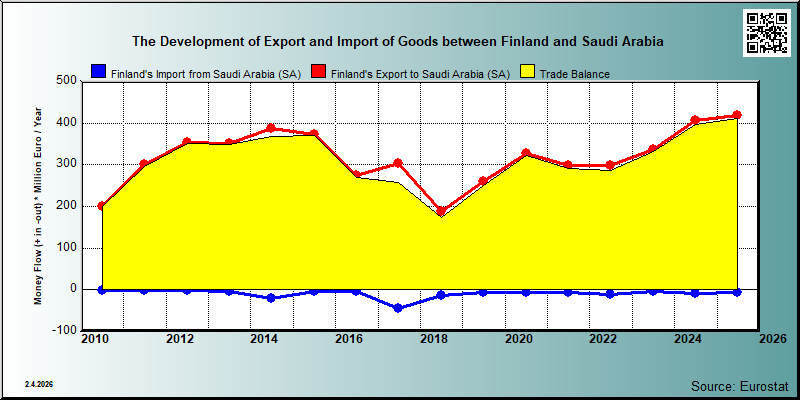

| 2021 | 2022 | 2023 | 2024 | 2025 | ||||||
|---|---|---|---|---|---|---|---|---|---|---|
| 1.000 € | % | 1.000 € | % | 1.000 € | % | 1.000 € | % | 1.000 € | % | |
| 0. Food and live animals | 5,568 | 1.9 | 6,154 | 2.1 | 6,927 | 2.1 | 5,203 | 1.3 | 7,713 | 1.8 |
| 05. Vegetables and fruit | ||||||||||
| 07. Coffee,tea,cocoa,spices | 77 | 0.0 | 3 | 0.0 | 1 | 0.0 | 1 | 0.0 | 2 | 0.0 |
| 2. Crude materials,inedible,except fuels | 111,963 | 37.4 | 117,163 | 39.3 | 82,536 | 24.5 | 89,453 | 22.0 | 115,636 | 27.7 |
| 24. Cork and wood | 85,127 | 21.0 | ||||||||
| 26. Textile fibres and their wastes | 3 | 0.0 | ||||||||
| 27. Crude fertilizers and crude minerals | 1 | 0.0 | 1 | 0.0 | 1 | 0.0 | ||||
| 5. Chemicals and related products,n.e.s. | 16,004 | 5.3 | 15,540 | 5.2 | 17,966 | 5.3 | 22,474 | 5.5 | 18,391 | 4.4 |
| 51. Organic chemicals | 2,053 | 0.7 | 2,438 | 0.8 | 2,060 | 0.6 | 2,567 | 0.6 | 1,758 | 0.4 |
| 52. Inorganic chemicals | 275 | 0.1 | 160 | 0.0 | ||||||
| 54. Medicinal and pharmaceutical products | 4,209 | 1.4 | 2,372 | 0.8 | 4,285 | 1.3 | 7,274 | 1.8 | 6,703 | 1.6 |
| 55. Perfume,cleaning etc.preparations | 155 | 0.1 | 153 | 0.1 | 117 | 0.0 | 132 | 0.0 | 146 | 0.0 |
| 57. Plastics in primary forms | 5,036 | 1.7 | 6,538 | 2.2 | 7,960 | 2.4 | 8,074 | 2.0 | 4,913 | 1.2 |
| 58. Plastics in non-primary forms | 537 | 0.2 | 505 | 0.2 | 629 | 0.2 | 931 | 0.2 | 783 | 0.2 |
| 59. Chemical materials and products,n.e.s. | 3,101 | 1.0 | 3,257 | 1.1 | 2,717 | 0.8 | 3,118 | 0.8 | 3,710 | 0.9 |
| 6. Basic manufactures | 56,925 | 19.0 | 54,154 | 18.2 | 76,608 | 22.7 | 69,810 | 17.2 | 59,443 | 14.2 |
| 62. Rubber manufactures,n.e.s. | 322 | 0.1 | 1,013 | 0.2 | 1,512 | 0.4 | ||||
| 63. Wood and cork manufactures | 318 | 0.1 | 592 | 0.1 | 466 | 0.1 | ||||
| 64. Paper,paperboard and articles thereof | 51,308 | 17.1 | 47,922 | 16.1 | 62,457 | 18.5 | 56,109 | 13.8 | 39,376 | 9.4 |
| 65. Textile yarn,fabrics,made up articles,etc. | 212 | 0.1 | 437 | 0.1 | 79 | 0.0 | 466 | 0.1 | ||
| 66. Non-metallic mineral manufactures,n.e.s. | 742 | 0.2 | 1,029 | 0.3 | 1,332 | 0.4 | 1,685 | 0.4 | 2,988 | 0.7 |
| 67. Iron and steel | 774 | 0.3 | 1,512 | 0.5 | 3,418 | 1.0 | 3,384 | 0.8 | 2,725 | 0.7 |
| 68. Non-ferrous metals | 256 | 0.1 | ||||||||
| 69. Manufactures of metals,n.e.s. | 1,709 | 0.6 | 1,743 | 0.6 | 7,907 | 2.3 | 6,739 | 1.7 | 9,395 | 2.2 |
| 7. Machinery,transport equipment | 93,394 | 31.2 | 91,100 | 30.6 | 137,037 | 40.6 | 199,463 | 49.2 | 189,881 | 45.4 |
| 71. Power generating machinery and equipment | 10,940 | 3.7 | 14,239 | 4.8 | 7,711 | 2.3 | 32,128 | 7.9 | 36,131 | 8.6 |
| 72. Machinery for specialized industries | 30,670 | 10.2 | 16,069 | 5.4 | 39,825 | 11.8 | 60,932 | 15.0 | 44,515 | 10.6 |
| 73. Metal working machinery | 137 | 0.0 | 634 | 0.2 | 4,172 | 1.0 | ||||
| 74. General industrial machinery n.e.s. | 28,024 | 9.4 | 24,552 | 8.2 | 40,430 | 12.0 | 58,053 | 14.3 | 47,654 | 11.4 |
| 75. Office machines and adp machines | 1,802 | 0.6 | 1,514 | 0.5 | 2,231 | 0.7 | 1,611 | 0.4 | 3,651 | 0.9 |
| 76. Telecommunications and sound recording equipment | 1,933 | 0.6 | 11,464 | 3.8 | 5,642 | 1.7 | 7,250 | 1.8 | 5,762 | 1.4 |
| 77. Electric machinery,n.e.s.and parts | 16,338 | 5.5 | 18,972 | 6.4 | 28,201 | 8.4 | 22,990 | 5.7 | 37,332 | 8.9 |
| 78. Road vehicles | 3,069 | 1.0 | 3,605 | 1.2 | 4,858 | 1.4 | 12,866 | 3.2 | 10,000 | 2.4 |
| 79. Other transport equipment | 217 | 0.1 | 297 | 0.1 | 665 | 0.2 | ||||
| 8. Miscellaneous manufactured articles | 13,600 | 4.5 | 13,230 | 4.4 | 15,259 | 4.5 | 18,432 | 4.5 | 25,646 | 6.1 |
| 81. Prefabr.buildings;sanitary,lighting etc.fixtrs | 1,217 | 0.4 | 598 | 0.2 | 308 | 0.1 | 831 | 0.2 | 6,479 | 1.5 |
| 82. Furniture and parts thereof | 937 | 0.3 | 4,319 | 1.0 | ||||||
| 83. Travel goods,handbags and sim.containers | 3 | 0.0 | 5 | 0.0 | 14 | 0.0 | 14 | 0.0 | 8 | 0.0 |
| 84. Articles of apparel and clothing accessories | 88 | 0.0 | 136 | 0.0 | 211 | 0.1 | 346 | 0.1 | 325 | 0.1 |
| 85. Footwear | 5 | 0.0 | 11 | 0.0 | 31 | 0.0 | 74 | 0.0 | 218 | 0.1 |
| 87. Instruments and apparates n.e.s. | 10,948 | 3.7 | 9,960 | 3.3 | 12,871 | 3.8 | 12,362 | 3.0 | 10,544 | 2.5 |
| 88. Photographic equipment,optical goods etc. | 29 | 0.0 | 20 | 0.0 | 17 | 0.0 | 26 | 0.0 | 25 | 0.0 |
| 89. Miscellaneous manufactured articles,n.e.s. | 766 | 0.3 | 1,357 | 0.5 | 869 | 0.3 | 2,899 | 0.7 | 3,727 | 0.9 |
| 9. Goods not classified elsewhere | 19 | 0.0 | ||||||||
| 93. Special transactions and commodities not classified | 19 | 0.0 | ||||||||
| In Total | 299,564 | 100.0 | 298,193 | 100.0 | 337,125 | 100.0 | 405,726 | 100.0 | 418,101 | 100.0 |
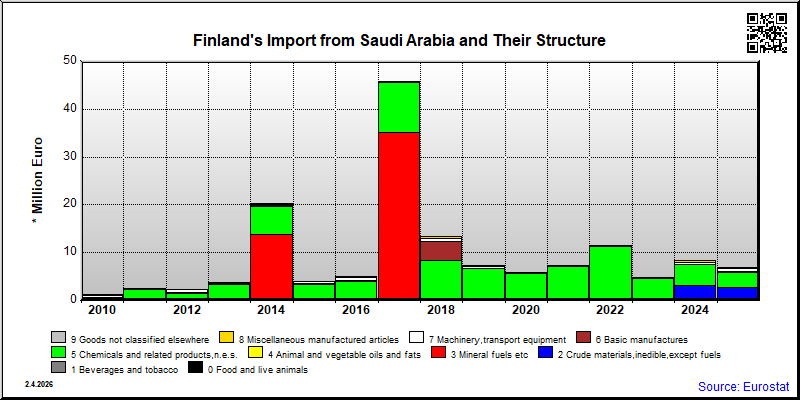
| 2021 | 2022 | 2023 | 2024 | 2025 | ||||||
|---|---|---|---|---|---|---|---|---|---|---|
| 1.000 € | % | 1.000 € | % | 1.000 € | % | 1.000 € | % | 1.000 € | % | |
| 0. Food and live animals | 12 | 0.2 | 2 | 0.0 | 1 | 0.0 | 1 | 0.0 | ||
| 05. Vegetables and fruit | ||||||||||
| 07. Coffee,tea,cocoa,spices | 3 | 0.0 | 1 | 0.0 | ||||||
| 2. Crude materials,inedible,except fuels | 3 | 0.0 | 376 | 7.7 | 3,172 | 37.6 | 2,766 | 40.6 | ||
| 24. Cork and wood | 15 | 0.2 | ||||||||
| 26. Textile fibres and their wastes | 376 | 7.7 | 2,766 | 40.6 | ||||||
| 27. Crude fertilizers and crude minerals | 2 | 0.0 | ||||||||
| 5. Chemicals and related products,n.e.s. | 7,067 | 97.3 | 11,202 | 97.0 | 4,227 | 87.0 | 4,275 | 50.6 | 3,174 | 46.6 |
| 51. Organic chemicals | 1 | 0.0 | 10 | 0.1 | 3 | 0.1 | 14 | 0.2 | 10 | 0.1 |
| 52. Inorganic chemicals | 93 | 1.9 | ||||||||
| 54. Medicinal and pharmaceutical products | 1 | 0.0 | 2 | 0.0 | 6 | 0.1 | ||||
| 55. Perfume,cleaning etc.preparations | 1 | 0.0 | ||||||||
| 57. Plastics in primary forms | 6,730 | 92.7 | 10,433 | 90.3 | 3,604 | 74.2 | 3,903 | 46.2 | 2,792 | 41.0 |
| 58. Plastics in non-primary forms | 336 | 4.6 | 706 | 6.1 | 525 | 10.8 | 355 | 4.2 | 364 | 5.3 |
| 59. Chemical materials and products,n.e.s. | 52 | 0.4 | 1 | 0.0 | 1 | 0.0 | ||||
| 6. Basic manufactures | 2 | 0.0 | 112 | 1.0 | 16 | 0.3 | 18 | 0.2 | 65 | 1.0 |
| 62. Rubber manufactures,n.e.s. | 1 | 0.0 | ||||||||
| 63. Wood and cork manufactures | 2 | 0.0 | ||||||||
| 64. Paper,paperboard and articles thereof | 1 | 0.0 | ||||||||
| 65. Textile yarn,fabrics,made up articles,etc. | 2 | 0.0 | ||||||||
| 66. Non-metallic mineral manufactures,n.e.s. | 5 | 0.1 | 6 | 0.1 | ||||||
| 67. Iron and steel | 1 | 0.0 | 2 | 0.0 | 12 | 0.1 | 34 | 0.5 | ||
| 68. Non-ferrous metals | 107 | 0.9 | ||||||||
| 69. Manufactures of metals,n.e.s. | 3 | 0.0 | 13 | 0.3 | 20 | 0.3 | ||||
| 7. Machinery,transport equipment | 115 | 1.6 | 150 | 1.3 | 140 | 2.9 | 587 | 7.0 | 600 | 8.8 |
| 71. Power generating machinery and equipment | 8 | 0.1 | 1 | 0.0 | 12 | 0.3 | 10 | 0.1 | 2 | 0.0 |
| 72. Machinery for specialized industries | 12 | 0.2 | 1 | 0.0 | 12 | 0.3 | 24 | 0.3 | 5 | 0.1 |
| 73. Metal working machinery | 1 | 0.0 | 5 | 0.0 | 1 | 0.0 | ||||
| 74. General industrial machinery n.e.s. | 10 | 0.1 | 36 | 0.3 | 16 | 0.3 | 52 | 0.6 | 47 | 0.7 |
| 75. Office machines and adp machines | 10 | 0.1 | 20 | 0.2 | 1 | 0.0 | 25 | 0.3 | 54 | 0.8 |
| 76. Telecommunications and sound recording equipment | 25 | 0.3 | 22 | 0.2 | 3 | 0.1 | 45 | 0.5 | 76 | 1.1 |
| 77. Electric machinery,n.e.s.and parts | 48 | 0.7 | 61 | 0.5 | 90 | 1.8 | 427 | 5.1 | 291 | 4.3 |
| 78. Road vehicles | 3 | 0.0 | 3 | 0.0 | 2 | 0.0 | 2 | 0.0 | 122 | 1.8 |
| 79. Other transport equipment | 4 | 0.1 | 2 | 0.0 | 2 | 0.0 | ||||
| 8. Miscellaneous manufactured articles | 58 | 0.8 | 74 | 0.6 | 89 | 1.8 | 378 | 4.5 | 191 | 2.8 |
| 81. Prefabr.buildings;sanitary,lighting etc.fixtrs | 5 | 0.1 | ||||||||
| 82. Furniture and parts thereof | 4 | 0.1 | 4 | 0.1 | ||||||
| 83. Travel goods,handbags and sim.containers | 2 | 0.0 | 1 | 0.0 | 4 | 0.1 | ||||
| 84. Articles of apparel and clothing accessories | 5 | 0.1 | 4 | 0.0 | 7 | 0.1 | 24 | 0.3 | 14 | 0.2 |
| 85. Footwear | 1 | 0.0 | 1 | 0.0 | 2 | 0.0 | 6 | 0.1 | ||
| 87. Instruments and apparates n.e.s. | 41 | 0.6 | 61 | 0.5 | 67 | 1.4 | 341 | 4.0 | 158 | 2.3 |
| 88. Photographic equipment,optical goods etc. | 1 | 0.0 | 5 | 0.0 | 2 | 0.0 | ||||
| 89. Miscellaneous manufactured articles,n.e.s. | 10 | 0.1 | 1 | 0.0 | 5 | 0.1 | 11 | 0.1 | 3 | 0.0 |
| 9. Goods not classified elsewhere | 7 | 0.1 | ||||||||
| 93. Special transactions and commodities not classified | 1 | 0.0 | ||||||||
| In Total | 7,264 | 100.0 | 11,550 | 100.0 | 4,859 | 100.0 | 8,443 | 100.0 | 6,813 | 100.0 |