
| European countries' export and import of goods | SITC |
Data:Eurostat

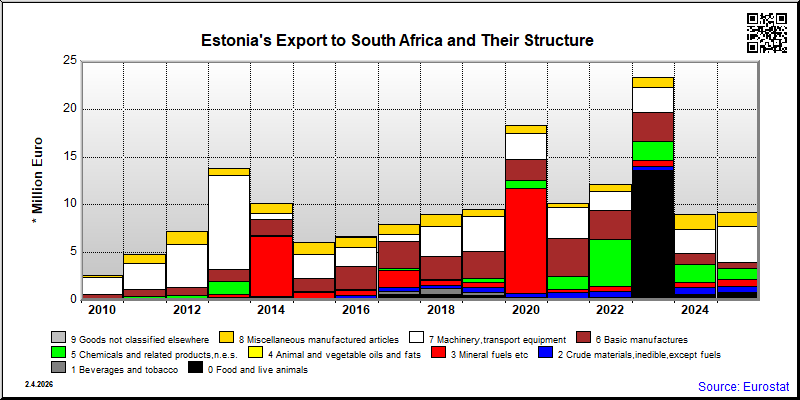
| 2021 | 2022 | 2023 | 2024 | 2025 | ||||||
|---|---|---|---|---|---|---|---|---|---|---|
| 1.000 € | % | 1.000 € | % | 1.000 € | % | 1.000 € | % | 1.000 € | % | |
| 0. Food and live animals | 103 | 1.0 | 275 | 2.3 | 13,611 | 58.3 | 569 | 6.3 | 772 | 8.4 |
| 04. Cereals and cereal preparations | 13,185 | 56.5 | 10 | 0.1 | 9 | 0.1 | ||||
| 05. Vegetables and fruit | 3 | 0.0 | 18 | 0.2 | 6 | 0.0 | 10 | 0.1 | ||
| 07. Coffee,tea,cocoa,spices | 1 | 0.0 | ||||||||
| 09. Miscellaneous edible products and preparations | 101 | 1.0 | 257 | 2.1 | 187 | 0.8 | 523 | 5.8 | 656 | 7.2 |
| 1. Beverages and tobacco | 18 | 0.1 | 53 | 0.6 | 34 | 0.4 | ||||
| 11. Beverages | ||||||||||
| 2. Crude materials,inedible,except fuels | 707 | 6.9 | 707 | 5.8 | 426 | 1.8 | 706 | 7.9 | 676 | 7.4 |
| 26. Textile fibres and their wastes | 14 | 0.2 | ||||||||
| 28. Metalliferous ores and metal scrap | ||||||||||
| 29. Crude animal,vegetable materials n.e.s. | 17 | 0.2 | 17 | 0.1 | 7 | 0.0 | 4 | 0.0 | ||
| 4. Animal and vegetable oils and fats | ||||||||||
| 42. Fixed vegetable fats and oils | ||||||||||
| 5. Chemicals and related products,n.e.s. | 1,406 | 13.8 | 4,953 | 40.8 | 1,925 | 8.2 | 1,813 | 20.2 | 1,181 | 12.9 |
| 51. Organic chemicals | ||||||||||
| 52. Inorganic chemicals | 1,610 | 6.9 | 1,793 | 20.0 | 1,127 | 12.3 | ||||
| 54. Medicinal and pharmaceutical products | ||||||||||
| 55. Perfume,cleaning etc.preparations | 71 | 0.7 | 1 | 0.0 | 5 | 0.0 | 45 | 0.5 | ||
| 58. Plastics in non-primary forms | 8 | 0.1 | ||||||||
| 59. Chemical materials and products,n.e.s. | 126 | 1.2 | 259 | 2.1 | 310 | 1.3 | 8 | 0.1 | ||
| 6. Basic manufactures | 3,911 | 38.4 | 3,082 | 25.4 | 3,045 | 13.0 | 1,208 | 13.5 | 604 | 6.6 |
| 61. Leather,dressed fur,etc. | ||||||||||
| 62. Rubber manufactures,n.e.s. | 51 | 0.5 | 91 | 0.7 | 9 | 0.0 | 3 | 0.0 | 13 | 0.1 |
| 63. Wood and cork manufactures | 256 | 2.5 | 1,042 | 8.6 | 1,084 | 4.6 | ||||
| 64. Paper,paperboard and articles thereof | 78 | 0.8 | 8 | 0.1 | ||||||
| 65. Textile yarn,fabrics,made up articles,etc. | 63 | 0.6 | 70 | 0.6 | 151 | 0.6 | 71 | 0.8 | 73 | 0.8 |
| 66. Non-metallic mineral manufactures,n.e.s. | 1 | 0.0 | 1 | 0.0 | 1 | 0.0 | 2 | 0.0 | ||
| 67. Iron and steel | ||||||||||
| 68. Non-ferrous metals | 1 | 0.0 | 1 | 0.0 | 2 | 0.0 | ||||
| 69. Manufactures of metals,n.e.s. | 3,461 | 34.0 | 1,878 | 15.5 | 1,798 | 7.7 | 565 | 6.3 | 86 | 0.9 |
| 7. Machinery,transport equipment | 3,214 | 31.5 | 1,906 | 15.7 | 2,612 | 11.2 | 2,515 | 28.0 | 3,769 | 41.1 |
| 71. Power generating machinery and equipment | 41 | 0.4 | 36 | 0.3 | 5 | 0.0 | 22 | 0.2 | ||
| 72. Machinery for specialized industries | 2,151 | 21.1 | 593 | 2.5 | ||||||
| 74. General industrial machinery n.e.s. | 223 | 2.2 | 122 | 1.0 | 274 | 1.2 | 190 | 2.1 | 282 | 3.1 |
| 75. Office machines and adp machines | 36 | 0.3 | 59 | 0.3 | 138 | 1.5 | 254 | 2.8 | ||
| 76. Telecommunications and sound recording equipment | 530 | 5.2 | 483 | 4.0 | 996 | 4.3 | 1,332 | 14.9 | 1,391 | 15.2 |
| 77. Electric machinery,n.e.s.and parts | 229 | 2.2 | 226 | 1.9 | 528 | 2.3 | 199 | 2.2 | 295 | 3.2 |
| 78. Road vehicles | 40 | 0.4 | 20 | 0.2 | 114 | 0.5 | 11 | 0.1 | 81 | 0.9 |
| 79. Other transport equipment | 44 | 0.2 | 362 | 4.0 | ||||||
| 8. Miscellaneous manufactured articles | 510 | 5.0 | 767 | 6.3 | 1,084 | 4.6 | 1,500 | 16.7 | 1,462 | 15.9 |
| 81. Prefabr.buildings;sanitary,lighting etc.fixtrs | 130 | 1.1 | ||||||||
| 83. Travel goods,handbags and sim.containers | 5 | 0.0 | 10 | 0.1 | 12 | 0.1 | 12 | 0.1 | 10 | 0.1 |
| 84. Articles of apparel and clothing accessories | 4 | 0.0 | 7 | 0.1 | 33 | 0.1 | 15 | 0.2 | 13 | 0.1 |
| 85. Footwear | 1 | 0.0 | 2 | 0.0 | 1 | 0.0 | 2 | 0.0 | ||
| 87. Instruments and apparates n.e.s. | 190 | 1.9 | 175 | 1.4 | 589 | 2.5 | 1,001 | 11.2 | 984 | 10.7 |
| 88. Photographic equipment,optical goods etc. | 10 | 0.1 | ||||||||
| 89. Miscellaneous manufactured articles,n.e.s. | 278 | 2.7 | 377 | 3.1 | 329 | 1.4 | 335 | 3.7 | 383 | 4.2 |
| 9. Goods not classified elsewhere | 16 | 0.1 | ||||||||
| 97. Gold,non-monetary | ||||||||||
| In Total | 10,194 | 100.0 | 12,136 | 100.0 | 23,350 | 100.0 | 8,967 | 100.0 | 9,173 | 100.0 |

| 2021 | 2022 | 2023 | 2024 | 2025 | ||||||
|---|---|---|---|---|---|---|---|---|---|---|
| 1.000 € | % | 1.000 € | % | 1.000 € | % | 1.000 € | % | 1.000 € | % | |
| 0. Food and live animals | 255 | 1.3 | 162 | 0.5 | 395 | 3.3 | 408 | 1.8 | 403 | 0.5 |
| 04. Cereals and cereal preparations | 226 | 1.9 | 263 | 1.2 | 153 | 0.2 | ||||
| 05. Vegetables and fruit | 38 | 0.1 | 168 | 1.4 | 143 | 0.6 | ||||
| 07. Coffee,tea,cocoa,spices | 1 | 0.0 | 1 | 0.0 | ||||||
| 09. Miscellaneous edible products and preparations | ||||||||||
| 1. Beverages and tobacco | 998 | 8.3 | 911 | 4.1 | 1,200 | 1.4 | ||||
| 11. Beverages | ||||||||||
| 2. Crude materials,inedible,except fuels | 1 | 0.0 | 13 | 0.1 | 212 | 1.0 | 28 | 0.0 | ||
| 26. Textile fibres and their wastes | 145 | 0.7 | ||||||||
| 28. Metalliferous ores and metal scrap | ||||||||||
| 29. Crude animal,vegetable materials n.e.s. | 1 | 0.0 | ||||||||
| 4. Animal and vegetable oils and fats | ||||||||||
| 42. Fixed vegetable fats and oils | ||||||||||
| 5. Chemicals and related products,n.e.s. | 119 | 0.6 | 160 | 0.5 | 93 | 0.8 | 89 | 0.4 | 95 | 0.1 |
| 51. Organic chemicals | ||||||||||
| 52. Inorganic chemicals | 1 | 0.0 | ||||||||
| 54. Medicinal and pharmaceutical products | 3 | 0.0 | ||||||||
| 55. Perfume,cleaning etc.preparations | 82 | 0.4 | 90 | 0.3 | 82 | 0.7 | 82 | 0.1 | ||
| 58. Plastics in non-primary forms | 1 | 0.0 | ||||||||
| 59. Chemical materials and products,n.e.s. | 11 | 0.1 | 19 | 0.1 | 8 | 0.1 | 12 | 0.1 | 12 | 0.0 |
| 6. Basic manufactures | 497 | 2.6 | 117 | 0.3 | 50 | 0.4 | 116 | 0.5 | 60 | 0.1 |
| 61. Leather,dressed fur,etc. | ||||||||||
| 62. Rubber manufactures,n.e.s. | 279 | 1.4 | 4 | 0.0 | 1 | 0.0 | ||||
| 63. Wood and cork manufactures | 3 | 0.0 | ||||||||
| 64. Paper,paperboard and articles thereof | 4 | 0.0 | 4 | 0.0 | 3 | 0.0 | 2 | 0.0 | 3 | 0.0 |
| 65. Textile yarn,fabrics,made up articles,etc. | 132 | 0.7 | 6 | 0.0 | 7 | 0.1 | 28 | 0.1 | 31 | 0.0 |
| 66. Non-metallic mineral manufactures,n.e.s. | 1 | 0.0 | 96 | 0.3 | 32 | 0.3 | 74 | 0.3 | ||
| 67. Iron and steel | 13 | 0.0 | ||||||||
| 68. Non-ferrous metals | 1 | 0.0 | 1 | 0.0 | ||||||
| 69. Manufactures of metals,n.e.s. | 79 | 0.4 | 5 | 0.0 | 6 | 0.0 | 11 | 0.0 | 7 | 0.0 |
| 7. Machinery,transport equipment | 1,207 | 6.2 | 911 | 2.6 | 1,563 | 12.9 | 265 | 1.2 | 892 | 1.0 |
| 71. Power generating machinery and equipment | 1 | 0.0 | 4 | 0.0 | 7 | 0.1 | 1 | 0.0 | ||
| 72. Machinery for specialized industries | 1 | 0.0 | 3 | 0.0 | ||||||
| 74. General industrial machinery n.e.s. | 31 | 0.2 | 138 | 0.4 | 21 | 0.2 | 28 | 0.1 | 4 | 0.0 |
| 75. Office machines and adp machines | 34 | 0.1 | 5 | 0.0 | 2 | 0.0 | 2 | 0.0 | ||
| 76. Telecommunications and sound recording equipment | 195 | 1.0 | 617 | 1.8 | 631 | 5.2 | 3 | 0.0 | 719 | 0.8 |
| 77. Electric machinery,n.e.s.and parts | 41 | 0.2 | 111 | 0.3 | 187 | 1.5 | 130 | 0.6 | 164 | 0.2 |
| 78. Road vehicles | 404 | 2.1 | 5 | 0.0 | 516 | 4.3 | 14 | 0.1 | 1 | 0.0 |
| 79. Other transport equipment | 194 | 1.6 | 86 | 0.4 | ||||||
| 8. Miscellaneous manufactured articles | 1,707 | 8.8 | 223 | 0.6 | 174 | 1.4 | 17,996 | 80.9 | 84,272 | 95.0 |
| 81. Prefabr.buildings;sanitary,lighting etc.fixtrs | 1 | 0.0 | ||||||||
| 83. Travel goods,handbags and sim.containers | 28 | 0.1 | 80 | 0.2 | 32 | 0.3 | 33 | 0.1 | 34 | 0.0 |
| 84. Articles of apparel and clothing accessories | 5 | 0.0 | 8 | 0.0 | 12 | 0.1 | 2 | 0.0 | 1 | 0.0 |
| 85. Footwear | 1 | 0.0 | 2 | 0.0 | 1 | 0.0 | 2 | 0.0 | ||
| 87. Instruments and apparates n.e.s. | 1,660 | 8.5 | 91 | 0.3 | 40 | 0.3 | 137 | 0.6 | 287 | 0.3 |
| 88. Photographic equipment,optical goods etc. | 2 | 0.0 | ||||||||
| 89. Miscellaneous manufactured articles,n.e.s. | 13 | 0.1 | 43 | 0.1 | 88 | 0.7 | 17,822 | 80.1 | 83,944 | 94.6 |
| 9. Goods not classified elsewhere | 8,798 | 72.8 | ||||||||
| 97. Gold,non-monetary | ||||||||||
| In Total | 19,438 | 100.0 | 34,928 | 100.0 | 12,085 | 100.0 | 22,244 | 100.0 | 88,745 | 100.0 |