
| European countries' export and import of goods | SITC |
Data:Eurostat
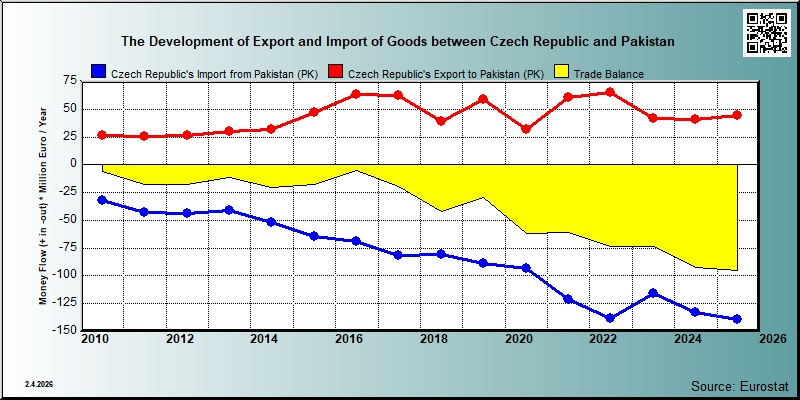

| 2021 | 2022 | 2023 | 2024 | 2025 | ||||||
|---|---|---|---|---|---|---|---|---|---|---|
| 1.000 € | % | 1.000 € | % | 1.000 € | % | 1.000 € | % | 1.000 € | % | |
| 0. Food and live animals | 890 | 1.5 | 678 | 1.0 | 794 | 1.9 | 695 | 1.7 | 643 | 1.5 |
| 04. Cereals and cereal preparations | ||||||||||
| 05. Vegetables and fruit | ||||||||||
| 06. Sugars,sugar preparations and honey | ||||||||||
| 07. Coffee,tea,cocoa,spices | ||||||||||
| 09. Miscellaneous edible products and preparations | 409 | 0.7 | 463 | 0.7 | 475 | 1.1 | 400 | 1.0 | 190 | 0.4 |
| 1. Beverages and tobacco | 1 | 0.0 | 1 | 0.0 | 2 | 0.0 | 19 | 0.0 | 29 | 0.1 |
| 12. Tobacco and tobacco manufactures | ||||||||||
| 2. Crude materials,inedible,except fuels | 24,959 | 41.4 | 21,197 | 32.6 | 23,208 | 55.1 | 18,673 | 46.0 | 12,100 | 27.3 |
| 21. Hides,skins,furskins,raw | ||||||||||
| 22. Oil seeds,oleaginous fruits | 2 | 0.0 | ||||||||
| 24. Cork and wood | 6,046 | 9.3 | 2,300 | 5.5 | 2,669 | 6.6 | 3,294 | 7.4 | ||
| 26. Textile fibres and their wastes | 402 | 0.7 | 550 | 0.8 | 571 | 1.4 | 719 | 1.8 | ||
| 27. Crude fertilizers and crude minerals | 4 | 0.0 | 1 | 0.0 | 4 | 0.0 | ||||
| 29. Crude animal,vegetable materials n.e.s. | 6 | 0.0 | 96 | 0.1 | 135 | 0.3 | 133 | 0.3 | ||
| 4. Animal and vegetable oils and fats | ||||||||||
| 42. Fixed vegetable fats and oils | ||||||||||
| 5. Chemicals and related products,n.e.s. | 3,971 | 6.6 | 3,806 | 5.9 | 3,838 | 9.1 | 4,864 | 12.0 | 5,167 | 11.7 |
| 54. Medicinal and pharmaceutical products | 1,600 | 2.5 | 1,397 | 3.3 | ||||||
| 55. Perfume,cleaning etc.preparations | 54 | 0.1 | 122 | 0.2 | 44 | 0.1 | 264 | 0.6 | 347 | 0.8 |
| 57. Plastics in primary forms | 225 | 0.4 | 85 | 0.1 | 112 | 0.3 | 89 | 0.2 | 636 | 1.4 |
| 58. Plastics in non-primary forms | 203 | 0.3 | 275 | 0.4 | 236 | 0.6 | 142 | 0.3 | 59 | 0.1 |
| 6. Basic manufactures | 2,099 | 3.5 | 1,438 | 2.2 | 2,033 | 4.8 | 2,622 | 6.5 | 4,184 | 9.5 |
| 61. Leather,dressed fur,etc. | ||||||||||
| 62. Rubber manufactures,n.e.s. | 166 | 0.3 | 158 | 0.2 | 78 | 0.2 | 95 | 0.2 | 21 | 0.0 |
| 63. Wood and cork manufactures | 18 | 0.0 | 1 | 0.0 | 2 | 0.0 | 12 | 0.0 | 34 | 0.1 |
| 64. Paper,paperboard and articles thereof | 220 | 0.4 | 167 | 0.3 | 319 | 0.8 | 1,656 | 4.1 | 2,378 | 5.4 |
| 65. Textile yarn,fabrics,made up articles,etc. | 385 | 0.6 | 321 | 0.5 | 353 | 0.8 | 372 | 0.9 | 344 | 0.8 |
| 66. Non-metallic mineral manufactures,n.e.s. | 401 | 0.7 | 373 | 0.6 | 293 | 0.7 | 290 | 0.7 | 522 | 1.2 |
| 67. Iron and steel | 130 | 0.2 | 362 | 0.9 | 4 | 0.0 | 267 | 0.6 | ||
| 68. Non-ferrous metals | 3 | 0.0 | 8 | 0.0 | 2 | 0.0 | 15 | 0.0 | ||
| 69. Manufactures of metals,n.e.s. | 526 | 0.9 | 286 | 0.4 | 618 | 1.5 | 191 | 0.5 | 603 | 1.4 |
| 7. Machinery,transport equipment | 25,493 | 42.3 | 34,518 | 53.1 | 9,444 | 22.4 | 11,868 | 29.2 | 17,483 | 39.5 |
| 71. Power generating machinery and equipment | 265 | 0.4 | 2,480 | 3.8 | 218 | 0.5 | 5,011 | 11.3 | ||
| 72. Machinery for specialized industries | 18,811 | 31.2 | 3,174 | 7.5 | 4,448 | 10.9 | 6,194 | 14.0 | ||
| 74. General industrial machinery n.e.s. | 4,506 | 7.5 | 4,264 | 6.6 | 1,153 | 2.7 | 2,333 | 5.7 | 2,125 | 4.8 |
| 75. Office machines and adp machines | 94 | 0.2 | 333 | 0.5 | 124 | 0.3 | 276 | 0.7 | 203 | 0.5 |
| 76. Telecommunications and sound recording equipment | 819 | 1.4 | 2,173 | 3.3 | 195 | 0.5 | 942 | 2.3 | 827 | 1.9 |
| 77. Electric machinery,n.e.s.and parts | 776 | 1.3 | 4,682 | 7.2 | 4,398 | 10.4 | 3,150 | 7.8 | 2,644 | 6.0 |
| 78. Road vehicles | 76 | 0.1 | 100 | 0.2 | 8 | 0.0 | 146 | 0.4 | 381 | 0.9 |
| 8. Miscellaneous manufactured articles | 2,725 | 4.5 | 3,362 | 5.2 | 2,767 | 6.6 | 1,785 | 4.4 | 4,653 | 10.5 |
| 81. Prefabr.buildings;sanitary,lighting etc.fixtrs | 24 | 0.0 | 56 | 0.1 | 40 | 0.1 | 8 | 0.0 | 1 | 0.0 |
| 82. Furniture and parts thereof | 54 | 0.1 | 76 | 0.1 | 5 | 0.0 | 4 | 0.0 | 134 | 0.3 |
| 83. Travel goods,handbags and sim.containers | 7 | 0.0 | 14 | 0.0 | 15 | 0.0 | 14 | 0.0 | 6 | 0.0 |
| 84. Articles of apparel and clothing accessories | 28 | 0.0 | 1 | 0.0 | 28 | 0.1 | 3 | 0.0 | 52 | 0.1 |
| 85. Footwear | 3 | 0.0 | ||||||||
| 87. Instruments and apparates n.e.s. | 1,807 | 3.0 | 1,729 | 2.7 | 1,365 | 3.2 | 858 | 2.1 | 1,064 | 2.4 |
| 88. Photographic equipment,optical goods etc. | 78 | 0.1 | 60 | 0.1 | 7 | 0.0 | 1 | 0.0 | ||
| 89. Miscellaneous manufactured articles,n.e.s. | 727 | 1.2 | 1,426 | 2.2 | 1,304 | 3.1 | 882 | 2.2 | 3,394 | 7.7 |
| 9. Goods not classified elsewhere | ||||||||||
| In Total | 60,262 | 100.0 | 64,999 | 100.0 | 42,086 | 100.0 | 40,625 | 100.0 | 44,259 | 100.0 |
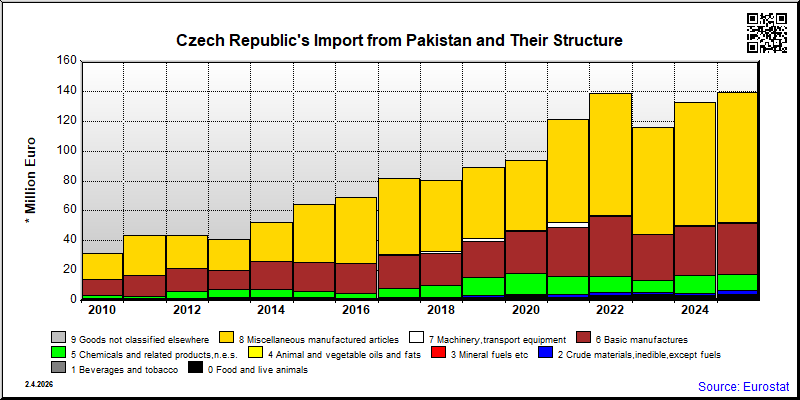
| 2021 | 2022 | 2023 | 2024 | 2025 | ||||||
|---|---|---|---|---|---|---|---|---|---|---|
| 1.000 € | % | 1.000 € | % | 1.000 € | % | 1.000 € | % | 1.000 € | % | |
| 0. Food and live animals | 2,196 | 1.8 | 3,223 | 2.3 | 3,706 | 3.2 | 3,192 | 2.4 | 3,080 | 2.2 |
| 04. Cereals and cereal preparations | ||||||||||
| 05. Vegetables and fruit | ||||||||||
| 06. Sugars,sugar preparations and honey | ||||||||||
| 07. Coffee,tea,cocoa,spices | ||||||||||
| 09. Miscellaneous edible products and preparations | 26 | 0.0 | 11 | 0.0 | 4 | 0.0 | 13 | 0.0 | ||
| 1. Beverages and tobacco | 6 | 0.0 | 422 | 0.3 | 229 | 0.2 | 12 | 0.0 | 880 | 0.6 |
| 12. Tobacco and tobacco manufactures | ||||||||||
| 2. Crude materials,inedible,except fuels | 1,577 | 1.3 | 1,924 | 1.4 | 1,382 | 1.2 | 1,771 | 1.3 | 2,842 | 2.0 |
| 21. Hides,skins,furskins,raw | ||||||||||
| 22. Oil seeds,oleaginous fruits | 178 | 0.2 | ||||||||
| 24. Cork and wood | 33 | 0.0 | 83 | 0.1 | 41 | 0.0 | 46 | 0.0 | ||
| 26. Textile fibres and their wastes | 2 | 0.0 | ||||||||
| 27. Crude fertilizers and crude minerals | 387 | 0.3 | 295 | 0.2 | 339 | 0.3 | 471 | 0.3 | ||
| 29. Crude animal,vegetable materials n.e.s. | 1,183 | 1.0 | 1,594 | 1.1 | 1,156 | 0.9 | 2,087 | 1.5 | ||
| 4. Animal and vegetable oils and fats | ||||||||||
| 42. Fixed vegetable fats and oils | ||||||||||
| 5. Chemicals and related products,n.e.s. | 12,393 | 10.2 | 10,671 | 7.7 | 7,764 | 6.7 | 11,652 | 8.8 | 10,556 | 7.6 |
| 54. Medicinal and pharmaceutical products | 12 | 0.0 | ||||||||
| 55. Perfume,cleaning etc.preparations | 9,146 | 7.5 | 7,338 | 5.3 | 5,720 | 4.9 | 8,664 | 6.5 | 7,287 | 5.2 |
| 57. Plastics in primary forms | 3,245 | 2.7 | 3,269 | 2.4 | 2,042 | 1.8 | 2,987 | 2.2 | 3,251 | 2.3 |
| 58. Plastics in non-primary forms | 2 | 0.0 | 52 | 0.0 | 2 | 0.0 | 1 | 0.0 | 18 | 0.0 |
| 6. Basic manufactures | 32,923 | 27.1 | 40,075 | 28.9 | 30,870 | 26.7 | 33,149 | 25.0 | 34,482 | 24.8 |
| 61. Leather,dressed fur,etc. | 24 | 0.0 | ||||||||
| 62. Rubber manufactures,n.e.s. | 21 | 0.0 | 26 | 0.0 | 7 | 0.0 | 7 | 0.0 | 19 | 0.0 |
| 63. Wood and cork manufactures | 2 | 0.0 | 2 | 0.0 | 1 | 0.0 | 14 | 0.0 | 5 | 0.0 |
| 64. Paper,paperboard and articles thereof | 4 | 0.0 | 1 | 0.0 | 5 | 0.0 | 2 | 0.0 | 3 | 0.0 |
| 65. Textile yarn,fabrics,made up articles,etc. | 31,523 | 26.0 | 38,501 | 27.8 | 29,712 | 25.7 | 31,670 | 23.9 | 33,285 | 23.9 |
| 66. Non-metallic mineral manufactures,n.e.s. | 242 | 0.2 | 233 | 0.2 | 195 | 0.2 | 101 | 0.1 | 137 | 0.1 |
| 67. Iron and steel | 80 | 0.1 | 1 | 0.0 | 436 | 0.3 | 100 | 0.1 | ||
| 68. Non-ferrous metals | 7 | 0.0 | 4 | 0.0 | 5 | 0.0 | ||||
| 69. Manufactures of metals,n.e.s. | 1,108 | 0.9 | 1,147 | 0.8 | 904 | 0.8 | 870 | 0.7 | 849 | 0.6 |
| 7. Machinery,transport equipment | 3,416 | 2.8 | 363 | 0.3 | 216 | 0.2 | 334 | 0.3 | 245 | 0.2 |
| 71. Power generating machinery and equipment | 3,048 | 2.5 | 1 | 0.0 | 1 | 0.0 | ||||
| 72. Machinery for specialized industries | 23 | 0.0 | 11 | 0.0 | 2 | 0.0 | ||||
| 74. General industrial machinery n.e.s. | 51 | 0.0 | 38 | 0.0 | 48 | 0.0 | 56 | 0.0 | 1 | 0.0 |
| 75. Office machines and adp machines | 106 | 0.1 | 7 | 0.0 | 29 | 0.0 | 14 | 0.0 | ||
| 76. Telecommunications and sound recording equipment | 157 | 0.1 | 244 | 0.2 | 1 | 0.0 | 1 | 0.0 | ||
| 77. Electric machinery,n.e.s.and parts | 29 | 0.0 | 73 | 0.1 | 137 | 0.1 | 206 | 0.2 | 227 | 0.2 |
| 78. Road vehicles | 4 | 0.0 | 6 | 0.0 | 12 | 0.0 | 40 | 0.0 | 2 | 0.0 |
| 8. Miscellaneous manufactured articles | 68,640 | 56.6 | 81,946 | 59.1 | 71,465 | 61.8 | 82,671 | 62.3 | 87,111 | 62.6 |
| 81. Prefabr.buildings;sanitary,lighting etc.fixtrs | 13 | 0.0 | 23 | 0.0 | 69 | 0.1 | 17 | 0.0 | 5 | 0.0 |
| 82. Furniture and parts thereof | 92 | 0.1 | 174 | 0.1 | 35 | 0.0 | 57 | 0.0 | 225 | 0.2 |
| 83. Travel goods,handbags and sim.containers | 78 | 0.1 | 130 | 0.1 | 126 | 0.1 | 199 | 0.1 | 434 | 0.3 |
| 84. Articles of apparel and clothing accessories | 55,294 | 45.6 | 69,640 | 50.2 | 58,186 | 50.3 | 68,250 | 51.4 | 70,125 | 50.4 |
| 85. Footwear | 678 | 0.6 | 366 | 0.3 | 739 | 0.5 | ||||
| 87. Instruments and apparates n.e.s. | 10,969 | 9.0 | 8,783 | 6.3 | 10,687 | 9.2 | 9,958 | 7.5 | 12,773 | 9.2 |
| 88. Photographic equipment,optical goods etc. | ||||||||||
| 89. Miscellaneous manufactured articles,n.e.s. | 1,515 | 1.2 | 2,643 | 1.9 | 1,995 | 1.7 | 3,701 | 2.8 | 2,810 | 2.0 |
| 9. Goods not classified elsewhere | ||||||||||
| In Total | 121,326 | 100.0 | 138,625 | 100.0 | 115,641 | 100.0 | 132,782 | 100.0 | 139,194 | 100.0 |