
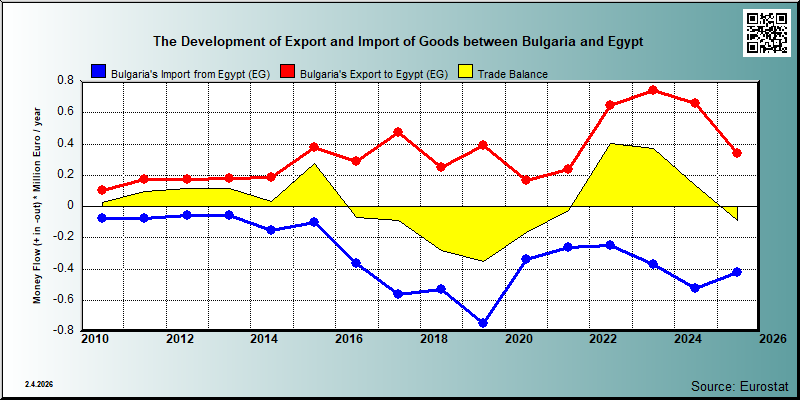
| European countries' export and import of goods | SITC |
Data:Eurostat

| 2021 | 2022 | 2023 | 2024 | 2025 | ||||||
|---|---|---|---|---|---|---|---|---|---|---|
| 1.000 € | % | 1.000 € | % | 1.000 € | % | 1.000 € | % | 1.000 € | % | |
| 0. Food and live animals | 7,292 | 3.1 | 84,548 | 13.1 | 58,008 | 7.8 | 107,745 | 16.3 | 73,630 | 21.8 |
| 04. Cereals and cereal preparations | 2,316 | 1.0 | 79,803 | 12.3 | 54,941 | 7.4 | 103,113 | 15.6 | 64,644 | 19.1 |
| 05. Vegetables and fruit | 1,166 | 0.5 | 856 | 0.1 | 1,120 | 0.2 | 1,124 | 0.2 | 615 | 0.2 |
| 06. Sugars,sugar preparations and honey | 452 | 0.2 | 1,143 | 0.2 | 261 | 0.0 | 752 | 0.2 | ||
| 07. Coffee,tea,cocoa,spices | 674 | 0.3 | 179 | 0.0 | 688 | 0.1 | 568 | 0.1 | 958 | 0.3 |
| 08. Feeding stuff for animals | 1,963 | 0.3 | 38 | 0.0 | 1,946 | 0.3 | 5,293 | 1.6 | ||
| 09. Miscellaneous edible products and preparations | 198 | 0.1 | 435 | 0.1 | 1,062 | 0.1 | 498 | 0.1 | 1,157 | 0.3 |
| 1. Beverages and tobacco | 5,759 | 0.9 | 5,611 | 0.8 | 3,883 | 0.6 | 1,354 | 0.4 | ||
| 11. Beverages | 1 | 0.0 | 12 | 0.0 | ||||||
| 2. Crude materials,inedible,except fuels | 10,031 | 4.2 | 14,220 | 2.2 | 11,429 | 1.5 | 10,450 | 1.6 | 6,672 | 2.0 |
| 22. Oil seeds,oleaginous fruits | 612 | 0.3 | 4,129 | 0.6 | 455 | 0.1 | 296 | 0.0 | 25 | 0.0 |
| 23. Crude rubber (incl.synthetic) | ||||||||||
| 24. Cork and wood | 7 | 0.0 | ||||||||
| 26. Textile fibres and their wastes | 3,463 | 1.5 | 2,786 | 0.4 | 2,615 | 0.4 | 507 | 0.1 | 680 | 0.2 |
| 27. Crude fertilizers and crude minerals | 4,096 | 1.7 | 4,080 | 0.6 | 4,190 | 0.6 | 5,034 | 0.8 | 5,444 | 1.6 |
| 28. Metalliferous ores and metal scrap | ||||||||||
| 29. Crude animal,vegetable materials n.e.s. | 57 | 0.0 | 67 | 0.0 | 225 | 0.0 | 3 | 0.0 | 124 | 0.0 |
| 3. Mineral fuels etc | 61,634 | 25.9 | 408,947 | 63.1 | 510,699 | 68.8 | 380,103 | 57.6 | 107,997 | 31.9 |
| 33. Petroleum and products | 61,634 | 25.9 | 408,947 | 63.1 | 510,699 | 68.8 | 380,103 | 57.6 | 107,997 | 31.9 |
| 34. Gas,natural and manufactured | ||||||||||
| 4. Animal and vegetable oils and fats | 10,945 | 4.6 | 70,641 | 9.5 | 8,181 | 1.2 | 32,621 | 9.6 | ||
| 42. Fixed vegetable fats and oils | 10,945 | 4.6 | 70,641 | 9.5 | 8,181 | 1.2 | 32,621 | 9.6 | ||
| 43. Processed animal or vegetable oils,etc. | ||||||||||
| 5. Chemicals and related products,n.e.s. | 43,033 | 18.1 | 36,170 | 5.6 | 39,331 | 5.3 | 61,249 | 9.3 | 37,038 | 11.0 |
| 51. Organic chemicals | 846 | 0.4 | 727 | 0.1 | 178 | 0.0 | 672 | 0.1 | 738 | 0.2 |
| 52. Inorganic chemicals | 39,596 | 16.6 | 32,564 | 5.0 | 35,432 | 4.8 | 54,194 | 8.2 | 31,326 | 9.3 |
| 53. Dyeing,tanning and colouring material | 2 | 0.0 | 83 | 0.0 | 29 | 0.0 | 4 | 0.0 | 6 | 0.0 |
| 54. Medicinal and pharmaceutical products | 271 | 0.1 | 882 | 0.1 | 641 | 0.1 | 510 | 0.1 | 352 | 0.1 |
| 55. Perfume,cleaning etc.preparations | 257 | 0.1 | 226 | 0.0 | 694 | 0.1 | 817 | 0.1 | 1,384 | 0.4 |
| 56. Fertilizers,manufactured | 231 | 0.1 | 364 | 0.1 | 57 | 0.0 | 198 | 0.0 | 211 | 0.1 |
| 57. Plastics in primary forms | 15 | 0.0 | 18 | 0.0 | 140 | 0.0 | 102 | 0.0 | 285 | 0.1 |
| 58. Plastics in non-primary forms | 658 | 0.3 | 721 | 0.1 | 1,809 | 0.2 | 4,271 | 0.6 | 2,281 | 0.7 |
| 59. Chemical materials and products,n.e.s. | 1,157 | 0.5 | 586 | 0.1 | 351 | 0.0 | 480 | 0.1 | 456 | 0.1 |
| 6. Basic manufactures | 75,862 | 31.8 | 71,734 | 11.1 | 24,406 | 3.3 | 65,755 | 10.0 | 56,845 | 16.8 |
| 62. Rubber manufactures,n.e.s. | 96 | 0.0 | 157 | 0.0 | 130 | 0.0 | 98 | 0.0 | 93 | 0.0 |
| 63. Wood and cork manufactures | 288 | 0.0 | 127 | 0.0 | 174 | 0.0 | 293 | 0.1 | ||
| 64. Paper,paperboard and articles thereof | 1,747 | 0.7 | 3,414 | 0.5 | 2,625 | 0.4 | 3,100 | 0.5 | 4 | 0.0 |
| 65. Textile yarn,fabrics,made up articles,etc. | 348 | 0.1 | 1,808 | 0.3 | 628 | 0.1 | 819 | 0.1 | 486 | 0.1 |
| 66. Non-metallic mineral manufactures,n.e.s. | 3,572 | 1.5 | 1,559 | 0.2 | 732 | 0.1 | 302 | 0.0 | 237 | 0.1 |
| 67. Iron and steel | 2,182 | 0.3 | 44 | 0.0 | 54 | 0.0 | ||||
| 68. Non-ferrous metals | 68,842 | 28.9 | 63,476 | 9.8 | 17,202 | 2.3 | 60,641 | 9.2 | 55,198 | 16.3 |
| 69. Manufactures of metals,n.e.s. | 951 | 0.4 | 1,032 | 0.2 | 780 | 0.1 | 577 | 0.1 | 479 | 0.1 |
| 7. Machinery,transport equipment | 19,016 | 8.0 | 16,761 | 2.6 | 17,993 | 2.4 | 19,512 | 3.0 | 16,435 | 4.9 |
| 71. Power generating machinery and equipment | 1,062 | 0.4 | 435 | 0.1 | 115 | 0.0 | 167 | 0.0 | 210 | 0.1 |
| 72. Machinery for specialized industries | 761 | 0.3 | 1,795 | 0.3 | 2,774 | 0.4 | 1,890 | 0.3 | 559 | 0.2 |
| 74. General industrial machinery n.e.s. | 7,203 | 3.0 | 8,413 | 1.3 | 8,609 | 1.2 | 6,546 | 1.0 | 7,796 | 2.3 |
| 75. Office machines and adp machines | 30 | 0.0 | 293 | 0.0 | 32 | 0.0 | 45 | 0.0 | ||
| 76. Telecommunications and sound recording equipment | 2,084 | 0.9 | 2,232 | 0.3 | 520 | 0.1 | 1,152 | 0.2 | 2,134 | 0.6 |
| 77. Electric machinery,n.e.s.and parts | 3,730 | 1.6 | 2,334 | 0.4 | 2,423 | 0.3 | 2,139 | 0.3 | 2,311 | 0.7 |
| 78. Road vehicles | 2,211 | 0.9 | 469 | 0.1 | 1,463 | 0.2 | 6,278 | 1.0 | 1,972 | 0.6 |
| 79. Other transport equipment | 705 | 0.3 | 420 | 0.1 | 516 | 0.1 | 257 | 0.1 | ||
| 8. Miscellaneous manufactured articles | 7,850 | 3.3 | 9,589 | 1.5 | 4,410 | 0.6 | 3,284 | 0.5 | 5,494 | 1.6 |
| 81. Prefabr.buildings;sanitary,lighting etc.fixtrs | 527 | 0.2 | 71 | 0.0 | 3 | 0.0 | 3 | 0.0 | 8 | 0.0 |
| 82. Furniture and parts thereof | 164 | 0.0 | 14 | 0.0 | 121 | 0.0 | 3 | 0.0 | ||
| 83. Travel goods,handbags and sim.containers | 2 | 0.0 | ||||||||
| 84. Articles of apparel and clothing accessories | 333 | 0.1 | 46 | 0.0 | 229 | 0.0 | 15 | 0.0 | 4 | 0.0 |
| 85. Footwear | ||||||||||
| 87. Instruments and apparates n.e.s. | 1,120 | 0.5 | 1,013 | 0.2 | 785 | 0.1 | 1,083 | 0.2 | 2,662 | 0.8 |
| 88. Photographic equipment,optical goods etc. | 1 | 0.0 | 2 | 0.0 | 2 | 0.0 | ||||
| 89. Miscellaneous manufactured articles,n.e.s. | 5,389 | 2.3 | 8,295 | 1.3 | 3,378 | 0.5 | 2,058 | 0.3 | 2,816 | 0.8 |
| 9. Goods not classified elsewhere | 19 | 0.0 | 4 | 0.0 | ||||||
| In Total | 238,200 | 100.0 | 647,728 | 100.0 | 742,528 | 100.0 | 660,164 | 100.0 | 338,086 | 100.0 |
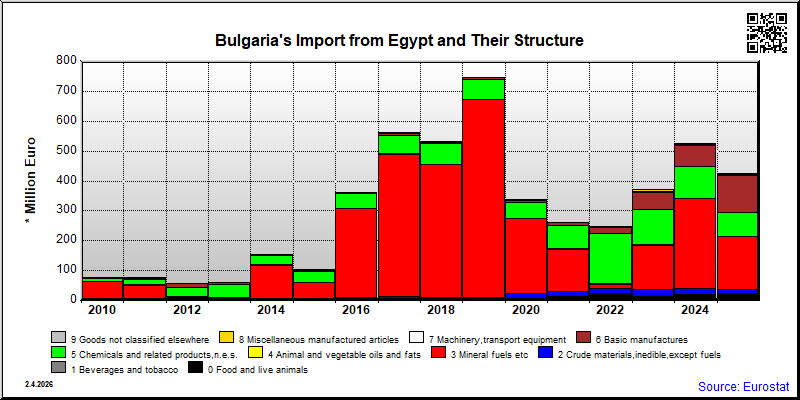
| 2021 | 2022 | 2023 | 2024 | 2025 | ||||||
|---|---|---|---|---|---|---|---|---|---|---|
| 1.000 € | % | 1.000 € | % | 1.000 € | % | 1.000 € | % | 1.000 € | % | |
| 0. Food and live animals | 14,932 | 5.7 | 24,446 | 9.9 | 14,332 | 3.9 | 21,068 | 4.0 | 22,346 | 5.3 |
| 04. Cereals and cereal preparations | 1 | 0.0 | 146 | 0.1 | 34 | 0.0 | 51 | 0.0 | 713 | 0.2 |
| 05. Vegetables and fruit | 5,764 | 2.2 | 9,518 | 3.9 | 10,562 | 2.8 | 15,827 | 3.0 | 15,535 | 3.7 |
| 06. Sugars,sugar preparations and honey | 10 | 0.0 | 678 | 0.3 | 28 | 0.0 | 603 | 0.1 | ||
| 07. Coffee,tea,cocoa,spices | 134 | 0.1 | 155 | 0.1 | 437 | 0.1 | 289 | 0.1 | 350 | 0.1 |
| 08. Feeding stuff for animals | 2 | 0.0 | 139 | 0.0 | ||||||
| 09. Miscellaneous edible products and preparations | 9,023 | 3.4 | 13,948 | 5.6 | 2,990 | 0.8 | 4,873 | 0.9 | 5,145 | 1.2 |
| 1. Beverages and tobacco | 1 | 0.0 | 11 | 0.0 | 48 | 0.0 | ||||
| 11. Beverages | 1 | 0.0 | ||||||||
| 2. Crude materials,inedible,except fuels | 16,427 | 6.3 | 17,012 | 6.9 | 20,935 | 5.6 | 18,615 | 3.5 | 14,896 | 3.5 |
| 22. Oil seeds,oleaginous fruits | 49 | 0.0 | 179 | 0.1 | 344 | 0.1 | 238 | 0.0 | 332 | 0.1 |
| 23. Crude rubber (incl.synthetic) | ||||||||||
| 24. Cork and wood | 1,134 | 0.3 | ||||||||
| 26. Textile fibres and their wastes | 2,300 | 0.9 | 185 | 0.1 | 324 | 0.1 | 835 | 0.2 | 528 | 0.1 |
| 27. Crude fertilizers and crude minerals | 12,743 | 4.9 | 15,228 | 6.2 | 18,303 | 4.9 | 15,947 | 3.0 | 13,786 | 3.2 |
| 28. Metalliferous ores and metal scrap | ||||||||||
| 29. Crude animal,vegetable materials n.e.s. | 1,331 | 0.5 | 567 | 0.2 | 693 | 0.2 | 1,497 | 0.3 | 219 | 0.1 |
| 3. Mineral fuels etc | 140,772 | 53.6 | 13,376 | 5.4 | 148,238 | 39.9 | 301,783 | 57.6 | 177,425 | 41.7 |
| 33. Petroleum and products | 138,392 | 52.7 | 890 | 0.4 | 145,520 | 39.1 | 298,761 | 57.0 | 146,734 | 34.5 |
| 34. Gas,natural and manufactured | ||||||||||
| 4. Animal and vegetable oils and fats | 1,306 | 0.5 | 2,951 | 0.8 | 1,254 | 0.2 | 981 | 0.2 | ||
| 42. Fixed vegetable fats and oils | 1,256 | 0.5 | 2,951 | 0.8 | 1,253 | 0.2 | 981 | 0.2 | ||
| 43. Processed animal or vegetable oils,etc. | ||||||||||
| 5. Chemicals and related products,n.e.s. | 78,518 | 29.9 | 167,957 | 68.0 | 118,058 | 31.7 | 105,427 | 20.1 | 78,870 | 18.5 |
| 51. Organic chemicals | 1 | 0.0 | 4 | 0.0 | 1 | 0.0 | 83 | 0.0 | 483 | 0.1 |
| 52. Inorganic chemicals | 4,342 | 1.7 | 38,810 | 15.7 | 31,425 | 8.5 | 20,880 | 4.0 | 14,630 | 3.4 |
| 53. Dyeing,tanning and colouring material | 301 | 0.1 | 430 | 0.2 | 327 | 0.1 | 538 | 0.1 | 842 | 0.2 |
| 54. Medicinal and pharmaceutical products | 410 | 0.2 | 926 | 0.4 | 2,693 | 0.7 | 3,276 | 0.6 | 2,530 | 0.6 |
| 55. Perfume,cleaning etc.preparations | 24 | 0.0 | 130 | 0.1 | 431 | 0.1 | 316 | 0.1 | 369 | 0.1 |
| 56. Fertilizers,manufactured | 34,369 | 13.1 | 75,889 | 30.7 | 42,502 | 11.4 | 49,563 | 9.5 | 46,647 | 11.0 |
| 57. Plastics in primary forms | 38,218 | 14.5 | 50,309 | 20.4 | 25,420 | 6.8 | 28,358 | 5.4 | 11,663 | 2.7 |
| 58. Plastics in non-primary forms | 815 | 0.3 | 1,018 | 0.4 | 1,505 | 0.4 | 2,177 | 0.4 | 1,320 | 0.3 |
| 59. Chemical materials and products,n.e.s. | 36 | 0.0 | 440 | 0.2 | 13,753 | 3.7 | 236 | 0.0 | 386 | 0.1 |
| 6. Basic manufactures | 8,179 | 3.1 | 20,538 | 8.3 | 57,755 | 15.5 | 72,186 | 13.8 | 123,924 | 29.1 |
| 62. Rubber manufactures,n.e.s. | 281 | 0.1 | 607 | 0.2 | 176 | 0.0 | 895 | 0.2 | 919 | 0.2 |
| 63. Wood and cork manufactures | 1 | 0.0 | 1 | 0.0 | 31 | 0.0 | 31 | 0.0 | ||
| 64. Paper,paperboard and articles thereof | 131 | 0.0 | 284 | 0.1 | 494 | 0.1 | 286 | 0.1 | 665 | 0.2 |
| 65. Textile yarn,fabrics,made up articles,etc. | 856 | 0.3 | 973 | 0.4 | 977 | 0.3 | 1,186 | 0.2 | 1,397 | 0.3 |
| 66. Non-metallic mineral manufactures,n.e.s. | 2,239 | 0.9 | 4,783 | 1.9 | 4,034 | 1.1 | 5,891 | 1.1 | 6,096 | 1.4 |
| 67. Iron and steel | 50,869 | 13.7 | 55,739 | 10.6 | 89,578 | 21.1 | ||||
| 68. Non-ferrous metals | 3,408 | 1.3 | 3,406 | 1.4 | 1,009 | 0.3 | 7,943 | 1.5 | 25,116 | 5.9 |
| 69. Manufactures of metals,n.e.s. | 59 | 0.0 | 232 | 0.1 | 195 | 0.1 | 215 | 0.0 | 123 | 0.0 |
| 7. Machinery,transport equipment | 1,584 | 0.6 | 1,530 | 0.6 | 2,192 | 0.6 | 2,040 | 0.4 | 4,376 | 1.0 |
| 71. Power generating machinery and equipment | 2 | 0.0 | 114 | 0.0 | ||||||
| 72. Machinery for specialized industries | 426 | 0.2 | 174 | 0.1 | 129 | 0.0 | 32 | 0.0 | 55 | 0.0 |
| 74. General industrial machinery n.e.s. | 313 | 0.1 | 160 | 0.1 | 43 | 0.0 | 4 | 0.0 | 22 | 0.0 |
| 75. Office machines and adp machines | 3 | 0.0 | 10 | 0.0 | 18 | 0.0 | ||||
| 76. Telecommunications and sound recording equipment | 1 | 0.0 | 2 | 0.0 | 1 | 0.0 | 3 | 0.0 | 1 | 0.0 |
| 77. Electric machinery,n.e.s.and parts | 820 | 0.3 | 1,052 | 0.4 | 691 | 0.2 | 1,446 | 0.3 | 3,747 | 0.9 |
| 78. Road vehicles | 1 | 0.0 | 260 | 0.1 | 537 | 0.1 | 548 | 0.1 | ||
| 79. Other transport equipment | 21 | 0.0 | 24 | 0.0 | 1,058 | 0.3 | 4 | 0.0 | ||
| 8. Miscellaneous manufactured articles | 963 | 0.4 | 919 | 0.4 | 7,413 | 2.0 | 1,999 | 0.4 | 2,315 | 0.5 |
| 81. Prefabr.buildings;sanitary,lighting etc.fixtrs | 17 | 0.0 | 379 | 0.1 | 343 | 0.1 | 541 | 0.1 | ||
| 82. Furniture and parts thereof | 9 | 0.0 | 168 | 0.0 | 553 | 0.1 | 598 | 0.1 | ||
| 83. Travel goods,handbags and sim.containers | 3 | 0.0 | 1 | 0.0 | 2 | 0.0 | ||||
| 84. Articles of apparel and clothing accessories | 1 | 0.0 | 1 | 0.0 | 13 | 0.0 | 403 | 0.1 | 515 | 0.1 |
| 85. Footwear | ||||||||||
| 87. Instruments and apparates n.e.s. | 3 | 0.0 | 15 | 0.0 | 15 | 0.0 | 50 | 0.0 | 36 | 0.0 |
| 88. Photographic equipment,optical goods etc. | 1 | 0.0 | 2 | 0.0 | ||||||
| 89. Miscellaneous manufactured articles,n.e.s. | 956 | 0.4 | 856 | 0.3 | 6,765 | 1.8 | 648 | 0.1 | 602 | 0.1 |
| 9. Goods not classified elsewhere | 10 | 0.0 | ||||||||
| In Total | 262,690 | 100.0 | 246,921 | 100.0 | 371,876 | 100.0 | 524,381 | 100.0 | 425,181 | 100.0 |