
| European countries' export and import of goods | SITC |
Data:Eurostat

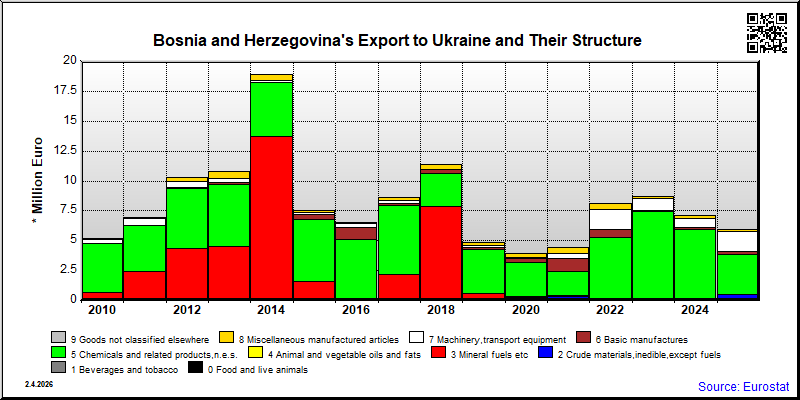
| 2021 | 2022 | 2023 | 2024 | 2025 | ||||||
|---|---|---|---|---|---|---|---|---|---|---|
| 1.000 € | % | 1.000 € | % | 1.000 € | % | 1.000 € | % | 1.000 € | % | |
| 0. Food and live animals | 7 | 0.2 | 5 | 0.1 | 36 | 0.4 | 131 | 1.9 | 108 | 1.8 |
| 02. Dairy products and birds' eggs | ||||||||||
| 03. Fish and fish preparations | ||||||||||
| 04. Cereals and cereal preparations | 5 | 0.1 | ||||||||
| 05. Vegetables and fruit | 7 | 0.2 | ||||||||
| 06. Sugars,sugar preparations and honey | ||||||||||
| 07. Coffee,tea,cocoa,spices | ||||||||||
| 08. Feeding stuff for animals | ||||||||||
| 09. Miscellaneous edible products and preparations | 34 | 0.4 | 131 | 1.8 | 107 | 1.8 | ||||
| 1. Beverages and tobacco | 135 | 3.0 | 90 | 1.1 | ||||||
| 11. Beverages | ||||||||||
| 12. Tobacco and tobacco manufactures | ||||||||||
| 2. Crude materials,inedible,except fuels | 201 | 4.5 | 13 | 0.2 | 6 | 0.1 | 421 | 7.0 | ||
| 22. Oil seeds,oleaginous fruits | ||||||||||
| 24. Cork and wood | 126 | 2.9 | 13 | 0.2 | 421 | 7.0 | ||||
| 25. Pulp and waste paper | ||||||||||
| 26. Textile fibres and their wastes | ||||||||||
| 27. Crude fertilizers and crude minerals | ||||||||||
| 29. Crude animal,vegetable materials n.e.s. | 6 | 0.1 | ||||||||
| 3. Mineral fuels etc | 86 | 1.9 | ||||||||
| 32. Coal,coke and briquettes | ||||||||||
| 33. Petroleum and products | 86 | 1.9 | ||||||||
| 34. Gas,natural and manufactured | ||||||||||
| 4. Animal and vegetable oils and fats | 3 | 0.0 | ||||||||
| 42. Fixed vegetable fats and oils | 3 | 0.0 | ||||||||
| 43. Processed animal or vegetable oils,etc. | ||||||||||
| 5. Chemicals and related products,n.e.s. | 1,991 | 45.0 | 5,137 | 63.0 | 7,360 | 84.3 | 5,781 | 81.6 | 3,321 | 55.6 |
| 51. Organic chemicals | 1 | 0.0 | ||||||||
| 52. Inorganic chemicals | 153 | 3.5 | 4,860 | 59.6 | 5,687 | 65.1 | 3,720 | 52.5 | 2,057 | 34.4 |
| 53. Dyeing,tanning and colouring material | ||||||||||
| 54. Medicinal and pharmaceutical products | 1,549 | 35.0 | 190 | 2.3 | 1,288 | 14.7 | 1,278 | 18.0 | 883 | 14.8 |
| 55. Perfume,cleaning etc.preparations | 248 | 5.6 | 58 | 0.7 | 188 | 2.2 | 283 | 4.0 | 92 | 1.5 |
| 57. Plastics in primary forms | ||||||||||
| 58. Plastics in non-primary forms | 4 | 0.1 | ||||||||
| 59. Chemical materials and products,n.e.s. | 41 | 0.9 | 28 | 0.3 | 197 | 2.3 | 499 | 7.0 | 285 | 4.8 |
| 6. Basic manufactures | 1,100 | 24.9 | 664 | 8.1 | 112 | 1.3 | 178 | 2.5 | 222 | 3.7 |
| 61. Leather,dressed fur,etc. | ||||||||||
| 62. Rubber manufactures,n.e.s. | 10 | 0.2 | ||||||||
| 63. Wood and cork manufactures | 22 | 0.5 | 37 | 0.4 | 13 | 0.1 | 4 | 0.1 | 11 | 0.2 |
| 64. Paper,paperboard and articles thereof | 118 | 2.7 | 29 | 0.4 | 23 | 0.3 | 111 | 1.6 | 106 | 1.8 |
| 65. Textile yarn,fabrics,made up articles,etc. | 48 | 0.6 | ||||||||
| 66. Non-metallic mineral manufactures,n.e.s. | ||||||||||
| 67. Iron and steel | 4 | 0.1 | ||||||||
| 68. Non-ferrous metals | ||||||||||
| 69. Manufactures of metals,n.e.s. | 960 | 21.7 | 550 | 6.7 | 76 | 0.9 | 64 | 0.9 | 90 | 1.5 |
| 7. Machinery,transport equipment | 389 | 8.8 | 1,744 | 21.4 | 1,031 | 11.8 | 735 | 10.4 | 1,741 | 29.2 |
| 71. Power generating machinery and equipment | 63 | 0.8 | 21 | 0.2 | 1 | 0.0 | ||||
| 72. Machinery for specialized industries | 33 | 0.7 | 28 | 0.3 | 80 | 0.9 | 50 | 0.7 | 25 | 0.4 |
| 73. Metal working machinery | 4 | 0.1 | ||||||||
| 74. General industrial machinery n.e.s. | 304 | 6.9 | 1,008 | 12.4 | 739 | 8.5 | 634 | 8.9 | 1,717 | 28.7 |
| 75. Office machines and adp machines | 5 | 0.1 | 1 | 0.0 | ||||||
| 76. Telecommunications and sound recording equipment | ||||||||||
| 77. Electric machinery,n.e.s.and parts | 2 | 0.0 | 6 | 0.1 | ||||||
| 78. Road vehicles | 52 | 1.2 | 639 | 7.8 | 191 | 2.2 | 41 | 0.6 | ||
| 79. Other transport equipment | ||||||||||
| 8. Miscellaneous manufactured articles | 515 | 11.6 | 498 | 6.1 | 181 | 2.1 | 256 | 3.6 | 160 | 2.7 |
| 81. Prefabr.buildings;sanitary,lighting etc.fixtrs | 87 | 2.0 | 240 | 2.9 | 41 | 0.5 | 122 | 1.7 | 122 | 2.0 |
| 82. Furniture and parts thereof | 23 | 0.5 | 7 | 0.1 | 4 | 0.1 | 3 | 0.1 | ||
| 83. Travel goods,handbags and sim.containers | 6 | 0.1 | ||||||||
| 84. Articles of apparel and clothing accessories | 244 | 5.5 | 131 | 1.6 | ||||||
| 85. Footwear | 16 | 0.4 | 42 | 0.5 | ||||||
| 87. Instruments and apparates n.e.s. | 3 | 0.0 | 10 | 0.1 | ||||||
| 88. Photographic equipment,optical goods etc. | ||||||||||
| 89. Miscellaneous manufactured articles,n.e.s. | 139 | 3.1 | 124 | 1.5 | 91 | 1.0 | 119 | 1.7 | 34 | 0.6 |
| 9. Goods not classified elsewhere | ||||||||||
| 93. Special transactions and commodities not classified | ||||||||||
| In Total | 4,424 | 100.0 | 8,153 | 100.0 | 8,736 | 100.0 | 7,082 | 100.0 | 5,973 | 100.0 |
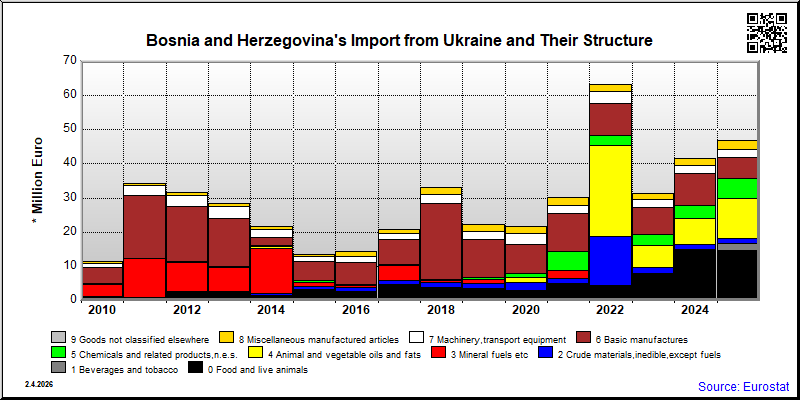
| 2021 | 2022 | 2023 | 2024 | 2025 | ||||||
|---|---|---|---|---|---|---|---|---|---|---|
| 1.000 € | % | 1.000 € | % | 1.000 € | % | 1.000 € | % | 1.000 € | % | |
| 0. Food and live animals | 5,009 | 16.6 | 4,504 | 7.1 | 7,766 | 24.8 | 14,913 | 35.9 | 14,521 | 30.9 |
| 02. Dairy products and birds' eggs | ||||||||||
| 03. Fish and fish preparations | ||||||||||
| 04. Cereals and cereal preparations | 199 | 0.3 | ||||||||
| 05. Vegetables and fruit | 4,206 | 13.9 | ||||||||
| 06. Sugars,sugar preparations and honey | ||||||||||
| 07. Coffee,tea,cocoa,spices | ||||||||||
| 08. Feeding stuff for animals | ||||||||||
| 09. Miscellaneous edible products and preparations | 67 | 0.2 | 208 | 0.5 | 569 | 1.2 | ||||
| 1. Beverages and tobacco | 3 | 0.0 | 1 | 0.0 | ||||||
| 11. Beverages | ||||||||||
| 12. Tobacco and tobacco manufactures | ||||||||||
| 2. Crude materials,inedible,except fuels | 1,291 | 4.3 | 14,227 | 22.4 | 1,842 | 5.9 | 1,597 | 3.8 | 1,416 | 3.0 |
| 22. Oil seeds,oleaginous fruits | ||||||||||
| 24. Cork and wood | 1,251 | 4.1 | 1,640 | 2.6 | 687 | 1.5 | ||||
| 25. Pulp and waste paper | ||||||||||
| 26. Textile fibres and their wastes | ||||||||||
| 27. Crude fertilizers and crude minerals | ||||||||||
| 29. Crude animal,vegetable materials n.e.s. | 19 | 0.1 | ||||||||
| 3. Mineral fuels etc | 2,467 | 8.2 | ||||||||
| 32. Coal,coke and briquettes | ||||||||||
| 33. Petroleum and products | 23 | 0.1 | ||||||||
| 34. Gas,natural and manufactured | ||||||||||
| 4. Animal and vegetable oils and fats | 26,682 | 42.1 | ||||||||
| 42. Fixed vegetable fats and oils | 26,682 | 42.1 | ||||||||
| 43. Processed animal or vegetable oils,etc. | ||||||||||
| 5. Chemicals and related products,n.e.s. | 5,544 | 18.3 | 2,787 | 4.4 | 3,231 | 10.3 | 3,796 | 9.1 | 5,869 | 12.5 |
| 51. Organic chemicals | 40 | 0.1 | 14 | 0.0 | ||||||
| 52. Inorganic chemicals | 19 | 0.1 | 4 | 0.0 | 9 | 0.0 | 67 | 0.2 | 82 | 0.2 |
| 53. Dyeing,tanning and colouring material | ||||||||||
| 54. Medicinal and pharmaceutical products | 1,718 | 5.7 | 2,275 | 3.6 | 3,018 | 9.6 | 3,513 | 8.5 | 5,405 | 11.5 |
| 55. Perfume,cleaning etc.preparations | 89 | 0.3 | 160 | 0.3 | 94 | 0.3 | 158 | 0.4 | 234 | 0.5 |
| 57. Plastics in primary forms | ||||||||||
| 58. Plastics in non-primary forms | 26 | 0.1 | ||||||||
| 59. Chemical materials and products,n.e.s. | 34 | 0.1 | 18 | 0.0 | 27 | 0.1 | 4 | 0.0 | 37 | 0.1 |
| 6. Basic manufactures | 11,046 | 36.5 | 9,338 | 14.7 | 7,944 | 25.4 | 9,303 | 22.4 | 6,121 | 13.0 |
| 61. Leather,dressed fur,etc. | ||||||||||
| 62. Rubber manufactures,n.e.s. | 3 | 0.0 | ||||||||
| 63. Wood and cork manufactures | 3,569 | 11.8 | 3,180 | 5.0 | 3,094 | 9.9 | 1,964 | 4.7 | 1,827 | 3.9 |
| 64. Paper,paperboard and articles thereof | 724 | 2.4 | 437 | 0.7 | 883 | 2.8 | 1,066 | 2.6 | 1,102 | 2.3 |
| 65. Textile yarn,fabrics,made up articles,etc. | 78 | 0.1 | ||||||||
| 66. Non-metallic mineral manufactures,n.e.s. | 403 | 1.3 | ||||||||
| 67. Iron and steel | 1,515 | 3.2 | ||||||||
| 68. Non-ferrous metals | ||||||||||
| 69. Manufactures of metals,n.e.s. | 576 | 1.9 | 500 | 0.8 | 305 | 1.0 | 239 | 0.6 | 484 | 1.0 |
| 7. Machinery,transport equipment | 2,415 | 8.0 | 3,708 | 5.8 | 2,230 | 7.1 | 2,347 | 5.6 | 2,332 | 5.0 |
| 71. Power generating machinery and equipment | 113 | 0.2 | 99 | 0.3 | 178 | 0.4 | 179 | 0.4 | ||
| 72. Machinery for specialized industries | 118 | 0.4 | 147 | 0.2 | 89 | 0.3 | 44 | 0.1 | 3 | 0.0 |
| 73. Metal working machinery | ||||||||||
| 74. General industrial machinery n.e.s. | 1,120 | 3.7 | 2,353 | 3.7 | 1,174 | 3.8 | 907 | 2.2 | 725 | 1.5 |
| 75. Office machines and adp machines | 75 | 0.1 | 4 | 0.0 | ||||||
| 76. Telecommunications and sound recording equipment | ||||||||||
| 77. Electric machinery,n.e.s.and parts | 644 | 1.0 | 506 | 1.2 | ||||||
| 78. Road vehicles | 18 | 0.1 | 3 | 0.0 | 19 | 0.1 | 129 | 0.3 | ||
| 79. Other transport equipment | ||||||||||
| 8. Miscellaneous manufactured articles | 2,423 | 8.0 | 2,108 | 3.3 | 1,710 | 5.5 | 2,006 | 4.8 | 2,799 | 6.0 |
| 81. Prefabr.buildings;sanitary,lighting etc.fixtrs | 201 | 0.7 | 250 | 0.4 | 383 | 1.2 | 437 | 1.1 | 611 | 1.3 |
| 82. Furniture and parts thereof | 1,308 | 4.3 | 904 | 1.4 | 636 | 2.0 | 925 | 2.2 | 1,392 | 3.0 |
| 83. Travel goods,handbags and sim.containers | 2 | 0.0 | 1 | 0.0 | ||||||
| 84. Articles of apparel and clothing accessories | 399 | 1.3 | 332 | 0.5 | 322 | 0.8 | ||||
| 85. Footwear | 117 | 0.4 | 80 | 0.1 | 76 | 0.2 | ||||
| 87. Instruments and apparates n.e.s. | 20 | 0.1 | 4 | 0.0 | 21 | 0.1 | 19 | 0.0 | ||
| 88. Photographic equipment,optical goods etc. | ||||||||||
| 89. Miscellaneous manufactured articles,n.e.s. | 377 | 1.2 | 538 | 0.8 | 362 | 1.2 | 232 | 0.6 | 324 | 0.7 |
| 9. Goods not classified elsewhere | ||||||||||
| 93. Special transactions and commodities not classified | ||||||||||
| In Total | 30,255 | 100.0 | 63,397 | 100.0 | 31,303 | 100.0 | 41,537 | 100.0 | 46,970 | 100.0 |