
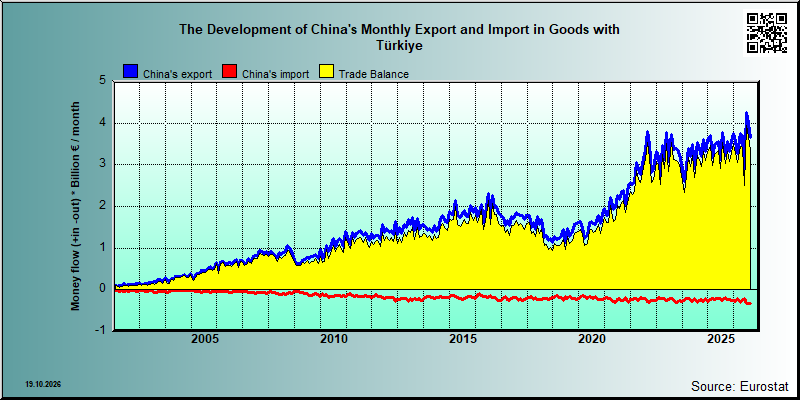
| China's value of trade in goods with different European countries |
Data:Eurostat
| 2021 | 2022 | 2023 | 2024 | 2025 | ||||||
|---|---|---|---|---|---|---|---|---|---|---|
| 1.000 € | % | 1.000 € | % | 1.000 € | % | 1.000 € | % | 1.000 € | % | |
| 0. Food and live animals | 98,131 | 0.4 | 139,376 | 0.4 | 164,888 | 0.4 | 167,522 | 0.4 | 313,316 | 0.8 |
| 02. Dairy products and birds' eggs | 21 | 0.0 | ||||||||
| 03. Fish and fish preparations | 8,869 | 0.0 | 14,140 | 0.0 | 8,936 | 0.0 | 14,774 | 0.0 | 9,571 | 0.0 |
| 04. Cereals and cereal preparations | 21,887 | 0.1 | 23,334 | 0.1 | 63,748 | 0.2 | 2,140 | 0.0 | 9,238 | 0.0 |
| 05. Vegetables and fruit | 34,859 | 0.1 | 46,191 | 0.1 | 37,256 | 0.1 | 77,761 | 0.2 | 205,327 | 0.5 |
| 06. Sugars,sugar preparations and honey | 5,170 | 0.0 | 11,479 | 0.0 | 9,074 | 0.0 | 6,493 | 0.0 | 9,557 | 0.0 |
| 07. Coffee,tea,cocoa,spices | 7,668 | 0.0 | 7,800 | 0.0 | 9,653 | 0.0 | 15,033 | 0.0 | 22,578 | 0.1 |
| 08. Feeding stuff for animals | 13,236 | 0.1 | 23,446 | 0.1 | 20,540 | 0.1 | 32,337 | 0.1 | 36,536 | 0.1 |
| 09. Miscellaneous edible products and preparations | 6,439 | 0.0 | 12,986 | 0.0 | 15,661 | 0.0 | 18,984 | 0.0 | 20,498 | 0.0 |
| 1. Beverages and tobacco | 12,710 | 0.0 | 23,694 | 0.1 | 23,576 | 0.1 | 10,008 | 0.0 | 23,437 | 0.1 |
| 11. Beverages | 11 | 0.0 | 15 | 0.0 | 26 | 0.0 | 13 | 0.0 | 4,937 | 0.0 |
| 12. Tobacco and tobacco manufactures | 12,699 | 0.0 | 23,679 | 0.1 | 23,550 | 0.1 | 9,995 | 0.0 | 18,500 | 0.0 |
| 2. Crude materials,inedible,except fuels | 350,023 | 1.3 | 610,767 | 1.7 | 447,484 | 1.1 | 459,641 | 1.2 | 418,973 | 1.0 |
| 21. Hides,skins,furskins,raw | 41 | 0.0 | 2 | 0.0 | 8 | 0.0 | ||||
| 22. Oil seeds,oleaginous fruits | 49,592 | 0.2 | 8,544 | 0.0 | 40,504 | 0.1 | 35,012 | 0.1 | 15,800 | 0.0 |
| 23. Crude rubber (incl.synthetic) | 40,746 | 0.2 | 67,927 | 0.2 | 60,831 | 0.2 | 58,999 | 0.2 | 63,032 | 0.2 |
| 24. Cork and wood | 2,043 | 0.0 | 5,049 | 0.0 | 4,644 | 0.0 | 5,653 | 0.0 | 6,424 | 0.0 |
| 25. Pulp and waste paper | 2,585 | 0.0 | 1,120 | 0.0 | 2,174 | 0.0 | 3,494 | 0.0 | 2,184 | 0.0 |
| 26. Textile fibres and their wastes | 173,732 | 0.7 | 386,788 | 1.1 | 245,945 | 0.6 | 241,014 | 0.6 | 215,339 | 0.5 |
| 27. Crude fertilizers and crude minerals | 39,874 | 0.2 | 77,900 | 0.2 | 47,663 | 0.1 | 43,628 | 0.1 | 53,592 | 0.1 |
| 28. Metalliferous ores and metal scrap | 15,307 | 0.1 | 37,340 | 0.1 | 19,841 | 0.1 | 40,271 | 0.1 | 27,635 | 0.1 |
| 29. Crude animal,vegetable materials n.e.s. | 26,103 | 0.1 | 26,097 | 0.1 | 25,881 | 0.1 | 31,570 | 0.1 | 34,958 | 0.1 |
| 3. Mineral fuels etc | 62,339 | 0.2 | 115,753 | 0.3 | 20,085 | 0.1 | 6,755 | 0.0 | 12,208 | 0.0 |
| 33. Petroleum and products | 1,782 | 0.0 | 5,649 | 0.0 | 6,441 | 0.0 | 6,674 | 0.0 | 11,254 | 0.0 |
| 34. Gas,natural and manufactured | 69 | 0.0 | 225 | 0.0 | 131 | 0.0 | 81 | 0.0 | 954 | 0.0 |
| 4. Animal and vegetable oils and fats | 1,212 | 0.0 | 1,420 | 0.0 | 3,823 | 0.0 | 2,884 | 0.0 | 5,738 | 0.0 |
| 41. Animal oils and fats | 549 | 0.0 | 589 | 0.0 | 698 | 0.0 | 856 | 0.0 | 3,257 | 0.0 |
| 42. Fixed vegetable fats and oils | 101 | 0.0 | 86 | 0.0 | 81 | 0.0 | 196 | 0.0 | 156 | 0.0 |
| 43. Processed animal or vegetable oils,etc. | 562 | 0.0 | 744 | 0.0 | 3,045 | 0.0 | 1,831 | 0.0 | 2,325 | 0.0 |
| 5. Chemicals and related products,n.e.s. | 4,564,166 | 17.5 | 6,715,734 | 18.3 | 5,082,209 | 12.9 | 5,030,201 | 12.8 | 5,094,801 | 12.2 |
| 51. Organic chemicals | 1,614,789 | 6.2 | 2,776,720 | 7.6 | 1,914,304 | 4.8 | 1,953,463 | 5.0 | 1,754,172 | 4.2 |
| 52. Inorganic chemicals | 180,346 | 0.7 | 421,265 | 1.1 | 290,426 | 0.7 | 240,565 | 0.6 | 304,867 | 0.7 |
| 53. Dyeing,tanning and colouring material | 394,796 | 1.5 | 516,933 | 1.4 | 421,599 | 1.1 | 423,207 | 1.1 | 431,078 | 1.0 |
| 54. Medicinal and pharmaceutical products | 913,190 | 3.5 | 362,842 | 1.0 | 330,657 | 0.8 | 303,795 | 0.8 | 313,328 | 0.8 |
| 55. Perfume,cleaning etc.preparations | 37,211 | 0.1 | 54,444 | 0.1 | 68,515 | 0.2 | 86,008 | 0.2 | 100,935 | 0.2 |
| 56. Fertilizers,manufactured | 107,086 | 0.4 | 313,811 | 0.9 | 183,890 | 0.5 | 148,534 | 0.4 | 244,039 | 0.6 |
| 57. Plastics in primary forms | 762,082 | 2.9 | 1,414,055 | 3.9 | 966,272 | 2.4 | 944,278 | 2.4 | 982,401 | 2.4 |
| 58. Plastics in non-primary forms | 247,996 | 1.0 | 401,107 | 1.1 | 427,145 | 1.1 | 366,259 | 0.9 | 356,933 | 0.9 |
| 59. Chemical materials and products,n.e.s. | 306,670 | 1.2 | 454,557 | 1.2 | 478,193 | 1.2 | 545,977 | 1.4 | 607,048 | 1.5 |
| 6. Basic manufactures | 4,523,659 | 17.4 | 8,551,872 | 23.3 | 7,649,509 | 19.4 | 7,378,498 | 18.8 | 7,404,618 | 17.7 |
| 61. Leather,dressed fur,etc. | 4,267 | 0.0 | 5,118 | 0.0 | 6,862 | 0.0 | 5,183 | 0.0 | 4,925 | 0.0 |
| 62. Rubber manufactures,n.e.s. | 95,932 | 0.4 | 137,929 | 0.4 | 149,432 | 0.4 | 159,735 | 0.4 | 162,549 | 0.4 |
| 63. Wood and cork manufactures | 23,262 | 0.1 | 37,324 | 0.1 | 44,358 | 0.1 | 54,693 | 0.1 | 75,749 | 0.2 |
| 64. Paper,paperboard and articles thereof | 197,878 | 0.8 | 631,343 | 1.7 | 455,077 | 1.2 | 440,319 | 1.1 | 466,028 | 1.1 |
| 65. Textile yarn,fabrics,made up articles,etc. | 1,339,303 | 5.1 | 1,998,247 | 5.4 | 1,661,545 | 4.2 | 1,454,028 | 3.7 | 1,396,147 | 3.3 |
| 66. Non-metallic mineral manufactures,n.e.s. | 341,603 | 1.3 | 542,182 | 1.5 | 552,008 | 1.4 | 561,310 | 1.4 | 582,011 | 1.4 |
| 67. Iron and steel | 1,714,953 | 6.6 | 3,477,030 | 9.5 | 3,362,729 | 8.5 | 3,177,144 | 8.1 | 2,993,951 | 7.2 |
| 68. Non-ferrous metals | 274,272 | 1.1 | 877,420 | 2.4 | 566,128 | 1.4 | 584,067 | 1.5 | 746,194 | 1.8 |
| 69. Manufactures of metals,n.e.s. | 532,188 | 2.0 | 845,280 | 2.3 | 851,372 | 2.2 | 942,020 | 2.4 | 977,065 | 2.3 |
| 7. Machinery,transport equipment | 14,389,520 | 55.3 | 17,272,482 | 47.1 | 22,078,556 | 55.9 | 21,384,680 | 54.6 | 23,116,060 | 55.4 |
| 71. Power generating machinery and equipment | 951,829 | 3.7 | 1,012,381 | 2.8 | 1,247,031 | 3.2 | 1,327,713 | 3.4 | 1,294,579 | 3.1 |
| 72. Machinery for specialized industries | 1,446,422 | 5.6 | 2,016,821 | 5.5 | 2,357,664 | 6.0 | 1,999,296 | 5.1 | 2,294,104 | 5.5 |
| 73. Metal working machinery | 238,568 | 0.9 | 626,372 | 1.7 | 607,448 | 1.5 | 510,456 | 1.3 | 524,094 | 1.3 |
| 74. General industrial machinery n.e.s. | 2,265,909 | 8.7 | 2,885,159 | 7.9 | 3,244,064 | 8.2 | 3,424,788 | 8.7 | 3,920,601 | 9.4 |
| 75. Office machines and adp machines | 1,995,120 | 7.7 | 2,297,779 | 6.3 | 2,767,132 | 7.0 | 2,196,051 | 5.6 | 2,515,539 | 6.0 |
| 76. Telecommunications and sound recording equipment | 3,229,852 | 12.4 | 3,009,138 | 8.2 | 3,726,442 | 9.4 | 3,921,852 | 10.0 | 4,285,360 | 10.3 |
| 77. Electric machinery,n.e.s.and parts | 3,475,593 | 13.4 | 4,156,145 | 11.3 | 5,724,343 | 14.5 | 5,056,860 | 12.9 | 5,349,975 | 12.8 |
| 78. Road vehicles | 722,844 | 2.8 | 1,023,123 | 2.8 | 2,165,565 | 5.5 | 2,726,141 | 7.0 | 2,720,280 | 6.5 |
| 79. Other transport equipment | 63,384 | 0.2 | 245,564 | 0.7 | 238,848 | 0.6 | 220,471 | 0.6 | 211,050 | 0.5 |
| 8. Miscellaneous manufactured articles | 1,984,795 | 7.6 | 3,220,371 | 8.8 | 4,009,047 | 10.2 | 4,735,031 | 12.1 | 5,334,860 | 12.8 |
| 81. Prefabr.buildings;sanitary,lighting etc.fixtrs | 120,242 | 0.5 | 131,477 | 0.4 | 162,168 | 0.4 | 176,549 | 0.5 | 216,497 | 0.5 |
| 82. Furniture and parts thereof | 68,145 | 0.3 | 77,711 | 0.2 | 95,131 | 0.2 | 128,805 | 0.3 | 165,057 | 0.4 |
| 83. Travel goods,handbags and sim.containers | 39,822 | 0.2 | 70,247 | 0.2 | 93,653 | 0.2 | 135,236 | 0.3 | 137,607 | 0.3 |
| 84. Articles of apparel and clothing accessories | 256,483 | 1.0 | 487,519 | 1.3 | 502,230 | 1.3 | 644,590 | 1.6 | 724,655 | 1.7 |
| 85. Footwear | 140,925 | 0.5 | 257,577 | 0.7 | 345,491 | 0.9 | 463,752 | 1.2 | 427,416 | 1.0 |
| 87. Instruments and apparates n.e.s. | 449,110 | 1.7 | 981,302 | 2.7 | 1,396,249 | 3.5 | 1,379,671 | 3.5 | 1,256,372 | 3.0 |
| 88. Photographic equipment,optical goods etc. | 204,735 | 0.8 | 267,618 | 0.7 | 296,236 | 0.8 | 348,089 | 0.9 | 347,958 | 0.8 |
| 89. Miscellaneous manufactured articles,n.e.s. | 705,333 | 2.7 | 946,921 | 2.6 | 1,081,586 | 2.7 | 1,422,247 | 3.6 | 1,617,053 | 3.9 |
| 9. Goods not classified elsewhere | 32,714 | 0.1 | 21,015 | 0.1 | 10,227 | 0.0 | 721 | 0.0 | 808 | 0.0 |
| 96. Coin (not gold coin or legal) | 14 | 0.0 | 13 | 0.0 | ||||||
| 97. Gold,non-monetary | 884 | 0.0 | 2,767 | 0.0 | 10,226 | 0.0 | 706 | 0.0 | 794 | 0.0 |
| In Total | 26,019,270 | 100.0 | 36,672,484 | 100.0 | 39,489,405 | 100.0 | 39,175,940 | 100.0 | 41,724,819 | 100.0 |
| 2021 | 2022 | 2023 | 2024 | 2025 | ||||||
|---|---|---|---|---|---|---|---|---|---|---|
| 1.000 € | % | 1.000 € | % | 1.000 € | % | 1.000 € | % | 1.000 € | % | |
| 0. Food and live animals | 244,270 | 8.6 | 260,342 | 9.1 | 201,270 | 7.1 | 210,764 | 7.1 | 172,388 | 6.4 |
| 02. Dairy products and birds' eggs | 44,229 | 1.6 | 5,627 | 0.2 | 3,353 | 0.1 | 14,525 | 0.5 | 18,975 | 0.7 |
| 03. Fish and fish preparations | 5,123 | 0.2 | 10,151 | 0.4 | 7,091 | 0.2 | 3,173 | 0.1 | 8,500 | 0.3 |
| 04. Cereals and cereal preparations | 17,753 | 0.6 | 25,096 | 0.9 | 32,461 | 1.1 | 31,145 | 1.1 | 30,236 | 1.1 |
| 05. Vegetables and fruit | 112,078 | 4.0 | 98,104 | 3.4 | 118,294 | 4.2 | 134,722 | 4.6 | 85,371 | 3.1 |
| 06. Sugars,sugar preparations and honey | 9,509 | 0.3 | 6,364 | 0.2 | 4,463 | 0.2 | 4,456 | 0.2 | 5,767 | 0.2 |
| 07. Coffee,tea,cocoa,spices | 16,873 | 0.6 | 24,048 | 0.8 | 23,028 | 0.8 | 19,128 | 0.6 | 14,572 | 0.5 |
| 08. Feeding stuff for animals | 5 | 0.0 | 47 | 0.0 | 24 | 0.0 | 128 | 0.0 | ||
| 09. Miscellaneous edible products and preparations | 964 | 0.0 | 5,621 | 0.2 | 2,197 | 0.1 | 3,577 | 0.1 | 8,803 | 0.3 |
| 1. Beverages and tobacco | 5,898 | 0.2 | 8,548 | 0.3 | 7,515 | 0.3 | 4,258 | 0.1 | 4,309 | 0.2 |
| 11. Beverages | 5,301 | 0.2 | 8,093 | 0.3 | 7,475 | 0.3 | 4,133 | 0.1 | 4,278 | 0.2 |
| 12. Tobacco and tobacco manufactures | 597 | 0.0 | 455 | 0.0 | 40 | 0.0 | 125 | 0.0 | 31 | 0.0 |
| 2. Crude materials,inedible,except fuels | 1,473,163 | 52.1 | 1,475,113 | 51.4 | 1,714,340 | 60.4 | 1,783,686 | 60.4 | 1,591,899 | 58.7 |
| 21. Hides,skins,furskins,raw | 80 | 0.0 | 6 | 0.0 | 31 | 0.0 | 14 | 0.0 | 30 | 0.0 |
| 22. Oil seeds,oleaginous fruits | 3 | 0.0 | 2 | 0.0 | 85 | 0.0 | ||||
| 23. Crude rubber (incl.synthetic) | 1,410 | 0.0 | 1,083 | 0.0 | 1,072 | 0.0 | 2,586 | 0.1 | 773 | 0.0 |
| 24. Cork and wood | 121 | 0.0 | 6 | 0.0 | ||||||
| 25. Pulp and waste paper | 12 | 0.0 | 2,024 | 0.1 | 5 | 0.0 | 9 | 0.0 | 1 | 0.0 |
| 26. Textile fibres and their wastes | 56,360 | 2.0 | 31,727 | 1.1 | 134,657 | 4.7 | 89,010 | 3.0 | 125,926 | 4.6 |
| 27. Crude fertilizers and crude minerals | 613,768 | 21.7 | 528,057 | 18.4 | 492,099 | 17.3 | 496,930 | 16.8 | 493,994 | 18.2 |
| 28. Metalliferous ores and metal scrap | 793,284 | 28.1 | 903,499 | 31.5 | 1,082,605 | 38.2 | 1,191,111 | 40.3 | 966,829 | 35.7 |
| 29. Crude animal,vegetable materials n.e.s. | 8,125 | 0.3 | 8,710 | 0.3 | 3,871 | 0.1 | 3,940 | 0.1 | 4,344 | 0.2 |
| 3. Mineral fuels etc | 1,956 | 0.1 | 109,185 | 3.8 | 51,928 | 1.8 | 41,058 | 1.4 | 27,577 | 1.0 |
| 33. Petroleum and products | 1,956 | 0.1 | 109,185 | 3.8 | 51,927 | 1.8 | 41,058 | 1.4 | 27,577 | 1.0 |
| 34. Gas,natural and manufactured | ||||||||||
| 4. Animal and vegetable oils and fats | 27,986 | 1.0 | 5,168 | 0.2 | 3,009 | 0.1 | 4,028 | 0.1 | 11,052 | 0.4 |
| 41. Animal oils and fats | 2 | 0.0 | 58 | 0.0 | 1 | 0.0 | 1 | 0.0 | ||
| 42. Fixed vegetable fats and oils | 27,867 | 1.0 | 5,089 | 0.2 | 2,997 | 0.1 | 3,889 | 0.1 | 11,049 | 0.4 |
| 43. Processed animal or vegetable oils,etc. | 117 | 0.0 | 21 | 0.0 | 11 | 0.0 | 138 | 0.0 | 3 | 0.0 |
| 5. Chemicals and related products,n.e.s. | 82,188 | 2.9 | 84,825 | 3.0 | 390,407 | 13.8 | 484,411 | 16.4 | 451,736 | 16.7 |
| 51. Organic chemicals | 5,046 | 0.2 | 16,464 | 0.6 | 7,681 | 0.3 | 2,419 | 0.1 | 1,817 | 0.1 |
| 52. Inorganic chemicals | 18,341 | 0.6 | 7,437 | 0.3 | 71,515 | 2.5 | 9,260 | 0.3 | 386,631 | 14.3 |
| 53. Dyeing,tanning and colouring material | 19,639 | 0.7 | 24,304 | 0.8 | 16,356 | 0.6 | 20,200 | 0.7 | 27,382 | 1.0 |
| 54. Medicinal and pharmaceutical products | 9,300 | 0.3 | 8,120 | 0.3 | 4,014 | 0.1 | 3,966 | 0.1 | 6,341 | 0.2 |
| 55. Perfume,cleaning etc.preparations | 2,890 | 0.1 | 3,337 | 0.1 | 5,427 | 0.2 | 9,355 | 0.3 | 6,362 | 0.2 |
| 56. Fertilizers,manufactured | 1,204 | 0.0 | 586 | 0.0 | 1,086 | 0.0 | 805 | 0.0 | 1,046 | 0.0 |
| 57. Plastics in primary forms | 8,775 | 0.3 | 6,420 | 0.2 | 4,319 | 0.2 | 4,472 | 0.2 | 3,563 | 0.1 |
| 58. Plastics in non-primary forms | 9,486 | 0.3 | 10,040 | 0.3 | 9,583 | 0.3 | 12,555 | 0.4 | 6,179 | 0.2 |
| 59. Chemical materials and products,n.e.s. | 7,508 | 0.3 | 8,117 | 0.3 | 17,764 | 0.6 | 11,721 | 0.4 | 12,415 | 0.5 |
| 6. Basic manufactures | 279,652 | 9.9 | 171,418 | 6.0 | 155,156 | 5.5 | 169,355 | 5.7 | 191,794 | 7.1 |
| 61. Leather,dressed fur,etc. | 15,760 | 0.6 | 7,027 | 0.2 | 9,868 | 0.3 | 14,381 | 0.5 | 11,568 | 0.4 |
| 62. Rubber manufactures,n.e.s. | 25,354 | 0.9 | 23,279 | 0.8 | 22,022 | 0.8 | 23,415 | 0.8 | 20,681 | 0.8 |
| 63. Wood and cork manufactures | 3,876 | 0.1 | 2,260 | 0.1 | 971 | 0.0 | 925 | 0.0 | 483 | 0.0 |
| 64. Paper,paperboard and articles thereof | 6,756 | 0.2 | 2,299 | 0.1 | 2,277 | 0.1 | 1,466 | 0.0 | 889 | 0.0 |
| 65. Textile yarn,fabrics,made up articles,etc. | 43,922 | 1.6 | 48,154 | 1.7 | 51,137 | 1.8 | 61,556 | 2.1 | 59,599 | 2.2 |
| 66. Non-metallic mineral manufactures,n.e.s. | 18,301 | 0.6 | 8,817 | 0.3 | 4,693 | 0.2 | 7,091 | 0.2 | 6,224 | 0.2 |
| 67. Iron and steel | 85,407 | 3.0 | 4,266 | 0.1 | 4,320 | 0.2 | 5,017 | 0.2 | 7,611 | 0.3 |
| 68. Non-ferrous metals | 45,274 | 1.6 | 40,887 | 1.4 | 35,665 | 1.3 | 33,865 | 1.1 | 68,981 | 2.5 |
| 69. Manufactures of metals,n.e.s. | 35,001 | 1.2 | 34,426 | 1.2 | 24,203 | 0.9 | 21,640 | 0.7 | 15,759 | 0.6 |
| 7. Machinery,transport equipment | 278,760 | 9.9 | 211,794 | 7.4 | 152,789 | 5.4 | 140,267 | 4.7 | 145,949 | 5.4 |
| 71. Power generating machinery and equipment | 36,108 | 1.3 | 87,213 | 3.0 | 41,667 | 1.5 | 29,618 | 1.0 | 28,281 | 1.0 |
| 72. Machinery for specialized industries | 21,912 | 0.8 | 17,659 | 0.6 | 20,570 | 0.7 | 28,359 | 1.0 | 23,181 | 0.9 |
| 73. Metal working machinery | 2,205 | 0.1 | 3,318 | 0.1 | 2,241 | 0.1 | 1,794 | 0.1 | 2,922 | 0.1 |
| 74. General industrial machinery n.e.s. | 42,480 | 1.5 | 33,263 | 1.2 | 31,383 | 1.1 | 35,219 | 1.2 | 41,769 | 1.5 |
| 75. Office machines and adp machines | 934 | 0.0 | 1,967 | 0.1 | 1,090 | 0.0 | 1,062 | 0.0 | 1,126 | 0.0 |
| 76. Telecommunications and sound recording equipment | 4,438 | 0.2 | 3,657 | 0.1 | 3,790 | 0.1 | 2,931 | 0.1 | 2,505 | 0.1 |
| 77. Electric machinery,n.e.s.and parts | 49,111 | 1.7 | 29,730 | 1.0 | 33,025 | 1.2 | 27,208 | 0.9 | 26,347 | 1.0 |
| 78. Road vehicles | 18,459 | 0.7 | 12,159 | 0.4 | 11,549 | 0.4 | 11,868 | 0.4 | 13,029 | 0.5 |
| 79. Other transport equipment | 103,112 | 3.6 | 22,828 | 0.8 | 7,475 | 0.3 | 2,208 | 0.1 | 6,789 | 0.3 |
| 8. Miscellaneous manufactured articles | 205,180 | 7.3 | 160,978 | 5.6 | 145,376 | 5.1 | 112,621 | 3.8 | 109,182 | 4.0 |
| 81. Prefabr.buildings;sanitary,lighting etc.fixtrs | 52,629 | 1.9 | 20,689 | 0.7 | 16,315 | 0.6 | 7,648 | 0.3 | 7,758 | 0.3 |
| 82. Furniture and parts thereof | 10,385 | 0.4 | 5,134 | 0.2 | 4,337 | 0.2 | 7,764 | 0.3 | 7,786 | 0.3 |
| 83. Travel goods,handbags and sim.containers | 3,421 | 0.1 | 2,170 | 0.1 | 781 | 0.0 | 792 | 0.0 | 528 | 0.0 |
| 84. Articles of apparel and clothing accessories | 55,435 | 2.0 | 52,587 | 1.8 | 52,529 | 1.9 | 43,960 | 1.5 | 39,356 | 1.5 |
| 85. Footwear | 729 | 0.0 | 313 | 0.0 | 287 | 0.0 | 297 | 0.0 | 312 | 0.0 |
| 87. Instruments and apparates n.e.s. | 64,029 | 2.3 | 60,005 | 2.1 | 54,848 | 1.9 | 39,793 | 1.3 | 36,416 | 1.3 |
| 88. Photographic equipment,optical goods etc. | 750 | 0.0 | 498 | 0.0 | 42 | 0.0 | 182 | 0.0 | 483 | 0.0 |
| 89. Miscellaneous manufactured articles,n.e.s. | 17,802 | 0.6 | 19,582 | 0.7 | 16,238 | 0.6 | 12,157 | 0.4 | 16,545 | 0.6 |
| 9. Goods not classified elsewhere | 226,089 | 8.0 | 384,546 | 13.4 | 15,311 | 0.5 | 4,056 | 0.1 | 4,623 | 0.2 |
| 96. Coin (not gold coin or legal) | ||||||||||
| 97. Gold,non-monetary | 7,981 | 0.3 | 15,102 | 0.5 | ||||||
| In Total | 2,825,143 | 100.0 | 2,871,917 | 100.0 | 2,837,101 | 100.0 | 2,954,505 | 100.0 | 2,710,510 | 100.0 |