
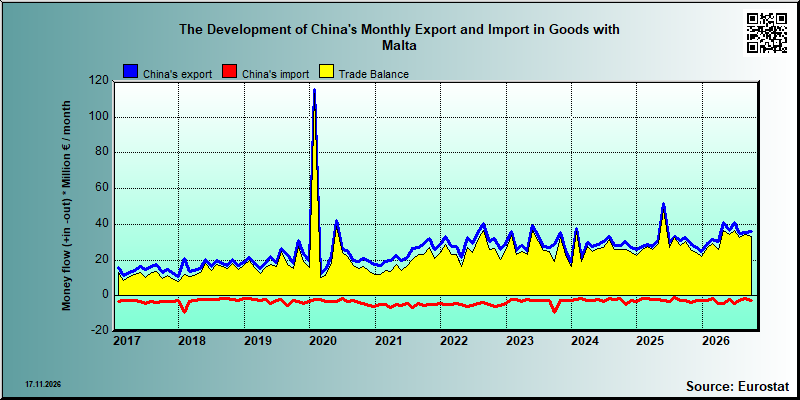
| China's value of trade in goods with different European countries |
Data:Eurostat
| 2026/5 | 2026/6 | 2026/7 | 2026/8 | 2026/9 | ||||||
|---|---|---|---|---|---|---|---|---|---|---|
| 1.000 € | % | 1.000 € | % | 1.000 € | % | 1.000 € | % | 1.000 € | % | |
| 0. Food and live animals | 327 | 0.9 | 601 | 1.5 | 1,082 | 3.1 | 566 | 1.6 | 1,267 | 3.5 |
| 01. Meat and meat preparations | 35 | 0.1 | 84 | 0.2 | 35 | 0.1 | 69 | 0.2 | ||
| 02. Dairy products and birds' eggs | 5 | 0.0 | ||||||||
| 03. Fish and fish preparations | 53 | 0.1 | 233 | 0.6 | 627 | 1.8 | 344 | 1.0 | 845 | 2.4 |
| 04. Cereals and cereal preparations | 12 | 0.0 | 16 | 0.0 | 69 | 0.2 | 38 | 0.1 | 87 | 0.2 |
| 05. Vegetables and fruit | 178 | 0.5 | 214 | 0.5 | 260 | 0.7 | 100 | 0.3 | 214 | 0.6 |
| 06. Sugars,sugar preparations and honey | 2 | 0.0 | 3 | 0.0 | 4 | 0.0 | 20 | 0.1 | 2 | 0.0 |
| 07. Coffee,tea,cocoa,spices | 8 | 0.0 | 8 | 0.0 | 23 | 0.1 | 1 | 0.0 | ||
| 08. Feeding stuff for animals | 30 | 0.1 | ||||||||
| 09. Miscellaneous edible products and preparations | 38 | 0.1 | 43 | 0.1 | 59 | 0.2 | 64 | 0.2 | 20 | 0.1 |
| 1. Beverages and tobacco | 11 | 0.0 | ||||||||
| 11. Beverages | 11 | 0.0 | ||||||||
| 2. Crude materials,inedible,except fuels | 178 | 0.5 | 227 | 0.6 | 17 | 0.0 | 19 | 0.1 | 83 | 0.2 |
| 22. Oil seeds,oleaginous fruits | 28 | 0.1 | 12 | 0.0 | 47 | 0.1 | ||||
| 23. Crude rubber (incl.synthetic) | 1 | 0.0 | ||||||||
| 24. Cork and wood | 31 | 0.1 | 199 | 0.5 | 3 | 0.0 | 33 | 0.1 | ||
| 26. Textile fibres and their wastes | 2 | 0.0 | ||||||||
| 27. Crude fertilizers and crude minerals | 1 | 0.0 | 11 | 0.0 | 3 | 0.0 | 1 | 0.0 | ||
| 28. Metalliferous ores and metal scrap | 1 | 0.0 | ||||||||
| 29. Crude animal,vegetable materials n.e.s. | 146 | 0.4 | 5 | 0.0 | ||||||
| 3. Mineral fuels etc | 10 | 0.0 | ||||||||
| 33. Petroleum and products | 10 | 0.0 | ||||||||
| 4. Animal and vegetable oils and fats | 9 | 0.0 | 7 | 0.0 | ||||||
| 42. Fixed vegetable fats and oils | 9 | 0.0 | 7 | 0.0 | ||||||
| 5. Chemicals and related products,n.e.s. | 3,968 | 10.9 | 4,340 | 10.6 | 4,509 | 12.9 | 4,030 | 11.3 | 4,556 | 12.7 |
| 51. Organic chemicals | 1,461 | 4.0 | 1,648 | 4.0 | 2,279 | 6.5 | 1,577 | 4.4 | 1,138 | 3.2 |
| 52. Inorganic chemicals | 272 | 0.7 | 86 | 0.2 | 1 | 0.0 | 65 | 0.2 | 26 | 0.1 |
| 53. Dyeing,tanning and colouring material | 3 | 0.0 | 57 | 0.1 | 30 | 0.1 | 68 | 0.2 | 6 | 0.0 |
| 54. Medicinal and pharmaceutical products | 950 | 2.6 | 1,202 | 2.9 | 708 | 2.0 | 1,234 | 3.5 | 1,973 | 5.5 |
| 55. Perfume,cleaning etc.preparations | 94 | 0.3 | 212 | 0.5 | 191 | 0.5 | 124 | 0.3 | 122 | 0.3 |
| 57. Plastics in primary forms | 620 | 1.7 | 283 | 0.7 | 570 | 1.6 | 166 | 0.5 | 542 | 1.5 |
| 58. Plastics in non-primary forms | 379 | 1.0 | 346 | 0.8 | 397 | 1.1 | 433 | 1.2 | 550 | 1.5 |
| 59. Chemical materials and products,n.e.s. | 190 | 0.5 | 507 | 1.2 | 333 | 1.0 | 362 | 1.0 | 200 | 0.6 |
| 6. Basic manufactures | 5,050 | 13.9 | 6,543 | 16.0 | 5,135 | 14.7 | 5,906 | 16.6 | 6,711 | 18.7 |
| 61. Leather,dressed fur,etc. | 8 | 0.0 | 21 | 0.1 | 7 | 0.0 | 10 | 0.0 | 8 | 0.0 |
| 62. Rubber manufactures,n.e.s. | 261 | 0.7 | 643 | 1.6 | 152 | 0.4 | 116 | 0.3 | 555 | 1.5 |
| 63. Wood and cork manufactures | 187 | 0.5 | 543 | 1.3 | 468 | 1.3 | 399 | 1.1 | 566 | 1.6 |
| 64. Paper,paperboard and articles thereof | 381 | 1.0 | 514 | 1.3 | 666 | 1.9 | 664 | 1.9 | 429 | 1.2 |
| 65. Textile yarn,fabrics,made up articles,etc. | 929 | 2.6 | 1,167 | 2.8 | 440 | 1.3 | 636 | 1.8 | 530 | 1.5 |
| 66. Non-metallic mineral manufactures,n.e.s. | 893 | 2.5 | 582 | 1.4 | 549 | 1.6 | 1,079 | 3.0 | 1,025 | 2.9 |
| 67. Iron and steel | 27 | 0.1 | 214 | 0.5 | 924 | 2.7 | 1,191 | 3.3 | 1,528 | 4.3 |
| 68. Non-ferrous metals | 444 | 1.2 | 971 | 2.4 | 495 | 1.4 | 212 | 0.6 | 338 | 0.9 |
| 69. Manufactures of metals,n.e.s. | 1,920 | 5.3 | 1,888 | 4.6 | 1,434 | 4.1 | 1,600 | 4.5 | 1,732 | 4.8 |
| 7. Machinery,transport equipment | 17,739 | 48.8 | 17,975 | 43.9 | 16,380 | 47.0 | 16,051 | 45.1 | 14,039 | 39.1 |
| 71. Power generating machinery and equipment | 2,591 | 7.1 | 1,572 | 3.8 | 6,383 | 18.3 | 867 | 2.4 | 1,740 | 4.8 |
| 72. Machinery for specialized industries | 598 | 1.6 | 1,003 | 2.4 | 769 | 2.2 | 734 | 2.1 | 738 | 2.1 |
| 73. Metal working machinery | 105 | 0.3 | 133 | 0.3 | 89 | 0.3 | 52 | 0.1 | 274 | 0.8 |
| 74. General industrial machinery n.e.s. | 4,391 | 12.1 | 6,649 | 16.2 | 2,801 | 8.0 | 4,044 | 11.4 | 4,528 | 12.6 |
| 75. Office machines and adp machines | 836 | 2.3 | 1,011 | 2.5 | 1,078 | 3.1 | 4,260 | 12.0 | 605 | 1.7 |
| 76. Telecommunications and sound recording equipment | 945 | 2.6 | 784 | 1.9 | 436 | 1.3 | 1,029 | 2.9 | 833 | 2.3 |
| 77. Electric machinery,n.e.s.and parts | 3,761 | 10.3 | 4,210 | 10.3 | 4,050 | 11.6 | 4,248 | 11.9 | 4,644 | 12.9 |
| 78. Road vehicles | 4,430 | 12.2 | 963 | 2.3 | 759 | 2.2 | 805 | 2.3 | 634 | 1.8 |
| 79. Other transport equipment | 82 | 0.2 | 1,651 | 4.0 | 14 | 0.0 | 12 | 0.0 | 42 | 0.1 |
| 8. Miscellaneous manufactured articles | 9,057 | 24.9 | 11,289 | 27.5 | 7,683 | 22.1 | 8,984 | 25.3 | 9,230 | 25.7 |
| 81. Prefabr.buildings;sanitary,lighting etc.fixtrs | 520 | 1.4 | 635 | 1.5 | 549 | 1.6 | 624 | 1.8 | 914 | 2.5 |
| 82. Furniture and parts thereof | 1,690 | 4.7 | 2,255 | 5.5 | 2,083 | 6.0 | 1,496 | 4.2 | 2,554 | 7.1 |
| 83. Travel goods,handbags and sim.containers | 322 | 0.9 | 522 | 1.3 | 283 | 0.8 | 434 | 1.2 | 354 | 1.0 |
| 84. Articles of apparel and clothing accessories | 2,386 | 6.6 | 2,890 | 7.1 | 1,178 | 3.4 | 1,810 | 5.1 | 1,180 | 3.3 |
| 85. Footwear | 299 | 0.8 | 409 | 1.0 | 205 | 0.6 | 449 | 1.3 | 166 | 0.5 |
| 87. Instruments and apparates n.e.s. | 641 | 1.8 | 862 | 2.1 | 509 | 1.5 | 525 | 1.5 | 410 | 1.1 |
| 88. Photographic equipment,optical goods etc. | 165 | 0.5 | 282 | 0.7 | 176 | 0.5 | 176 | 0.5 | 117 | 0.3 |
| 89. Miscellaneous manufactured articles,n.e.s. | 3,033 | 8.3 | 3,434 | 8.4 | 2,700 | 7.8 | 3,470 | 9.8 | 3,535 | 9.8 |
| 9. Goods not classified elsewhere | 5 | 0.0 | 2 | 0.0 | 6 | 0.0 | 4 | 0.0 | ||
| 97. Gold,non-monetary | 5 | 0.0 | 2 | 0.0 | 6 | 0.0 | 4 | 0.0 | ||
| In Total | 36,344 | 100.0 | 40,977 | 100.0 | 34,817 | 100.0 | 35,570 | 100.0 | 35,890 | 100.0 |
| 2026/5 | 2026/6 | 2026/7 | 2026/8 | 2026/9 | ||||||
|---|---|---|---|---|---|---|---|---|---|---|
| 1.000 € | % | 1.000 € | % | 1.000 € | % | 1.000 € | % | 1.000 € | % | |
| 0. Food and live animals | 150 | 6.6 | 391 | 9.3 | 324 | 13.5 | 28 | 1.9 | 32 | 1.3 |
| 01. Meat and meat preparations | ||||||||||
| 02. Dairy products and birds' eggs | ||||||||||
| 03. Fish and fish preparations | 150 | 6.6 | 391 | 9.3 | 318 | 13.2 | 28 | 1.9 | 32 | 1.3 |
| 04. Cereals and cereal preparations | ||||||||||
| 05. Vegetables and fruit | ||||||||||
| 06. Sugars,sugar preparations and honey | ||||||||||
| 07. Coffee,tea,cocoa,spices | ||||||||||
| 08. Feeding stuff for animals | 7 | 0.3 | ||||||||
| 09. Miscellaneous edible products and preparations | ||||||||||
| 1. Beverages and tobacco | ||||||||||
| 11. Beverages | ||||||||||
| 2. Crude materials,inedible,except fuels | 26 | 1.2 | ||||||||
| 22. Oil seeds,oleaginous fruits | ||||||||||
| 23. Crude rubber (incl.synthetic) | ||||||||||
| 24. Cork and wood | ||||||||||
| 26. Textile fibres and their wastes | ||||||||||
| 27. Crude fertilizers and crude minerals | ||||||||||
| 28. Metalliferous ores and metal scrap | ||||||||||
| 29. Crude animal,vegetable materials n.e.s. | 26 | 1.2 | ||||||||
| 3. Mineral fuels etc | ||||||||||
| 33. Petroleum and products | ||||||||||
| 4. Animal and vegetable oils and fats | ||||||||||
| 42. Fixed vegetable fats and oils | ||||||||||
| 5. Chemicals and related products,n.e.s. | 916 | 40.5 | 2,220 | 52.6 | 493 | 20.5 | 343 | 22.7 | 486 | 19.9 |
| 51. Organic chemicals | 406 | 18.0 | 323 | 7.7 | 190 | 7.9 | 6 | 0.2 | ||
| 52. Inorganic chemicals | ||||||||||
| 53. Dyeing,tanning and colouring material | ||||||||||
| 54. Medicinal and pharmaceutical products | 7 | 0.5 | ||||||||
| 55. Perfume,cleaning etc.preparations | 21 | 0.9 | ||||||||
| 57. Plastics in primary forms | 17 | 0.7 | ||||||||
| 58. Plastics in non-primary forms | 510 | 22.6 | 1,897 | 44.9 | 266 | 11.1 | 335 | 22.2 | 481 | 19.6 |
| 59. Chemical materials and products,n.e.s. | ||||||||||
| 6. Basic manufactures | 586 | 25.9 | 595 | 14.1 | 426 | 17.7 | 562 | 37.2 | 562 | 23.0 |
| 61. Leather,dressed fur,etc. | ||||||||||
| 62. Rubber manufactures,n.e.s. | 580 | 25.7 | 586 | 13.9 | 397 | 16.5 | 559 | 37.0 | 558 | 22.8 |
| 63. Wood and cork manufactures | ||||||||||
| 64. Paper,paperboard and articles thereof | 1 | 0.1 | ||||||||
| 65. Textile yarn,fabrics,made up articles,etc. | ||||||||||
| 66. Non-metallic mineral manufactures,n.e.s. | ||||||||||
| 67. Iron and steel | ||||||||||
| 68. Non-ferrous metals | ||||||||||
| 69. Manufactures of metals,n.e.s. | 5 | 0.2 | 9 | 0.2 | 28 | 1.2 | 3 | 0.2 | 4 | 0.2 |
| 7. Machinery,transport equipment | 350 | 15.5 | 592 | 14.0 | 762 | 31.7 | 379 | 25.1 | 917 | 37.4 |
| 71. Power generating machinery and equipment | 3 | 0.1 | ||||||||
| 72. Machinery for specialized industries | 17 | 0.7 | 21 | 0.5 | 10 | 0.4 | 9 | 0.6 | ||
| 73. Metal working machinery | ||||||||||
| 74. General industrial machinery n.e.s. | 42 | 1.9 | 66 | 1.6 | 130 | 5.4 | 65 | 4.3 | 158 | 6.5 |
| 75. Office machines and adp machines | 7 | 0.2 | 1 | 0.0 | 8 | 0.5 | 7 | 0.3 | ||
| 76. Telecommunications and sound recording equipment | 62 | 2.7 | 99 | 2.3 | 98 | 4.1 | 68 | 4.5 | 157 | 6.4 |
| 77. Electric machinery,n.e.s.and parts | 230 | 10.2 | 370 | 8.8 | 521 | 21.7 | 229 | 15.1 | 595 | 24.3 |
| 78. Road vehicles | 30 | 0.7 | ||||||||
| 79. Other transport equipment | ||||||||||
| 8. Miscellaneous manufactured articles | 232 | 10.3 | 424 | 10.0 | 400 | 16.6 | 198 | 13.1 | 451 | 18.4 |
| 81. Prefabr.buildings;sanitary,lighting etc.fixtrs | ||||||||||
| 82. Furniture and parts thereof | ||||||||||
| 83. Travel goods,handbags and sim.containers | ||||||||||
| 84. Articles of apparel and clothing accessories | 5 | 0.2 | 1 | 0.0 | 1 | 0.0 | 18 | 1.2 | ||
| 85. Footwear | 7 | 0.5 | ||||||||
| 87. Instruments and apparates n.e.s. | 169 | 7.5 | 248 | 5.9 | 311 | 12.9 | 105 | 7.0 | 343 | 14.0 |
| 88. Photographic equipment,optical goods etc. | 42 | 1.8 | 8 | 0.3 | 8 | 0.5 | 9 | 0.4 | ||
| 89. Miscellaneous manufactured articles,n.e.s. | 16 | 0.7 | 175 | 4.1 | 80 | 3.3 | 59 | 3.9 | 99 | 4.0 |
| 9. Goods not classified elsewhere | ||||||||||
| 97. Gold,non-monetary | ||||||||||
| In Total | 2,260 | 100.0 | 4,222 | 100.0 | 2,405 | 100.0 | 1,510 | 100.0 | 2,450 | 100.0 |